Abstract
MK801-induced activation of caspase-3 is developmentally regulated, peaking at postnatal day (P) 7 and decreasing with increasing postnatal age thereafter. Further, at P7, cells displaying activation of caspase-3 lack expression of calcium binding proteins (CaBPs). To further explore this relationship, we investigated postnatal expression of calbindin (CB), calretinin (CR) and parvalbumin (PV) in two brain regions susceptible to MK801-induced injury, the somatosensory cortex (S1) and layer II/III of motor cortex (M1/M2). Expression of CB and especially PV was low to absent prior to P7 but substantially increased from P7 through to P21 and adulthood. In contrast, CR expression was more variable at early developmental ages, stabilized to lower levels after P7 and showed a marked decline by P21. The results suggest that not only does calcium buffering capacity increase developmentally but acquisition of enhanced buffering may be one mechanism by which neurons survive agent-induced alterations in calcium homeostasis.
Keywords: glutamate, NMDA, antagonist, calcium buffering, development, rat, neonatal brain injury
Changes in intracellular calcium concentration regulate intracellular signaling cascades that affect neuronal proliferation, maturation, gene expression and transcription, and cell death (Carafoli, 2002; Evenas, Malmendal, & Forsen, 1998). Calcium flow into neurons is regulated by voltage- or receptor-operated channels (Evenas et al., 1998) whereas intracellularly, calcium levels are maintained by sequestration in stores or bound to buffering proteins, facilitating calcium homeostasis and normal neuronal function (Berridge, Lipp, & Bootman, 2000; Evenas et al., 1998; Miller, 1988). Work from our group and others suggests that neuronal populations have a developmentally regulated calcium set-point which is optimal for survival (Johnson, Koike, & Franklin, 1992; Turner, Connell, Blackstone, & Ringler, 2007a; Turner, Pulciani, & Rivkees, 2002).
Calcium binding proteins (CaBPs) are widely distributed in the central nervous system. The subtype of CaBPs that regulate calcium homeostasis within neurons include calbindin-D-28K (CB), calretinin (CR) and parvalbumin (PV). These CaBPs are typically present in non-overlapping subpopulations of nerve cells (Baimbridge, Celio, & Rogers, 1992; Celio, 1990; Heizmann, 1992; Schwaller, Meyer, & Schiffmann, 2002). Control of intracellular calcium homeostasis may be particularly critical during development as in vivo studies have shown that blockade of N-methyl-D-aspartate receptors (NMDARs) by MK801 and blockade of voltage-gated calcium channels by nimodipine induce activation of caspase-3 and lead to apoptotic cell death during a period of vulnerability in development. (Ikonomidou, Bosch, Miksa, Bittigau, Vockler, Dikranian, Tenkova, Stefovska, Turski, & Olney, 1999; Lema Tomé, Bauer, Nottingham, Smith, Blackstone, Brown, Hlavaty, Nelson, Daker, Sola, Miller, Bryan, & Turner, 2006a; Turner, Miller, Smith, Brown, Blackstone, Dunham, Strehlow, Manfredi, Slocum, Iverson, West, Ringler, & Berry, 2007b). Furthermore, in vitro studies have directly linked apoptotic injury with decreased [Ca2+]i, and agents that raise [Ca2+]i can protect against such injury (Takadera, Matsuda, & Ohyashiki, 1999; Turner et al., 2007a; Turner et al., 2002).
In animal models, agent-induced apoptosis is not only developmentally regulated but is also region specific. For example, the somatosensory cortex (S1) and layer II of primary and secondary motor cortex (M1 and M2) are regions susceptible to age-dependent MK801-induced apoptosis (Lema Tomé et al., 2006a; Lema Tomé, Nottingham, Smith, Beauchamp, Leung, & Turner, 2006b; Turner et al., 2007b). The neuronal populations found in these regions include both pyramidal and non-pyramidal cells that are immunoreactive for CaBPs (Alcantara, Ferrer, & Soriano, 1993; Alcantara, Soriano, & Ferrer, 1996; Celio, 1990; Conde, Lund, Jacobowitz, Baimbridge, & Lewis, 1994; de Lecea, del Rio, & Soriano, 1995). Consistent with a role in regulating intracellular Ca2+ and enhancing neuronal survival, CaBP expression in degenerating cells within these regions is inversely related to activated caspase-3 (Lema Tomé et al., 2006a). Specifically, at P7, MK801-induced activated caspase-3-positive cells intermingle with CB, CR or PV cells in the same territory but are rarely found in the same cell. Further, areas where entire territories express, for example, CB do not overlap with areas where there are particularly high levels of activated caspase-3. Further still, by P21, brain regions that previously expressed high levels of activated caspase-3 instead display heavy labeling for CaBPs, in particular PV (Lema Tomé et al., 2006a). What this previous study did not reveal was precisely when changes in CaBP expression occurred and if they coincided with loss of MK801 sensitivity.
To further understand the relationship between age-dependent apoptosis and CaBP, this paper is the second report of a series that compare expression of CB, CR and PV across postnatal development in several brain regions. In the S1 somatosensory cortex and cortical layer II/III of M1 and M2 regions, we found that whereas CB and CR were modestly expressed at earlier ages (P0-P7), PV was essentially absent. As animals mature (P7-P21), changes in expression of all three CaBPs were observed, with the surge in PV being particularly impressive. During this later age period, MK801-induced activated caspase-3 was highest at P7, modest at P14 and absent at P21. These results suggest that developmental changes in neuronal ability to buffer calcium fluctuations may be one mechanism by which survival in the face of MK801 insult is achieved.
Methods
Animal Groups and Treatments
All animals and procedures used in this study were approved by the Wake Forest University Medical School Animal Care and Use Committee in accordance with National Institutes of Health guidelines. All chemicals were purchased from Sigma-Aldrich (St Louis, MO) unless otherwise stated. To determine age-dependency of NMDAR blockade-induced apoptosis three ages were used in this study: postnatal day (P) 7, P14 and P21. Pups (n=6 for each age investigated) were treated with a single subcutaneous injection of the NMDAR selective antagonist MK801 (dizocilpine; 1 mg/kg), a dose known to induce robust apoptotic injury (Lema Tomé et al., 2006a; Turner et al., 2007b). Control rats (n=3 for each age investigated) were injected with vehicle (phosphate buffered saline (PBS), pH = 7.4). Animals were returned to their cages after injection and 8 hours later (a time when activated caspase-3 expression is maximal) perfused and brains prepared for immunohistochemistry (IHC; see below). To precisely determine expression of CaBP animals across the neonatal period, pups (n=3 for each age investigated) of postnatal ages 0, 1, 2, 4, 7, 10, 14, 17, 21 were included in this study. To determine if additional changes in expression patterns occur after the postnatal period, adult animals (n=3) were also examined.
Immunohistochemistry
After 8 hours following injections (see above) animals were deeply anesthetized (2% halothane) and fixed by transcardial perfusion through the heart with PBS (pH = 7.4) followed by 4% paraformaldehyde in PBS (PFA). Brains were removed and fixed overnight in 4% PFA. Brains were then cryoprotected in 30% sucrose-PBS at 4°C for 2−3 days. Brains were frozen onto a freezing microtome stage and sections were cut to a thickness of 50 μm. Free-floating serial sections were collected and stored in PBS. Sections collected spanned the anterior frontal cortex to the level of the midbrain.
To detect apoptosis sections from vehicle and MK801-treated animals were subjected to antigen-retrieval by heating to 90°C in citrate buffer (0.01M sodium citrate, pH 6.0) for 5 min, followed by 2 min on ice. Sections were washed briefly in PBS prior to IHC. An anti-activated-caspase-3 primary antibody (rabbit polyclonal, Cell Signaling, Beverly, MA, diluted 1:2000) in IHC buffer (PBS/1% BSA/0.1% TX100) was used to detect cleaved caspase-3 immunoreactive cells. After 24 hours, sections were washed in PBS (x3) and exposed to biotinylated, goat anti-rabbit secondary antibody (1:200 dilution, Vector, Burlingame, CA); visualized using an ABC Elite kit (Vector Labs) followed by VIP as the chromagen (Vector Labs). Sections were mounted onto SuperFrost Plus slides (Fisher, Pittsburgh, PA), dehydrated in alcohol (75%, 95%, 100%, 100%, 3 min each) and cover-slipped.
Additionally, sections derived from P14 animals were processed for double immunofluorescence to determine if the inverse relationship between expression of activated-caspase-3 positive cells and CaBPs was observed at the middle age as it was at P7 in previous studies (Lema Tomé et al., 2006a). IHC was performed using the antigen retrieval techniques described above. Free-floating sections were exposed to a rabbit anti-activated-caspase-3, primary antibody (Cell Signaling 1:1000 in IHC buffer) overnight. After washing the sections in PBS (x3) the secondary antibody AlexaFluor 488 goat-anti-rabbit (1:200 in IHC buffer; Molecular Probes, Eugene, OR) was applied for 2 hr, followed by PBS washes (x3). Parallel sections were then exposed to another primary antibody for double labeling. The antibodies used were: mouse monoclonal anti-calbindin 28K antibody (1:10,000; Swant, Bellinzona, Switzerland), a mouse monoclonal anti-calretinin (1:1000; Chemicon, Temecula, CA), or a mouse monoclonal anti-parvalbumin antibody (1:2000; Swant). All antibodies were diluted in IHC buffer and applied for 24 hr at 4°C. After washing the sections in PBS (x3), they were incubated with the secondary antibody AlexaFluor 594 donkey-anti-mouse, (1:200 in IHC buffer; Molecular Probes) for 2 hr. Finally, sections were washed in PBS (x3) and mounted onto SuperFrost Plus slides (Fisher), covered with Vectashield (Vector Labs) to protect fluorescent signals and coverslipped for viewing under UV light. Parallel sections throughout each brain region were double-labeled according to the following order: 1st = activated caspase-3/CB, 2nd = activated caspase-3/CR, 3rd = activated caspase-3/PV.
To determine CaBP expression during development, sections from P0-P21 and adult rats were processed for bright-field microscopy. Free-floating sections were incubated with the mouse monoclonal anti-calbindin 28K antibody (1:20,000; Swant), a rabbit polyclonal anti-calretinin (1:1000; Chemicon), or a mouse monoclonal anti-parvalbumin antibody (1:2000; Swant) in IHC buffer overnight at 4°C. After rinsing with PBS (x3), free-floating sections were exposed to the secondary antibody, a rat-adsorbed, horse anti-mouse, biotinylated secondary antibody (1:200 dilution, Vector Labs). The immuno-staining was visualized using an ABC Elite kit followed by VIP (Vector Labs). Finally, sections were mounted onto SuperFrost Plus slides (Fisher), dehydrated in alcohol (75%, 95%, 100%, 100%, 3 min each) and cover-slipped.
Cell Counting
Brain regions, including specific layers, were identified as described (Paxinos, 2004; Paxinos & Watson, 1998). In this study we sampled from the S1 cortex, which we divided into rostral (spanning S1J, S1JO, S1DZ, S1ULp, S1FL and S1HL) and caudal (spanning the S1BF and S1T) regions and from the cortical layer II-III in primary (M1) and secondary (M2) motor cortex as previous studies indicate that these areas are sensitive to MK801 at P7 but not P21 (Lema Tomé et al., 2006a; Turner et al., 2007b). Sections were digitally captured under bright field or fluorescence using an IX70 inverted microscope (Olympus, Melville, NY), with an Orca 238 digital camera (Hamamatsu, Bridgewater, NJ) and IPLab software (IPLab v3.65a; Scanalytics, Billerica, MA). For calibration purposes, an image of a stage micrometer was captured at the same magnification.
We wish to stress that these studies were not performed stereologically. Thus, the numbers we provide reflect relative changes in CaBP expression throughout the postnatal period and represent a developmental trend. These semi-quantitative data are presented to give the reader a clear sense of this trend. For semi-quantitative analysis, images were imported into Image Pro Plus 5.1 (Image Pro, Media Cybernetics, Silver Springs, MD) and observers blind to the developmental age (all authors except CLT and CPT), counted cells using automated analysis features. In adult brains, weakly stained CB-positive cells have previously been observed in layers II-III in contrast to heavily stained cells in other layers (Alcantara et al., 1993; van Brederode, Helliesen, & Hendrickson, 1991). Thus, using pilot studies to confirm these observations and guide our analyses, we determined cell numbers based upon intensity thresholding (scale of 0 = absolute black, 255 = absolute white), where weakly stained cells (such as those found in layer II/III of older animals) ranged from >50 - <150 and strongly stained cells (all other layers in older animals) ranged from 0 - <50; background staining was found to fall between 200−255. To account for the non-stereological approach and obtain a conservative estimation of cell number, we also used size thresholding, and, again based upon pilot studies designed to discriminate non-cellular elements from cells, we preset the software to sample cells >20 units for ages P0 and P4 (which corresponded to a mean diameter >5 μm), and >40 units for ages P17 and above (diameter >7 μm). Additionally, potential variance in inter-observer estimations was accounted for by comparing data obtained by different individuals sampling from the same section and region. For each protein studied every 6th section throughout each region were sampled and the number of positive cells counted. For younger animals (P0-P4) we used 4−8 sections per region, for more mature animals (P7-P10) we used 8−12 sections per region and for older animals (P14-adult) we used 12−15 sections per region. Data was expressed as mean number of CaBP-positive cells per section ± SEM for each age group. Each panel shown in figures was the region of interest sampled.
Statistics
A one-way ANOVA using a Bonferroni post-test comparison of means (Prism 4.0, Graph Pad, San Diego, CA) was used to determine if significant differences existed between age groups for each CaBP.
Results
Activated caspase-3: P7, P14 and P21
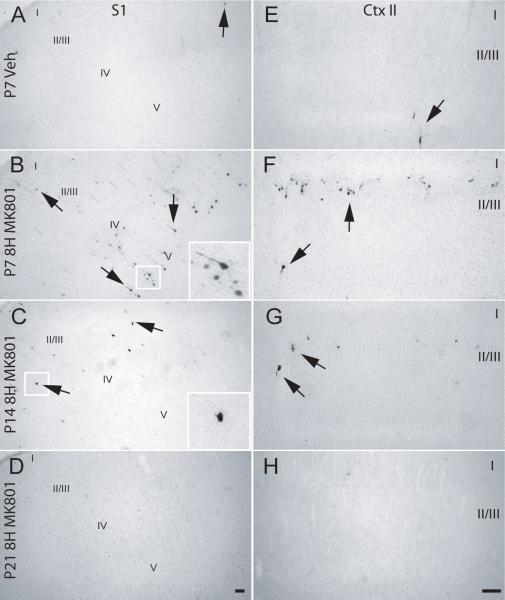
Previous studies by our lab have quantified developmentally regulated activated caspase-3 induction following MK801 treatment of neonatal rats (Lema Tomé et al., 2006a; Turner et al., 2007b). As observed in these previous studies, no evidence for expression of the pro-apoptotic marker was found in vehicle-treated P7 animals (Fig. 1A). In contrast, 8 hours after MK801 injection, activated caspase-3 positive cells were found in the S1 of P7 animals (Fig. 1B). Activated caspase-3 immunoreactivity (-ir) were mostly found in deeper layers of S1 with few profiles found in upper layers and cells exhibited staining in the soma and proximal processes (Fig. 1B). At P14, the number of activated caspase-3 positive cells were greatly diminished in the somatosensory cortex and staining was restricted to the cell body (Fig. 1C), whereas at P21 no activated caspase-3 positive profiles were found (Fig. 1D).
Fig. 1. NMDAR blockade induces activated caspase-3 expression in the neonatal brain.
P7, P14 or P21 rats were treated with a single subcutaneous injections of vehicle or MK801 (1 mg/kg) and at 8 hours later animals were sacrificed. Expression of activated caspase-3 was determined by immunohistochemistry in the S1 (A, B, C, and D) and in layer II of M1/M2 (E, F, G and H): (A and E) P7 vehicle; (B and F) P7 8 hr-MK801; (C and G) P14 8 hr-MK801; and (D and H) P21 8 hr-MK801. Vehicle not shown for P14 and P21. Arrows - activated caspase-3-positive cells; scale bar is 50 μm.
In cortical layer II/III (Ctx II/III) of M1/M2, activated caspase-3 expression was robust following MK801 treatment when compared to vehicle-treated P7 animals (Fig. 1E&F). MK801 treatment at P14 led to a small number of activated caspase-3 positive cells in Ctx II/III (Fig. 1G) whereas similar treatment of P21 animals did not produce apoptotic profiles (Fig. 1H). Data from both CNS regions are consistent with previous studies from our lab that examine injury from NMDAR blockade in other parts of the brain (Lema Tomé, Miller, Bauer, Nottingham, Smith, Blackstone, Brown, Bryan, Leigh, Brady, Busch, & Turner, 2007), or using independent markers of apoptosis (Ikonomidou et al., 1999; Turner et al., 2007b).
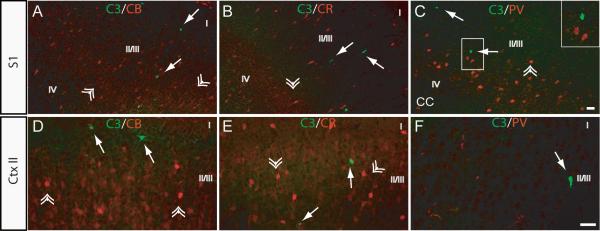
We have previously shown that at P7, a time when MK801-induced injury is maximal, activated caspase-3 staining is inversely correlated with CaBP expression (Lema Tomé et al., 2006a). Likewise, in this study, at P14 (at time when MK801 toxicity is still present) no evidence of co-expression between CaBPs and activated caspase-3 was found in either divisions of S1 (Fig. 2A, B, C) or Ctx II of M1/M2 (Fig. 2D, E, F), supporting previous findings documented in the first paper in this series (Lema Tomé et al., 2007).
Fig. 2. CaBP-negative cells in S1 and layer II of M1/M2 display caspase-3 activation following NMDAR blockade.
P14 rats were treated with single subcutaneous injections of vehicle or MK801 (1 mg/kg) as described (Methods). Expression of activated caspase-3 and CB, CR or PV was determined by double immunofluorescence (see Methods) in the S1 (A-C) and layer II of M1/M2 (D-F). Co-labeling for activated caspase-3 (C3) and (A and D) CB, (B and E) CR, or (C and F) PV in sections from P14 animals treated with MK801. Inset in C is the magnified area outlined illustrating the inverse relationship between activated caspase-3 positive cell and PV-expressing neurons. Arrows - activated caspase-3 positive cell(s), double arrowhead - CaBPs-positive cell(s), I-V indicate approximate location of layers, scale bar is 50 μm.
Calcium Binding Proteins: Somatosensory Cortex
P0-P4
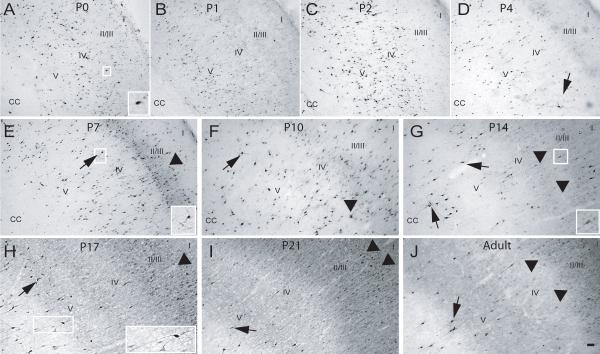
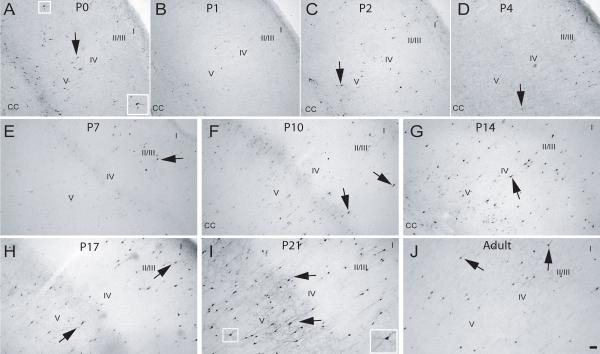
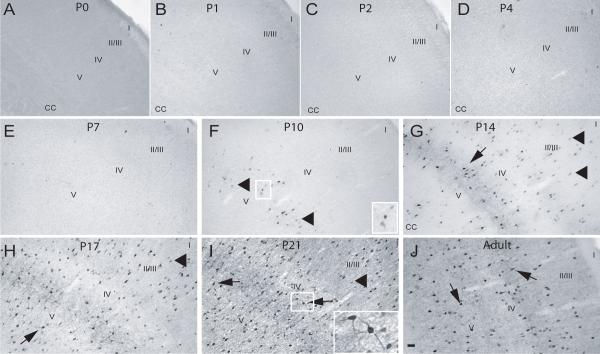
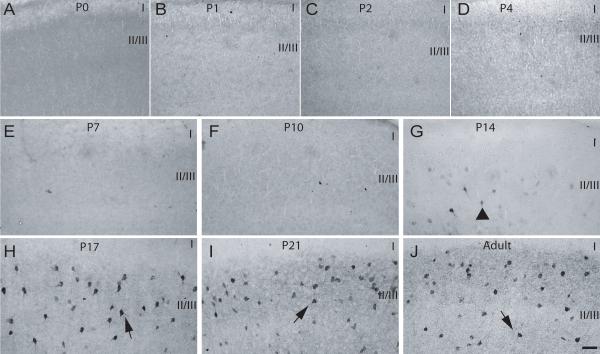
At these earlier developmental ages, CB-positive cells were found in all layers of the rostral somatosensory cortex (Fig 3A-D) and staining was intense and restricted to the cell soma. At P4, staining in proximal processes was now apparent in some cells (Fig. 3D). In a similar manner, CR-ir was observed in all layers of the rostral somatosensory cortex (Fig. 4A-D), and a small number of CR-positive cells exhibited staining in proximal process during this time period. CR-ir seemed to decline during these early stages (Fig 4A-C). In contrast, PV-ir was almost completely absent in the rostral somatosensory cortex (Fig 5A-D). Qualitatively, similar patterns of CaBP expression were found in the caudal extent of S1 (data not shown)
Fig. 3. Calbindin expression in the rostral S1 cortex during postnatal development.
P0-P21 and adult rat brains were processed for expression of CB (see Methods). (A) P0, (B) P1, (C) P2, (D) P4, (E) P7, (F) P10, (G) P14, (H) P17, (I) P21 and (J) Adult. Arrowhead – CB-positive cells with weakly stained soma and no process staining, arrows – CB-positive cell with densely stained soma and process, CC – corpus callosum, I-V - approximate location of layers; scale bar is 50 μm.
Fig. 4. Calretinin expression in the rostral S1 cortex during postnatal development.
P0-P21 and adult rat brains were processed for expression of CR (see Methods). (A) P0, (B) P1, (C) P2, (D) P4, (E) P7, (F) P10, (G) P14, (H) P17, (I) P21 and (J) Adult. Arrowhead – CR-positive cells with weakly stained soma and no neurite staining, arrows – CR-positive cell with densely stained soma and neurites, CC – corpus callosum, I-V - approximate location of layers, scale bar is 50 μm.
Fig. 5. Parvalbumin expression in the rostral S1 cortex during postnatal development.
P0-P21 and adult rat brains were processed for expression of PV (see Methods). (A) P0, (B) P1, (C) P2, (D) P4, (E) P7, (F) P10, (G) P14, (H) P17, (I) P21 and (J) Adult. Arrowhead – PV-positive cells with weakly stained soma and no neurite staining, arrows – PV-positive cell with densely stained soma and process, CC – corpus callosum, I-V - approximate location of layers, scale bar is 50 μm.
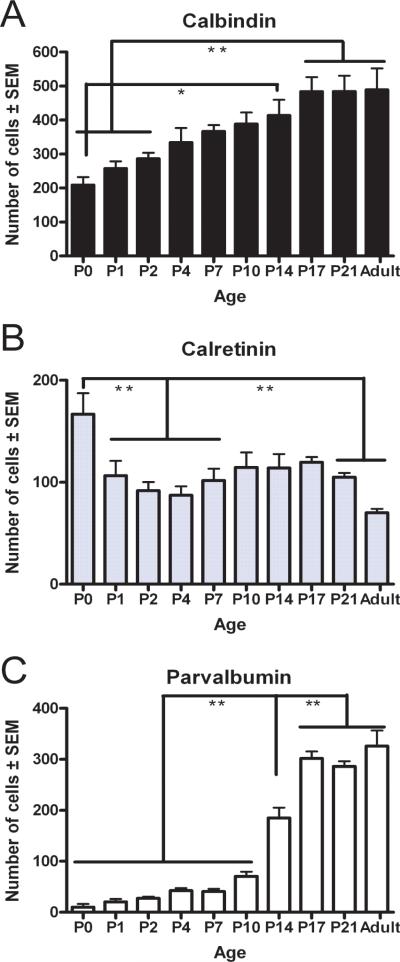
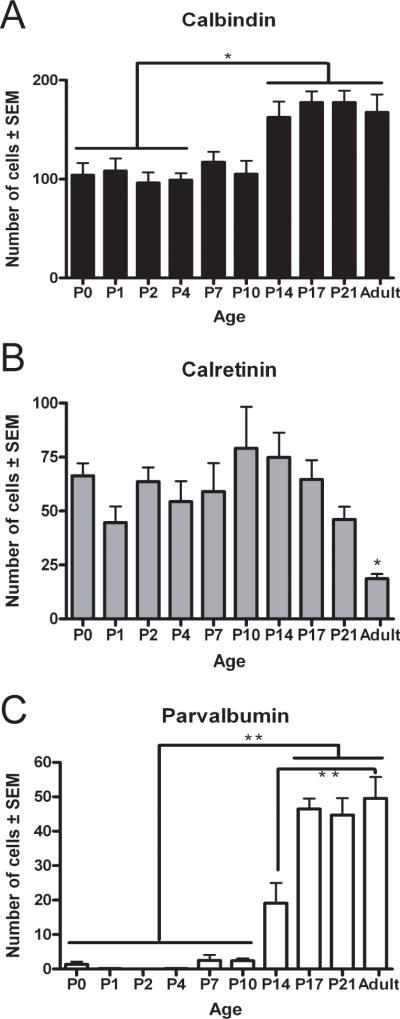
Our semi-quantitative analysis of data derived from both rostral and caudal S1 revealed initially modest numbers of CB-positive cells that increased from P0 to P4, modest numbers of CR-positive cells at P0 which then significantly declined in the following ages (p<0.05), and zero to very low levels of PV-positive cells across this age group (Fig. 6).
Fig. 6. CaBP numbers within the rat S1 cortex follows a developmental pattern.
Cells positive for each marker were counted and expressed as mean positive cells/section (± SEM; Methods). Cells positive for CB (A), CR (B) or PV (C). Statistical differences determined by ANOVA, using a Bonferroni post-test comparison of means (*p<0.05, **p<0.01, all other comparisons were not significant).
P7
At P7, CB-positive cells were still found widespread among all layers of the rostral somatosensory cortex, and the number were slightly increased, in part due to the appearance of a layer of lightly-stained CB-positive cells in layers II/III (Fig. 3E). In addition, CB-positive profiles located in the deeper layers began to display staining of proximal processes (Fig. 3E). CR-ir had now increased compared to that found at P4 and most CR-ir was restricted to the soma, with only a few cells (located in the upper layers) displaying staining in the proximal processes (Fig. 4E). PV-ir was still very low to absent in the rostral S1 (Fig. 5E). Immunohistochemical patterns for all three CaBPs in the caudal S1 were similar to that found in the corresponding rostral region (data not shown).
Cell count analysis revealed that the increased number of CaBP-positive cells found at P7 was not significant (p>0.05) when comparing to the previous developmental age group (Fig. 6).
P10
At this age, CB-positive cells were still distributed throughout all layers of the rostral S1, and the lightly CB-stained cells in layers II/III that had appeared at P7 were now more prominent (Fig. 3F). CB-positive profiles located in deeper layers exhibited dense staining of cell bodies and proximal processes (Fig. 3E). The CR-ir observed throughout S1 at P10 was similar to that of P7 animals, except for denser staining in cell somas and more cells displaying proximal staining of processes (Fig. 4F). PV staining, though more apparent at this age, was light, restricted to cell bodies and found in the lower layers of the S1 (Fig. 5F). Similarly, in the caudal S1, CB-ir was greatly increased in the superficial layers while PV appearance was observed in the lower layers, and staining of processes of CB and CR-positive cells was observed in the lower layers (data not shown).
Semi-quantitative analysis revealed a slight (although non-significant; p>0.05) increase in the number of cells positive for all three labels from that found at P7 (Fig. 6).
P14-Adult
The number of CB-positive cells in later developmental ages continued to increase, mostly due to an increase in the number of lightly stained CB-positive profiles located in layer II/III. In addition, CB-ir in the processes became more extensive for those cells located in the lower layers of S1 (Fig. 3G-J). From P14 to P21, the numbers of CR-positive neurons was relatively unchanged in the rostral subdivision of S1 (Fig. 4G-I). With increasing age, a larger number of CR-positive cells across all layers now displayed a densely stained soma and extensive immunoreactivity in their processes (Fig. 4G-I). In adult animals, CR-positive cells were decreased in number throughout all layers of S1 (Fig. 4J). For PV-ir at P14, positive cells were now found in the upper layers and the staining of cells in lower layers became darker with immunoreactivity of processes restricted to the proximal neurites (Fig. 5G). From P17 into adult, the number of PV-positive profiles was greatly increased and the staining of processes became more extensive, first in cells located on the lower layers, and finally in the cells of the upper layers, with the subsequent heavier staining of the surrounding neuropil (Fig. 5H-J). Cell counts performed in S1 revealed a significant increase in CB-positive cells from P0 to P14 (p<0.01) and a significant increase from P2 to P17-Adult (p<0.01) (Fig. 6A). The opposite trend was found for CR-positive cells in S1, which decreased in number from P17 to adulthood. The adult CR expression was significantly lower (p<0.01) than expression at the early developmental ages (Fig 6B). The increase in PV-positive cells was highly significant from the P0-P10 group to P14 (p<0.001) in S1 and continued to be significantly higher at P17, P21 and in adults (p<0.001) compared to all previous developmental ages (Fig. 6C). Only minor differences were found between the rostral and caudal divisions of S1 (data not shown) and the data were therefore combined.
Calcium Binding Proteins: Ctx II of M1/M2
P0-P4
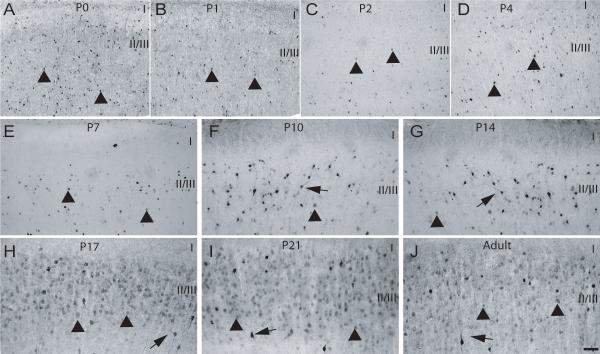
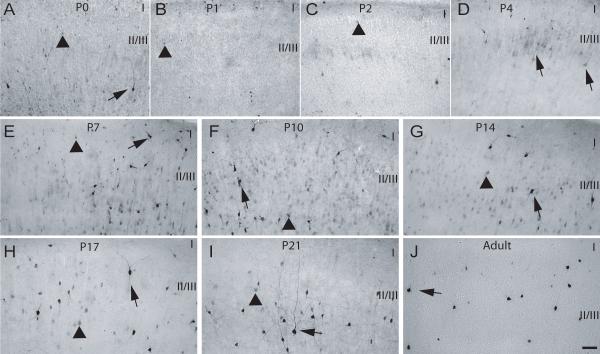
CB-ir, though moderately expressed was widely dispersed throughout layer II/III of the M1/M2 cortex from P0-P4. Labeling at these ages was restricted to cell bodies and some CB-positive cells were also found in layer I (Fig. 7A-D). CR-positive cells were also found throughout layer II/III and two distinct labeling patterns could be observed, deeper within layer II/III CR-positive cells were heavily labeled and displayed staining of the proximal apical process, while cells located more superficially within layer II/III displayed light labeling restricted to the soma (Fig. 8A-D). For PV-ir, staining was virtually absent from layer II/III in the early developmental ages (Fig. 9A-D). Cell counts performed at these ages revealed a relatively constant number of all three CaBPs investigated, and no significant differences (p>0.05) were found between the different ages (Fig. 10).
Fig. 7. Calbindin expression in layer II of M1/M2 cortex during postnatal development.
P0-P21 and adult rat brains were processed for expression of CB (see Methods). (A) P0, (B) P1, (C) P2, (D) P4, (E) P7, (F) P10, (G) P14, (H) P17, (I) P21 and (J) Adult. Arrowhead – CB-positive cells with weakly stained soma and no neurite staining, arrows – CB-positive cell with densely stained soma and process, CC – corpus callosum, I-V - approximate location of layers, scale bar is 50 μm.
Fig. 8. Calretinin expression in layer II of M1/M2 cortex during postnatal development.
P0-P21 and adult rat brains were processed for expression of CR (see Methods). (A) P0, (B) P1, (C) P2, (D) P4, (E) P7, (F) P10, (G) P14, (H) P17, (I) P21 and (J) Adult. Arrowhead – CR-positive cells with weakly stained soma and no neurite staining, arrows – CR-positive cell with densely stained soma and process, CC – corpus callosum, I-V - approximate location of layers, scale bar is 50 μm.
Fig. 9. Parvalbumin expression in layer II of M1/M2 cortex during postnatal development.
P0-P21 and adult rat brains were processed for expression of PV (see Methods). (A) P0, (B) P1, (C) P2, (D) P4, (E) P7, (F) P10, (G) P14, (H) P17, (I) P21 and (J) Adult. Arrowhead – PV-positive cells with weakly stained soma and no neurite staining, arrows – PV-positive cell with densely stained soma and process, CC – corpus callosum, I-V - approximate location of layers, scale bar is 50 μm.
Fig. 10. CaBP numbers within layer II of M1/M2 cortex follows a developmental pattern.
Cells positive for each marker were counted and expressed as mean positive cells/section (± SEM; Methods). Cells positive for CB (A), CR (B) or PV (C). Statistical differences determined by ANOVA, using a Bonferroni post-test comparison of means (*p<0.05, **p<0.01, all other comparisons were not significant).
P7
At P7, the distribution of CB-positive cells was now more restricted within layer II/III, with labeled cell bodies observed in close proximity to each other. CB-ir was still restricted to the cell bodies and both lightly and densely-labeled cells were abundant (Fig. 7E). The distribution and labeling types of CR-immunoreactive cells at P7 was similar to that found at previous ages, with the exception that some heavily CR-labeled cells were also observed in layer I (Fig. 8E). Still at this age, PV-ir was not apparent in layer II/III of M1/M2 (Fig. 9E). Cell counts performed showed that the number of CB and CR positive cells was similar to the previous ages and no significant differences (p>0.05) were found (Fig. 10A and B). Although a slight increase in the number of PV-positive profiles was recorded at P7, no significant difference was found when comparing this number to the counts obtained for previous age groups.
P10
The labeling observed for CB-positive cells at P10 was denser and at this age proximal process labeling was now evident, while the distribution and abundance of CB-labeled cells was similar to that observed at previous ages (Fig. 7F). CR-positive cells were found to be more abundant due to an increase in lightly labeled cells throughout the extent of layer II/III. Heavily labeled cells displaying proximal process staining were still found in layer I as reported for P7 (Fig. 8F). PV-ir was still absent from layer II/III at P10 (Fig. 9F). Analysis of cell numbers revealed that CB-positive cell numbers were very similar (p>0.05) to those reported at the previous ages as were PV-positive cells (p>0.05) (Fig. 10A and C). An increase in the number of CR-positive cells was noted at P10 although the analysis of variance revealed no significant differences (p>0.05) between this and the previous ages (Fig. 14B).
P14-Adult
During these later developmental ages an overall increase in CB-positive cells was observed, which could be mostly accounted for by elevation in numbers of lightly labeled cells in layer II/III. Although, during this age period , a decrease in the number of heavily-labeled CB-positive profiles was observed, the remaining dark CB-immunoreactive cells displayed complex staining of processes (Fig 7G-J). In contrast to the increase in CB-positive cells, a steady decrease in CR- positive cells was observed from P14 through to adulthood. This decrease was noted mostly for lightly-stained cells, while the densely-stained neurons displayed heavy and more extensive staining of processes (Fig 8G-J). PV-positive cells were first observed at P14 as lightly-labeled cells with staining restricted to cell somas (Fig. 9G). PV-ir increased dramatically in the later developmental ages and was high in the adult rat brain. In addition, neuropil and process staining became evident at P17 and heavy from P21 into adults (Fig. 9H-J). Semi-quantitative analysis of cell numbers revealed a significant (p<0.05) increase in CB-positive cells for the period from P14-adult when compared to P0-P4 (Fig. 10A), and a highly significant (p<0.001) increase in the number of PV-positive cells for the period between P17-adult when compared to both P0-P10 and P14 (Fig. 10C). A decreasing trend in the number of CR-positive cells was recorded from P14 into adulthood, but this decrease was only significant (p<0.01) when the number recorded for adult rats was compared to the previous ages (Fig. 10B).
Summary
MK801 blockade of the NMDA receptor led to increased expression of the proapoptotic marker caspase-3 in the three brain regions investigated: the rostral S1, the caudal S1 and layer II/III of M1/M2. Activation of caspase-3 was highest at P7, decreased at P14 and absent at P21. At P7, expression of the CaBPs, in particular CB and PV was low. P14 appeared to represent a pivotal age as activated caspase-3 was demonstrably lower than at P7 and CaBP expression, particularly PV, was much higher. Additionally, CB expression was also substantially increased after P14 due to the appearance of a layer of lightly-labeled CB-positive cells in all three regions studied. At P21, when sensitivity to MK801 is absent, expression of CB and especially PV remained high, consistent with previously published work (Lema Tomé et al., 2006a; Lema Tomé et al., 2007; Turner et al., 2007a) suggesting that developmental regulation of CaBP expression may underlie susceptibility of the early neonatal brain to MK801 and other drugs that alter calcium homeostasis.
Discussion
We and others have shown that NMDAR blockade promotes widespread apoptosis in P7 but not in P21 animals. To address potential mechanisms we hypothesized that an inability to buffer changes in [Ca2+]i following NMDAR blockade leads to cell death (Turner et al., 2007a; Turner et al., 2007b; Turner et al., 2002). To test this hypothesis we examined expression of the proapoptotic marker activated caspase-3 as well as CB, CR and PV in P7 animals following MK801 exposure. We found that cells expressing activated caspase-3 did not display any of the 3 CaBPs (Lema Tomé et al., 2006a). To explore this inverse relationship further, we studied expression of activated caspase-3 in the S1 and in Ctx II of M1/M2 following MK801 treatment at P7, P14 and P21. Expression of the pro-apoptotic marker was found to peak at P7, diminish at P14 and was absent at P21. These results agree with reports in other cortical areas (Ikonomidou et al., 1999; Lema Tomé et al., 2007; Turner et al., 2007b).
MK801 treatment of P7 animals led to increased caspase-3 activation in the deeper layers (layer IV-VI) of S1 along its rostro-caudal extent and also in layer II/III of both S1 and M1/M2. CaBP expression at P7 was low or absent, especially in the upper layers. This was particularly true in the case of PV, expression of which was not apparent until P10. At the later ages, from P14-P17, expression of CR was increased compared to the previous ages and an increase in the number of CB and PV-positive cells was noted, in particular CB was greatly increased in the upper layers II/III of M1/M2 cortex and also in S1 while, more importantly, PV-expression was now widespread throughout all layers of both cortical regions. In addition, comparison of sections stained for activated caspase-3 demonstrated that a significant decrease in caspase-3 activation following MK801 treatment was observed at P14 compared to P7. We have previously shown that, in P7 animals, caspase-3 activation following NMDAR blockade is not observed in cells expressing CB, CR or PV (Lema Tomé et al., 2006a; Lema Tomé et al., 2007). Moreover, CB and PV expression was greatly increased by P21, an age when there was no evidence of MK801-induced activated caspase-3 expression, and no further significant changes were observed for these proteins in the adult animals. Thus, it is possible that CB and, especially, PV play an important protective against agents that alter intracellular calcium homeostasis at the developmental level (Lema Tomé et al., 2007).
The age-related changes in calcium buffering capacity reported by our lab and others (Kortekaas & Wadman, 1997; Turner et al., 2007b) are concordant with neuronal maturation and CaBP expression, specifically CB and PV, during the postnatal period. CB expression is first observed at embryonic day 14 (E14) in post-mitotic neurons that are migrating within the cortex (Alcantara et al., 1993; Enderlin, Norman, & Celio, 1987). We report here that CB-ir was restricted to cell bodies during the first developmental ages, but starting at P4, CB-positive cells located in the deeper layers of the cortex (Alcantara et al., 1993) exhibited staining of proximal process which may be indicative of formation of synaptic contacts correlated with CNS maturation (Celio, 1990). Our results indicate that, at earlier ages, restricted cell soma CR expression may be associated with immature neurons, and increased immunoreactivity of processes at later ages may be an indicator of neuronal maturation. Previous reports support these conclusions by indicating that CR is first observed at E11 in the rat cortex (Schierle, Gander, D'Orlando, Ceilo, & Vogt Weisenhorn, 1997; Weisenhorn, Prieto, & Celio, 1994) and E14 in the dorsal thalamus (Frassoni, Arcelli, Selvaggio, & Spreafico, 1998). In addition, CR expression may be transient in certain regions such as the hippocampus, marking only newly generated, immature cells (Brandt, Jessberger, Steiner, Kronenberg, Reuter, Bick-Sander, von der Behrens, & Kempermann, 2003). In this study, we report that a decrease of cell bodies immunoreactive for CR was observed throughout development which may be a consequence of normal brain maturation, and at the same time we observed an increase in neuropil CR-staining, indicating that for those neurons still expressing CR, there was elevated levels of this CaBP in neuronal processes with increasing age. Finally, PV expression was not observed prior to P10 in the S1 and in Ctx. II of M1/M2 confirming previous reports of its absence prior to P7 in other cortical areas (Alcantara et al., 1993; de Lecea et al., 1995; Lema Tomé et al., 2007; Sanchez, Frassoni, Alvarez-Bolado, Spreafico, & Fairen, 1992). In a manner comparable to that of CB, PV-ir was initially restricted to cell bodies and at later developmental ages, PV-ir was also observed in processes, as seen in other brain regions (Lema Tomé et al., 2007). Therefore, the developmental progression of CaBP expression seems to be highly correlated with normal neuronal maturation in the S1 and M1/M2.
MK801 blockade of NMDARs has been linked to decreased [Ca2+]i (Turner et al., 2007b; Turner et al., 2002) which has been shown to be a potential mechanism of injury in several in vitro paradigms (Koh & Cotman, 1992; Moran, Itoh, Reddy, Chen, Alnemri, & Pleasure, 1999; Moulder, Fu, Melbostad, Cormier, Isenberg, Zorumski, & Mennerick, 2002; Takadera & Ohyashiki, 1998). Further, studies by our lab have demonstrated that loss of intracellular calcium using the intracellular calcium chelator BAPTA-AM, is directly correlated with activated caspase-3 expression (Turner et al., 2007a), and that maintenance of intracellular calcium homeostasis measured with the non-ratiometric dye Calcium Green-1, was positively correlated with CaBP expression, and this correlation was most significant in the case of PV (Turner et al., 2007a). Using this in vivo model, we have also demonstrated that expression of the pro-apoptotic marker is generally not found in those cells expressing CaBPs (Lema Tomé et al., 2006a) and that in regions such as the cingulate and the retrosplenial cortex, sensitivity to MK801 is lost at an age when PV expression is markedly increased (Lema Tomé et al., 2007).
Expression of CaBPs, particularly PV, may represent a protective mechanism for a cell facing dysregulation of calcium homeostasis. Using a slice culture model, we have demonstrated that regions of the P7 rat brain that are more susceptible to MK801-mediated injury have diminished calcium buffering capacity (Turner et al., 2007a). In contrast, following increased [Ca2+]i, a neuron may survive the insult if it expresses CaBPs (Burke & Baimbridge, 1993; Freund, Ylinen, Miettinen, Pitkanen, Lahtinen, Baimbridge, & Riekkinen, 1992; Lukas & Jones, 1994; Mattson, Rychlik, Chu, & Christakos, 1991; Prendergast, Harris, Mayer, Holley, Hauser, & Littleton, 2001). Therefore injury mediated by deviations from physiological levels of [Ca2+]i may be prevented by expression of CaBPs that can reversibly bind Ca2+, supporting the Calcium Set Point Hypothesis (Johnson et al., 1992; Zipfel, Babcock, Lee, & Choi, 2000).
Brain injury during the developmental period may lead to profound alterations of brain structure and function as well as development of several psychological disorders including attention deficit hyperactivity disorder (ADHD), cerebral palsy and schizophrenia among others. Several models of neonatal injury have reported alterations in CaBPs. Increased CR-ir and a reduction of CB-positive cells have been reported following ethanol exposure in the prenatal and neonatal periods, which model Fetal Alcohol Syndrome (FAS) (Granato, 2006). The flathead mutation, which models cortical dysplasias, leads to selective loss of gabaergic interneurons positive for CaBPs in the somatosensory and primary motor cortex in a layer-specific manner, so that the CR phenotype is preserved in the upper layers of the S1 while CB and PV-positive cells are lost (Sarkisian, Frenkel, Li, Oborski, & LoTurco, 2001). Additionally, in the SOD mutation which models amyotrophic lateral sclerosis (ALS), a reduction in CB and PV-ir is observed in motor neurons (Sasaki, Warita, Komori, Murakami, Abe, & Iwata, 2006). Finally, in experimental models of epilepsy, following several episodes induced by electroconvulsive shock, a reduction in CB and PV-ir has been reported in the hippocampal formation (Kim, Kwak, Kim, Won, Kwon, Choi, & Kang, 2006). In addition, alterations in CaBP expression have been reported in several neurological disorders, including multiple system sclerosis (MSA) (Wullner, Weller, Kornhuber, Bornemann, Schulz, Riederer, & Klockgether, 2000), Alzheimer's disease (AD) (Hof, Cox, Young, Celio, Rogers, & Morrison, 1991; Hof & Morrison, 1991), and schizophrenia (Beasley, Zhang, Patten, & Reynolds, 2002; Benes, McSparren, Bird, SanGiovanni, & Vincent, 1991; Lewis & Moghaddam, 2006; Reynolds, Abdul-Monim, Neill, & Zhang, 2004). Some of the anesthetics and anticonvulsants used in pediatric medicine include NMDAR antagonists, which may lead to alterations of intracellular [Ca2+]i homeostasis, therefore understanding the roles of CaBPs and their expression may be critical because these proteins may represent possible therapeutic targets in the prevention of infant brain injury.
Acknowledgments
These studies were supported by a Wake Forest University Faculty Development fund and NIH RO1 NS051632 to CPT. Author contributions were as follows: immunohistochemistry, digital imaging and cell counts (all authors); data analyses and manuscript preparation (CLT, CPT). There are no conflicts of interest.
Abbreviations
- BSA
bovine serum albumin
- CaBP
calcium binding protein
- CB
calbindin
- Cg2
cingulate cortex
- CR
calretinin
- IHC
immunohistochemistry
- M1/M2
motor/premotor areas
- NMDAR
N-methyl-D-aspartate receptor
- PBS
phosphate-buffered saline
- PFA
paraformaldehyde
- PV
parvalbumin
- S1
somatosensory cortex
References
- Alcantara S, Ferrer I, Soriano E. Postnatal development of parvalbumin and calbindin D28K immunoreactivities in the cerebral cortex of the rat. Anat Embryol (Berl) 1993;188(1):63–73. doi: 10.1007/BF00191452. [DOI] [PubMed] [Google Scholar]
- Alcantara S, Soriano E, Ferrer I. Thalamic and basal forebrain afferents modulate the development of parvalbumin and calbindin D28k immunoreactivity in the barrel cortex of the rat. Eur J Neurosci. 1996;8(7):1522–1534. doi: 10.1111/j.1460-9568.1996.tb01615.x. [DOI] [PubMed] [Google Scholar]
- Baimbridge KG, Celio MR, Rogers JH. Calcium-binding proteins in the nervous system. Trends Neurosci. 1992;15(8):303–308. doi: 10.1016/0166-2236(92)90081-i. [DOI] [PubMed] [Google Scholar]
- Beasley CL, Zhang ZJ, Patten I, Reynolds GP. Selective deficits in prefrontal cortical GABAergic neurons in schizophrenia defined by the presence of calcium-binding proteins. Biol Psychiatry. 2002;52(7):708–715. doi: 10.1016/s0006-3223(02)01360-4. [DOI] [PubMed] [Google Scholar]
- Benes FM, McSparren J, Bird ED, SanGiovanni JP, Vincent SL. Deficits in small interneurons in prefrontal and cingulate cortices of schizophrenic and schizoaffective patients. Arch Gen Psychiatry. 1991;48(11):996–1001. doi: 10.1001/archpsyc.1991.01810350036005. [DOI] [PubMed] [Google Scholar]
- Berridge MJ, Lipp P, Bootman MD. The versatility and universality of calcium signalling. Nat Rev Mol Cell Biol. 2000;1(1):11–21. doi: 10.1038/35036035. [DOI] [PubMed] [Google Scholar]
- Brandt MD, Jessberger S, Steiner B, Kronenberg G, Reuter K, Bick-Sander A, et al. Transient calretinin expression defines early postmitotic step of neuronal differentiation in adult hippocampal neurogenesis of mice. Mol Cell Neurosci. 2003;24(3):603–613. doi: 10.1016/s1044-7431(03)00207-0. [DOI] [PubMed] [Google Scholar]
- Burke RE, Baimbridge KG. Relative loss of the striatal striosome compartment, defined by calbindin-D28k immunostaining, following developmental hypoxic-ischemic injury. Neuroscience. 1993;56(2):305–315. doi: 10.1016/0306-4522(93)90333-b. [DOI] [PubMed] [Google Scholar]
- Carafoli E. Calcium signaling: a tale for all seasons. Proc Natl Acad Sci U S A. 2002;99(3):1115–1122. doi: 10.1073/pnas.032427999. [DOI] [PMC free article] [PubMed] [Google Scholar]
- Celio MR. Calbindin D-28k and parvalbumin in the rat nervous system. Neuroscience. 1990;35(2):375–475. doi: 10.1016/0306-4522(90)90091-h. [DOI] [PubMed] [Google Scholar]
- Conde F, Lund JS, Jacobowitz DM, Baimbridge KG, Lewis DA. Local circuit neurons immunoreactive for calretinin, calbindin D-28k or parvalbumin in monkey prefrontal cortex: distribution and morphology. J Comp Neurol. 1994;341(1):95–116. doi: 10.1002/cne.903410109. [DOI] [PubMed] [Google Scholar]
- de Lecea L, del Rio JA, Soriano E. Developmental expression of parvalbumin mRNA in the cerebral cortex and hippocampus of the rat. Brain Res Mol Brain Res. 1995;32(1):1–13. doi: 10.1016/0169-328x(95)00056-x. [DOI] [PubMed] [Google Scholar]
- Enderlin S, Norman AW, Celio MR. Ontogeny of the calcium binding protein calbindin D-28k in the rat nervous system. Anat Embryol (Berl) 1987;177(1):15–28. doi: 10.1007/BF00325286. [DOI] [PubMed] [Google Scholar]
- Evenas J, Malmendal A, Forsen S. Calcium. Curr Opin Chem Biol. 1998;2(2):293–302. doi: 10.1016/s1367-5931(98)80072-0. [DOI] [PubMed] [Google Scholar]
- Frassoni C, Arcelli P, Selvaggio M, Spreafico R. Calretinin immunoreactivity in the developing thalamus of the rat: a marker of early generated thalamic cells. Neuroscience. 1998;83(4):1203–1214. doi: 10.1016/s0306-4522(97)00443-0. [DOI] [PubMed] [Google Scholar]
- Freund TF, Ylinen A, Miettinen R, Pitkanen A, Lahtinen H, Baimbridge KG, et al. Pattern of neuronal death in the rat hippocampus after status epilepticus. Relationship to calcium binding protein content and ischemic vulnerability. Brain Res Bull. 1992;28(1):27–38. doi: 10.1016/0361-9230(92)90227-o. [DOI] [PubMed] [Google Scholar]
- Granato A. Altered organization of cortical interneurons in rats exposed to ethanol during neonatal life. Brain Res. 2006;1069(1):23–30. doi: 10.1016/j.brainres.2005.11.024. [DOI] [PubMed] [Google Scholar]
- Heizmann CW. Calcium-binding proteins: basic concepts and clinical implications. Gen Physiol Biophys. 1992;11(5):411–425. [PubMed] [Google Scholar]
- Hof PR, Cox K, Young WG, Celio MR, Rogers J, Morrison JH. Parvalbumin-immunoreactive neurons in the neocortex are resistant to degeneration in Alzheimer's disease. J Neuropathol Exp Neurol. 1991;50(4):451–462. doi: 10.1097/00005072-199107000-00006. [DOI] [PubMed] [Google Scholar]
- Hof PR, Morrison JH. Neocortical neuronal subpopulations labeled by a monoclonal antibody to calbindin exhibit differential vulnerability in Alzheimer's disease. Exp Neurol. 1991;111(3):293–301. doi: 10.1016/0014-4886(91)90096-u. [DOI] [PubMed] [Google Scholar]
- Ikonomidou C, Bosch F, Miksa M, Bittigau P, Vockler J, Dikranian K, et al. Blockade of NMDA receptors and apoptotic neurodegeneration in the developing brain. Science. 1999;283(5398):70–74. doi: 10.1126/science.283.5398.70. [DOI] [PubMed] [Google Scholar]
- Johnson EM, Jr., Koike T, Franklin J. A “calcium set-point hypothesis” of neuronal dependence on neurotrophic factor. Exp Neurol. 1992;115(1):163–166. doi: 10.1016/0014-4886(92)90242-i. [DOI] [PubMed] [Google Scholar]
- Kim JE, Kwak SE, Kim DS, Won MH, Kwon OS, Choi SY, et al. Reduced calcium binding protein immunoreactivity induced by electroconvulsive shock indicates neuronal hyperactivity, not neuronal death or deactivation. Neuroscience. 2006;137(1):317–326. doi: 10.1016/j.neuroscience.2005.08.052. [DOI] [PubMed] [Google Scholar]
- Koh JY, Cotman CW. Programmed cell death: its possible contribution to neurotoxicity mediated by calcium channel antagonists. Brain Res. 1992;587(2):233–240. doi: 10.1016/0006-8993(92)91002-v. [DOI] [PubMed] [Google Scholar]
- Kortekaas P, Wadman WJ. Development of HVA and LVA calcium currents in pyramidal CA1 neurons in the hippocampus of the rat. Brain Res Dev Brain Res. 1997;101(1−2):139–147. doi: 10.1016/s0165-3806(97)00059-x. [DOI] [PubMed] [Google Scholar]
- Lema Tomé CM, Bauer C, Nottingham C, Smith C, Blackstone K, Brown L, et al. MK801-induced caspase-3 in the postnatal brain: Inverse relationship with calcium binding proteins. Neuroscience. 2006a;141(3):1351–1363. doi: 10.1016/j.neuroscience.2006.05.019. [DOI] [PubMed] [Google Scholar]
- Lema Tomé CM, Miller R, Bauer C, Nottingham C, Smith C, Blackstone K, et al. Decline in age-dependent, MK801-induced injury coincides with developmental switch in parvalbumin expression: Cingulate and retrosplenial cortex. Dev Psychobiol. 2007;49(6):606–618. doi: 10.1002/dev.20246. [DOI] [PubMed] [Google Scholar]
- Lema Tomé CM, Nottingham CU, Smith CM, Beauchamp AS, Leung PW, Turner CP. Neonatal exposure to MK801 induces structural reorganization of the central nervous system. Neuroreport. 2006b;17(8):779–783. doi: 10.1097/01.wnr.0000220133.32091.d6. [DOI] [PubMed] [Google Scholar]
- Lewis DA, Moghaddam B. Cognitive dysfunction in schizophrenia: convergence of gamma-aminobutyric acid and glutamate alterations. Arch Neurol. 2006;63(10):1372–1376. doi: 10.1001/archneur.63.10.1372. [DOI] [PubMed] [Google Scholar]
- Lukas W, Jones KA. Cortical neurons containing calretinin are selectively resistant to calcium overload and excitotoxicity in vitro. Neuroscience. 1994;61(2):307–316. doi: 10.1016/0306-4522(94)90233-x. [DOI] [PubMed] [Google Scholar]
- Mattson MP, Rychlik B, Chu C, Christakos S. Evidence for calcium-reducing and excito-protective roles for the calcium-binding protein calbindin-D28k in cultured hippocampal neurons. Neuron. 1991;6(1):41–51. doi: 10.1016/0896-6273(91)90120-o. [DOI] [PubMed] [Google Scholar]
- Miller RJ. Calcium signalling in neurons. Trends Neurosci. 1988;11(10):415–419. doi: 10.1016/0166-2236(88)90191-9. [DOI] [PubMed] [Google Scholar]
- Moran J, Itoh T, Reddy UR, Chen M, Alnemri ES, Pleasure D. Caspase-3 expression by cerebellar granule neurons is regulated by calcium and cyclic AMP. J Neurochem. 1999;73(2):568–577. doi: 10.1046/j.1471-4159.1999.0730568.x. [DOI] [PubMed] [Google Scholar]
- Moulder KL, Fu T, Melbostad H, Cormier RJ, Isenberg KE, Zorumski CF, et al. Ethanol-induced death of postnatal hippocampal neurons. Neurobiol Dis. 2002;10(3):396–409. doi: 10.1006/nbdi.2002.0523. [DOI] [PubMed] [Google Scholar]
- Paxinos G. The Rat Nervous System. Third ed. Elsevier; San Diego: 2004. [Google Scholar]
- Paxinos G, Watson A. The rat brain in stereotaxic coordinates. Fourth ed. Academic Press; San Diego: 1998. [Google Scholar]
- Prendergast MA, Harris BR, Mayer S, Holley RC, Hauser KF, Littleton JM. Chronic nicotine exposure reduces N-methyl-D-aspartate receptor-mediated damage in the hippocampus without altering calcium accumulation or extrusion: evidence of calbindin-D28K overexpression. Neuroscience. 2001;102(1):75–85. doi: 10.1016/s0306-4522(00)00450-4. [DOI] [PubMed] [Google Scholar]
- Reynolds GP, Abdul-Monim Z, Neill JC, Zhang ZJ. Calcium binding protein markers of GABA deficits in schizophrenia--postmortem studies and animal models. Neurotox Res. 2004;6(1):57–61. doi: 10.1007/BF03033297. [DOI] [PubMed] [Google Scholar]
- Sanchez MP, Frassoni C, Alvarez-Bolado G, Spreafico R, Fairen A. Distribution of calbindin and parvalbumin in the developing somatosensory cortex and its primordium in the rat: an immunocytochemical study. J Neurocytol. 1992;21(10):717–736. doi: 10.1007/BF01181587. [DOI] [PubMed] [Google Scholar]
- Sarkisian MR, Frenkel M, Li W, Oborski JA, LoTurco JJ. Altered interneuron development in the cerebral cortex of the flathead mutant. Cereb Cortex. 2001;11(8):734–743. doi: 10.1093/cercor/11.8.734. [DOI] [PubMed] [Google Scholar]
- Sasaki S, Warita H, Komori T, Murakami T, Abe K, Iwata M. Parvalbumin and calbindin D-28k immunoreactivity in transgenic mice with a G93A mutant SOD1 gene. Brain Res. 2006;1083(1):196–203. doi: 10.1016/j.brainres.2006.01.129. [DOI] [PubMed] [Google Scholar]
- Schierle GS, Gander JC, D'Orlando C, Ceilo MR, Vogt Weisenhorn DM. Calretinin-immunoreactivity during postnatal development of the rat isocortex: a qualitative and quantitative study. Cereb Cortex. 1997;7(2):130–142. doi: 10.1093/cercor/7.2.130. [DOI] [PubMed] [Google Scholar]
- Schwaller B, Meyer M, Schiffmann S. ‘New’ functions for ‘old’ proteins: the role of the calcium-binding proteins calbindin D-28k, calretinin and parvalbumin, in cerebellar physiology. Studies with knockout mice. Cerebellum. 2002;1(4):241–258. doi: 10.1080/147342202320883551. [DOI] [PubMed] [Google Scholar]
- Takadera T, Matsuda I, Ohyashiki T. Apoptotic cell death and caspase-3 activation induced by N-methyl-D-aspartate receptor antagonists and their prevention by insulin-like growth factor I. J Neurochem. 1999;73(2):548–556. doi: 10.1046/j.1471-4159.1999.0730548.x. [DOI] [PubMed] [Google Scholar]
- Takadera T, Ohyashiki T. Apoptotic cell death and CPP32-like activation induced by thapsigargin and their prevention by nerve growth factor in PC12 cells. Biochim Biophys Acta. 1998;1401(1):63–71. doi: 10.1016/s0167-4889(97)00116-x. [DOI] [PubMed] [Google Scholar]
- Turner CP, Connell J, Blackstone K, Ringler SL. Loss of calcium and increased apoptosis within the same neuron. Brain Res. 2007a;1128(1):50–60. doi: 10.1016/j.brainres.2006.10.039. [DOI] [PMC free article] [PubMed] [Google Scholar]
- Turner CP, Miller R, Smith C, Brown L, Blackstone K, Dunham SR, et al. Widespread neonatal brain damage following calcium channel blockade. Dev Neurosci. 2007b;29(3):213–231. doi: 10.1159/000095221. [DOI] [PubMed] [Google Scholar]
- Turner CP, Pulciani D, Rivkees SA. Reduction in intracellular calcium levels induces injury in developing neurons. Exp Neurol. 2002;178(1):21–32. doi: 10.1006/exnr.2002.8027. [DOI] [PubMed] [Google Scholar]
- van Brederode JF, Helliesen MK, Hendrickson AE. Distribution of the calcium-binding proteins parvalbumin and calbindin-D28k in the sensorimotor cortex of the rat. Neuroscience. 1991;44(1):157–171. doi: 10.1016/0306-4522(91)90258-p. [DOI] [PubMed] [Google Scholar]
- Weisenhorn DM, Prieto EW, Celio MR. Localization of calretinin in cells of layer I (Cajal-Retzius cells) of the developing cortex of the rat. Brain Res Dev Brain Res. 1994;82(1−2):293–297. doi: 10.1016/0165-3806(94)90171-6. [DOI] [PubMed] [Google Scholar]
- Wullner U, Weller M, Kornhuber J, Bornemann A, Schulz JB, Riederer P, et al. Altered expression of calcium- and apoptosis-regulating proteins in multiple system atrophy Purkinje cells. Mov Disord. 2000;15(2):269–275. doi: 10.1002/1531-8257(200003)15:2<269::aid-mds1009>3.0.co;2-0. [DOI] [PubMed] [Google Scholar]
- Zipfel GJ, Babcock DJ, Lee JM, Choi DW. Neuronal apoptosis after CNS injury: the roles of glutamate and calcium. J Neurotrauma. 2000;17(10):857–869. doi: 10.1089/neu.2000.17.857. [DOI] [PubMed] [Google Scholar]


