

Abstract
We demonstrate the use of a hybrid fluorescent protein semiconductor quantum dot (QD) sensor capable of specifically monitoring caspase 3 proteolytic activity. mCherry monomeric red fluorescent protein engineered to express an N-terminal caspase 3 cleavage site was ratiometrically self-assembled to the surface of QDs using metal-affinity coordination. The proximity of the fluorescent protein to the QD allows it to function as an efficient fluorescent resonance energy transfer acceptor. Addition of caspase 3 enzyme to the QD-mCherry conjugates specifically cleaved the engineered mCherry linker sequence altering energy transfer with the QD and allowing quantitative monitoring of proteolytic activity. Inherent advantages of this sensing approach include bacterial expression of the protease substrate in a fluorescently-appended form, facile self-assembly to QDs, and the ability to recombinantly modify the substrate to target other proteases of interest.
The creation of hybrid biological-inorganic nanomaterials capable of enhanced sensing, catalysis, or actuation is a major goal of nanotechnology1. Sensors consisting of nanoparticle-bioconjugates in particular are predicted to find utility in medicine, bioresearch, security, and defense applications. Amongst the challenges in creating these materials are efficiently interfacing the biological elements (proteins, peptides, DNA) with the nanoparticle surface. Chemistries for accomplishing this should be facile, allow both participants to function in concert, and should be amenable to creating a wide variety of other functional nanomaterials1-3. We have shown that polyhistidine appended proteins, peptides, and even DNA can self-assemble to CdSe-ZnS core-shell semiconductor quantum dots (QDs) via metal-affinity coordination2. This rapid, high-affinity interaction allows control over the ratio of attached biological moiety per QD and can even allow for control over protein orientation2. Bioconjugation using this strategy allows utilization of the QD as both a central nanoscaffold and exciton donor for self-assembling a variety of QD-protein, peptidyl, and DNA nanoconjugates capable of sensing nutrients, explosives, DNA, and enzymatic activity via fluorescence resonance energy transfer (FRET)1-3.
Use of QDs as FRET donors provides inherent photophysical benefits cumulatively unavailable to organic dyes including: the ability to optimize spectral overlap by size-tuning the QD photoluminescence (PL), control over intra-assembly FRET by arraying multiple acceptors around the QD, reduced direct excitation of the acceptor and access to multiplex FRET configurations.2c These properties have led a growing number of groups to adopt QD-FRET as the signal transduction modality for sensors targeting pH changes, HIV-related peptides, nucleic acids, sugars, β-lactamase activity and antibiotics.2,3 Here, we demonstrate that the fluorescent protein mCherry modified to express a caspase 3 cleavage site can be ratiometrically self-assembled to QDs to create a sensitive and specific FRET-based protease sensor (Fig. 1A). Caspase 3 or apopain is an important downstream protease in apoptosis. Once activated by upstream initiator caspases, this cysteine protease specifically cleaves substrate proteins as part of the apoptotic cascade.4 Caspase 3 is of particular interest to cancer research as it is down-regulated in different types of tumors and decreased activity is a prognostic indicator of chemosensitivity in breast and ovarian tumors.5 Treatments targeting caspase 3 inhibitors are being sought to restore chemosensitivity and improve clinical outcomes.5 Clearly, sensitive detection of caspase 3 activity is important for monitoring and evaluating treatments and initial FRET-based protein sensors have been reported5c.
Figure 1.
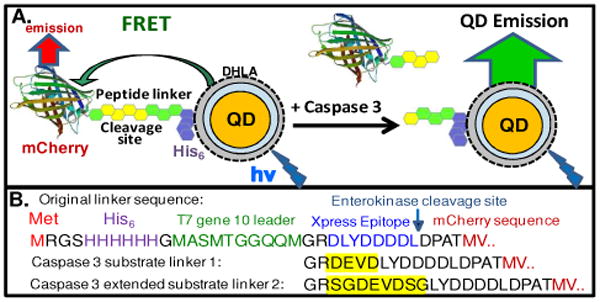
(A) Schematic of the QD-fluorescent protein sensor. mCherry with an N-terminal linker expressing the caspase 3 cleavage site and a His6 sequence were self-assembled to the surface of CdSe-ZnS DHLA-QDs resulting in FRET quenching of the QD and sensitized emission from the mCherry-acceptor (mCherry PDB structure 2h5q). Caspase 3 cleaves the linker reducing FRET efficiency. (B) Linker sequences. The original 35 residue N-terminal linker is shown with colors highlighting functionalities including the start methionine (Met), His6 NTA-purification/QD assembly sequence, several other functionalities, and the first residues of the mCherry protein. Caspase 3 cleavage sites insertions into the linker are shown in yellow.
The parent mCherry gene we utilized was encoded in the multicloning site of plasmid pRSetB (Invitrogen) and expressed a 35 residue linker upstream of the mCherry protein which included a His6 tag and a T7 transcript stabilizing sequence amongst other functional sequences, see Figure 1B. The linker was analyzed for native structure to evaluate caspase 3 steric accessibility when the His6 sequence is assembled onto the QD. A comparison of more than 25 crystallographic protein sequences in the Protein Data Bank (PDB, www.rcsb.org) containing this N-terminal linker found no structure for the 35 residues, strongly suggesting that the linker adopts a flexible conformation. A sequence requiring the least amount of modification near the enterokinase site was chosen for insertion of the cleavage sites. Stratagene's Quickchange site-directed mutagenesis kit was used to introduce the caspase 3 recognized cleavage sequence, DEVD (substrate 1), and an extended serine-glycine flanked sequence, SGDEVDSG (substrate 2), previously shown to increase activity in a fluorescent protein FRET sensor (Fig. 1B)6. DNA sequencing confirmed the plasmid insertions. Substrate plasmids along with the unmodified parent were transformed into E. coli Rosetta 2 (DE3) cells, expressed overnight, and mature mCherry was purified over Ni-NTA media and quantitated using chromophore absorbance (72,000 M-1cm-1 at 587 nm) as described7. 550 nm emitting dihydrolipoic acid-(DHLA) functionalized QDs were selected for assembly with mCherry due to favorable spectral overlap (Förster distance R0 = 4.9 nm)8. Agarose gel electrophoresis of the QD-mCherry conjugates confirmed ratiometeric self-assembly (data not shown). Fig. 2A shows spectra for 550 nm QDs self-assembled with increasing ratios of mCherry-substrate. Fig. 2B shows the normalized loss in QD PL vs. mCherry:QD ratio, n, together with the FRET efficiency E determined from QD PL loss. Data show a progressive loss in QD PL along with an increase in sensitized mCherry emission. An intra-assembly FRET efficiency of ∼50% was measured at a ratio of 6. Analysis of FRET using Eq. 1 derived for centro-symmetric QD-conjugates:2,8,9
Figure 2.

(A) Deconvoluted spectra from 550 nm QDs (quantum yield 0.2) self-assembled with an increasing ratio of mCherry substrate 1. Data are corrected for mCherry direct excitation. (B) Plots of normalized QD PL vs. mCherry ratio or valence n (red), FRET efficiency (blue), and efficiency corrected for heterogeneity using a Poisson distribution function (green).8
| (1) |
where n is the acceptor-to-QD ratio, R0 is the Förster distance and r is the QD-acceptor separation distance, yielded an average r of 5.6 nm for the unmodified parent mCherry. This value increased with cleavage site insertion to 6.5 nm for the longer substrate 2 sequence which indicates that inserting the additional residues into the linker slightly increases the separation distance without affecting the conjugate structure.
To extract kinetic data from changes in FRET efficiency, we utilize the ratios of mCherry to QD emissions as a calibration curve (Supporting Info.). Such ratiometric data are less sensitive to changes in reagent concentration and they allow us to: 1-select an mCherry:QD substrate valence for which a large change in FRET efficiency following enzymatic cleavage can be measured, and 2-transform the proteolysis-induced FRET recovery data into quantitative velocity values as demonstrated for similar QD-peptide conjugates9. Fig. 3 shows representative plots of velocity derived from monitoring changes in mCherry:QD ratios for increasing concentrations (range ∼200 nM to 2 μM QD) of both substrate conjugates exposed to 65 units (400 pM) of recombinant human caspase 3 enzyme (EC#3.4.22.56, activity ∼5.3×10⁶ units/mg). Initial velocities were measured in 30 min reactions at 30°C10. Corresponding Michaelis constants KM and maximal velocity Vmax were estimated using the Michaelis-Menten expression for excess substrate:9,10
Figure 3.

Proteolytic velocity vs. substrate concentration. Changes in FRET efficiency were converted to enzymatic velocity (nM mCherry cleaved/min) as described9. Representative data are shown for linker 1 (A) and extended linker 2 (B) substrates (3.5 and 1.5 mCherry/QD valence utilized, respectively) along with estimated KM and Vmax values (mean of 3 experiments). Data were fit with Eq 2.
| (2) |
where [S] is substrate, [P] is product (cleaved peptide), and t is time. Similar KM values were extracted from the velocity for mCherry substrates 1 and 2: 1.8 ± 0.4 and 3.0 ± 2.5 μM, respectively. These are slightly lower than the ∼11 μM reported for a similar peptidyl substrate.10 kcat values (Vmax/[Enz]) of 1.3 and 2 sec-1 for substrates 1 and 2 are comparable to the reported 2.4 sec-1, although turnover numbers (kcat/KM) of ∼7.2 and 6.7 × 10⁷ M-1sec-1 are slightly higher than the 2.2 × 10⁷ M-1sec-1 reported.10 However, a direct benefit of our assay is that we utilize 5-10 times less substrate and ∼3 orders of magnitude less enzyme than that format. Further, with our assemblies we were able to detect enzymatic activity for concentrations as low as 20 pM caspase 3 (∼3.3 units, data not shown). Assays carried out with mCherry lacking the DEVD sites showed no activity, confirming that cleavage is substrate specific.
Although qualitative (i.e. yes/no) QD-protease sensors have been reported11a,b, we demonstrate that QDs assembled with fluorescent proteins engineered as peptide substrates allow sensitive, specific quantitative monitoring of proteolysis. Our results showed that even though the substrate sequence was ‘sandwiched’ between the QD and mCherry in the conjugate structure, it was still accessible to the enzyme. Caspase 3 induced changes in FRET are comparable to those observed in fluorescent protein sensors5c. Our results build on and extend recent studies focusing on: understanding the interactions between QDs and fluorescent proteins via FRET interactions7, energy transfer in multi-chromophore QD-DNA-fluorescent protein assemblies,11c and endocytic delivery and intracellular imaging of QD-peptide-fluorescent protein conjugates.11d Advantages of this sensing approach include choice in pairing QD emission to a fluorescent protein acceptor, bacterial expression of a protease substrate in a fluorescent form, facile self-assembly to QDs, reduced use of enzyme/substrate, the possibility of in vivo utilization, and the ability to recombinantly modify substrates to target other proteases.
Supplementary Material
Acknowledgments
The authors acknowledge DTRA and NRL-NSI for support. K.B. acknowledges an ASEE fellowship. GB and AMD acknowledge the NIH NLBI (HL80711).
Footnotes
Supporting Information Available. Representative assay data and experimental procedures. This information is available free of charge via the Internet at http://pubs.acs.org/.
References
- 1.Katz E, Willner I. Ang Chem Int Ed. 2004;43:6042–6108. doi: 10.1002/anie.200400651. [DOI] [PubMed] [Google Scholar]
- 2.(a) Sapsford KE, Pons T, Medintz IL, Higashiya S, Brunel FM, Dawson PE, Mattoussi H. J Phys Chem C. 2007;111:11528–11538. [Google Scholar]; (b) Medintz IL, Berti L, Pons T, Grimes AF, English DS, Alessandrini A, Facci P, Mattoussi H. Nano Letters. 2007;7:1741–1748. doi: 10.1021/nl070782v. [DOI] [PubMed] [Google Scholar]; (c) Medintz IL, Mattoussi H. Phys Chem Chem Phys. 2009;11:17–45. doi: 10.1039/b813919a. [DOI] [PubMed] [Google Scholar]
- 3.(a) Snee PT, Somers RC, Nair G, Zimmer JP, Bawendi MG, Nocera DG. J Am Chem Soc. 2006;128:13320–21. doi: 10.1021/ja0618999. [DOI] [PubMed] [Google Scholar]; (b) Zhang CY, Johnson LW. J Am Chem Soc. 2006;128:5324–25. doi: 10.1021/ja060537y. [DOI] [PMC free article] [PubMed] [Google Scholar]; (c) Algar WR, Krull UJ. Anal Chim Acta. 2007;581:193–201. doi: 10.1016/j.aca.2006.08.026. [DOI] [PubMed] [Google Scholar]; (d) Xu CJ, Xing BG, Rao HH. BBRC. 2006;344:931–5. doi: 10.1016/j.bbrc.2006.03.225. [DOI] [PubMed] [Google Scholar]
- 4.Cohen GM. Biochem J. 1997;326(Pt 1):1–16. doi: 10.1042/bj3260001. [DOI] [PMC free article] [PubMed] [Google Scholar]
- 5.(a) Devarajan E, Sahin AA, Chen JS, Krishnamurthy RR, Aggarwal N, Brun AM, Sapino A, Zhang F, Sharma D, Yang XH, Tora AD, Mehta K. Oncogene. 2002;21:8843–51. doi: 10.1038/sj.onc.1206044. [DOI] [PubMed] [Google Scholar]; (b) Hunter AM, LaCasse EC, Korneluk RG. Apoptosis. 2007;12:1543–68. doi: 10.1007/s10495-007-0087-3. [DOI] [PubMed] [Google Scholar]; (c) Ai H, Hazelwood KL, Davidson MW, Campbell RE. Nat Meth. 2008;5:401–403. doi: 10.1038/nmeth.1207. [DOI] [PubMed] [Google Scholar]
- 6.Tawa P, Tam J, Cassady R, Nicholson DW, Xanthoudakis S. Cell Death Differ. 2001;8:30–37. doi: 10.1038/sj.cdd.4400769. [DOI] [PubMed] [Google Scholar]
- 7.Dennis AM, Bao G. Nano Letters. 2008;8:1439–1445. doi: 10.1021/nl080358+. [DOI] [PubMed] [Google Scholar]
- 8.Pons T, Medintz IL, Wang X, English DS, Mattoussi H. J Am Chem Soc. 2006;128:15324–15331. doi: 10.1021/ja0657253. [DOI] [PubMed] [Google Scholar]
- 9.Medintz IL, Clapp AR, Brunel FM, Tiefenbrunn T, Uyeda HT, Chang EL, Deschamps JR, Dawson PE, Mattoussi H. Nat Mater. 2006;5:581–589. doi: 10.1038/nmat1676. [DOI] [PubMed] [Google Scholar]
- 10.Talanian RV, Quinlan C, Trautz S, Hackett MC, Mankovich JA, Banach D, Ghayur T, Brady KD, Wong WW. J Biol Chem. 1997;272:9677–82. doi: 10.1074/jbc.272.15.9677. [DOI] [PubMed] [Google Scholar]
- 11.(a) Shi L, Rosenzweig N, Rosenzweig Z. Anal Chem. 2007;79:208–14. doi: 10.1021/ac0614644. [DOI] [PubMed] [Google Scholar]; (b) Shi L, Paoli VD, Rosenzweig N, Rosenzweig Z. J Am Chem Soc. 2006;128:10378–9. doi: 10.1021/ja063509o. [DOI] [PubMed] [Google Scholar]; (c) Lu H, Schops O, Woggon U, Niemeyer CM. J Am Chem Soc. 2008;130:4815–4827. doi: 10.1021/ja078243f. [DOI] [PubMed] [Google Scholar]; (d) Medintz IL, Pons T, Delehanty JB, Susumu K, Brunel FM, Dawson PE, Mattoussi H. Bioconj Chem. 2008;19:1785–1795. doi: 10.1021/bc800089r. [DOI] [PubMed] [Google Scholar]
Associated Data
This section collects any data citations, data availability statements, or supplementary materials included in this article.