

Abstract
Background:
While stable xenon CT (Xe-CT) cerebral blood flow (CBF) is an accepted standard for quantitative assessment of cerebral hemodynamics, the accuracy of magnetic resonance perfusion-weighted imaging (PWI-MRI) is unclear. The Improved PWI Methodology in Acute Clinical Stroke Study compares PWI findings with Xe-CT CBF values in patients experiencing symptomatic severe cerebral hypoperfusion.
Methods:
We compared mean transit time (MTT) and Tmax PWI-MRI with the corresponding Xe-CT CBF values in 25 coregistered regions of interest (ROIs) of multiple sizes and locations in nine subacute stroke patients. Comparisons were performed with Pearson correlation coefficients (R). We performed receiver operating characteristic (ROC) curve analyses to define the threshold of Tmax and absolute MTT that could best predict a Xe-CT CBF <20 mL/100 g/minute.
Results:
The subjects’ mean (SD) age was 50 (15) years, the median (interquartile range [IQR]) NIH Stroke Scale score was 2 (2–6), and the median (IQR) time between MRI and Xe-CT was 12 (−7–19) hours. The total number of ROIs was 225, and the median (IQR) ROI size was 550 (360–960) pixels. Tmax correlation with Xe-CT CBF (R = 0.63, p < 0.001) was stronger than absolute MTT (R = 0.55, p < 0.001), p = 0.049. ROC curve analysis found that Tmax >4 seconds had 68% sensitivity, 80% specificity, and 77% accuracy and MTT >10 seconds had 68% sensitivity, 77% specificity, and 75% accuracy for predicting ROIs with Xe-CT CBF <20 mL/100 g/minute.
Conclusion:
Our results suggest that in subacute ischemic stroke patients, Tmax correlates better than absolute mean transit time (MTT) with xenon CT cerebral blood flow (Xe-CT CBF) and that both Tmax >4 seconds and MTT >10 seconds are strongly associated with Xe-CT CBF <20 mL/100 g/minute.
GLOSSARY
- CBF
= cerebral blood flow;
- DBP
= diastolic blood pressure;
- DEFUSE
= Diffusion and Perfusion Imaging Evaluation for Understanding Stroke Evolution;
- DWI
= diffusion-weighted imaging;
- EPITHET
= Echoplanar Imaging Thrombolytic Evaluation Trial;
- FOV
= field of view;
- ICA
= internal carotid artery;
- IQR
= interquartile range;
- MCA
= middle cerebral artery;
- MTT
= mean transit time;
- NIHSS
= NIH Stroke Scale;
- PWI
= perfusion-weighted imaging;
- PWI-MRI
= magnetic resonance perfusion-weighted imaging;
- ROC
= receiver operating characteristic;
- ROI
= region of interest;
- SBP
= systolic blood pressure;
- SVD
= singular value decomposition;
- Xe-CT
= xenon CT.
Providing an accurate quantitative assessment of cerebral hemodynamics is one of the major goals of bolus contrast perfusion MRI (PWI-MRI).1,2 Both Tmax and mean transit time (MTT) are commonly used perfusion-weighted imaging (PWI) analysis methods to detect regions of hypoperfusion in patients with acute ischemic stroke. At present, these techniques are primarily used in research settings. One study that compared PWI-MRI with PET in stroke patients found that a Tmax threshold between 4 and 6 seconds (5.5) and MTT delays >6 seconds could delineate regions of acute ischemic penumbra that were identified by PET scan.3 Stable xenon CT (Xe-CT) is an accepted standard for the quantitative estimation of cerebral blood flow (CBF).4 We estimated the correlations between PWI-MRI Tmax, absolute MTT values, and Xe-CT CBF in patients who experienced a subacute or chronic brain infarction.
METHODS
The Improved PWI Methodology in Acute Clinical Stroke Study is an NIH-funded study of patients experiencing a subacute or chronic brain infarct due to occlusion or severe stenosis of a large cervical or cerebral artery. This study was approved by the Stanford Institutional Review Board, and all patients provided informed consent.
Nine patients (five men, four women) with clinical evidence of cerebral ischemia underwent stable Xe-CT (diversified diagnostic imaging, four 10-mm slices, acquisition matrix 512 × 512, field of view [FOV] 250 mm, 28% xenon gas) and single-shot GE echo-planar imaging–based PWI-MRI (1.5-tesla GE, repetition time/echo time 2,000/60 msec, twelve 6-mm slices, acquisition matrix 128 × 128, FOV 240 mm) within a 24-hour period. No recanalization technique including thrombolytic therapy, internal carotid artery (ICA)/external carotid artery bypass, or carotid endarterectomy was performed between symptom onset and the MRI and Xe-CT scans. Symptomatic vascular lesions were identified by magnetic resonance angiography at the time of MRI examination.
CT was performed using a GE Lightspeed 8 detector scanner integrated with a stable xenon enhancer system (Diversified Diagnostic Products, Houston, TX). The Xe-CT protocol imaged four contiguous 10-mm slices (80 kVp, 240 mA) with the lowest slice at the level of the basal ganglia. Eight sets of images were acquired at 45-second intervals. The first two time points were acquired during room air inhalation, whereas the remaining six time points were acquired during 28% xenon gas inhalation. End-tidal xenon concentration was assumed equal to arterial xenon concentration, a reasonable approximation except in patients with severe respiratory disease. CBF was calculated using the Kety autoradiographic method by the manufacturer’s commercial software according to reference 5, yielding CBF maps with a nominal in-plane 1-mm spatial resolution.
Perfusion MRI maps (Tmax and MTT) were calculated using circular singular value decomposition (SVD) of the tissue concentration–over–time curve using an arterial input function from the contralateral middle cerebral artery (MCA) or the basilar artery in case of bilateral ICA occlusion and venous output function detection.6,7
Images were coregistered using SPM2 (Wellcome Department of Imaging Neuroscience, University College of London, UK, available at www.fil.ion.ucl.ac.uk/spm/software/spm2). For each patient, we drew 25 regions of interest (ROIs) of multiple sizes and locations on the MRI and Xe-CT slices. The ROIs were drawn inside the core of infarction (on diffusion-weighted imaging [DWI], B1000), within the PWI lesions (MTT, Tmax), within regions of decreased CBF on Xe-CT as well as in normal gray and white matter regions in the ipsilateral and contralateral hemispheres. All ROIs were transferred to all three of the coregistered perfusion maps (Xe-CT CBF, MTT, and Tmax) and the mean Tmax, MTT, and Xe-CT CBF values were calculated for each ROI (figure 1). We then compared the mean PWI-MTT, Tmax, and Xe-CT CBF values obtained among each subject and then among the complete cohort for all ROIs and then those with a mean Xe-CT CBF <20 mL/100 g/minute. We used linear regression analysis weighted by the size of the ROI to take into account the size difference between ROIs. As the plots show (figure 2), the relation between Xe-CT CBF and both PWI-MRI modalities (MTT and Tmax) were not linear in either the overall or the individual comparisons. Therefore, we report the correlation estimated from linear regression using a logarithmic transformation of Xe-CT CBF as a dependent variable. Strength of association was estimated with Pearson correlation coefficient (R) and then compared using t tests. We compared the mean Tmax and absolute MTT values measured in ROIs with Xe-CT CBF <20 mL/100 g/minute vs ROIs with Xe-CT CBF ≥20 mL/100 g/minute using t tests. We performed a receiver operating characteristic (ROC) curve analysis to define the thresholds of Tmax and MTT that most accurately predicted Xe-CT CBF <20 mL/100 g/minute, and the accuracy of each threshold was calculated.

Figure 1 Region-of-interest generation
A 47-year-old patient presented with an acute brain infarct complicating left internal carotid artery occlusion. The baseline NIH Stroke Scale score was 9. MRI and xenon CT (Xe-CT) were performed 2 days after symptom onset. The region of interest (n = 230 pixels) was initially drawn in the Xe-CT cerebral blood flow (CBF) map (mean 9 mL/100 g/minute, SD 7.4) and then transposed on the coregistered Tmax map (mean 7.5 seconds, SD 3.5) and mean transit time (MTT) map (mean 16 seconds, SD 3.5). DWI = diffusion-weighted imaging.

Figure 2 Correlation between xenon CT CBF mean values and Tmax, MTT, and between Tmax and MTT
Linear correlation fit line (plain line); logarithmic correlation fit line (dashed line). (A) Linear and logarithmic correlation between Tmax and xenon CT (Xe-CT) cerebral blood flow (CBF) mean values. (B) Linear and logarithmic correlation between mean transit time (MTT) and Xe-CT CBF mean values. (C) Linear correlation between Tmax and MTT mean values.
RESULTS
Baseline characteristics.
The baseline characteristics of the patients are presented in the table. The systolic and diastolic blood pressure were available for seven cases at the time of MRI and Xe-CT and were not statistically different (p = 0.6). The time between scans was <12 hours in six cases (the three remaining were performed between 20 and 26 hours). The stroke etiology was determined by the attending stroke neurologist to be atherothrombosis (n = 5), moyamoya disease (n = 2) cardioembolism (n = 1), or ICA dissection (n = 1). The vascular lesions were listed as follows: one symptomatic extracranial ICA stenosis and two intracranial MCA stenoses; five symptomatic ICA occlusions and one embolic distal MCA occlusion. Eight cases experienced an ischemic stroke, and one case had recurrent TIAs.
Table Baseline characteristics
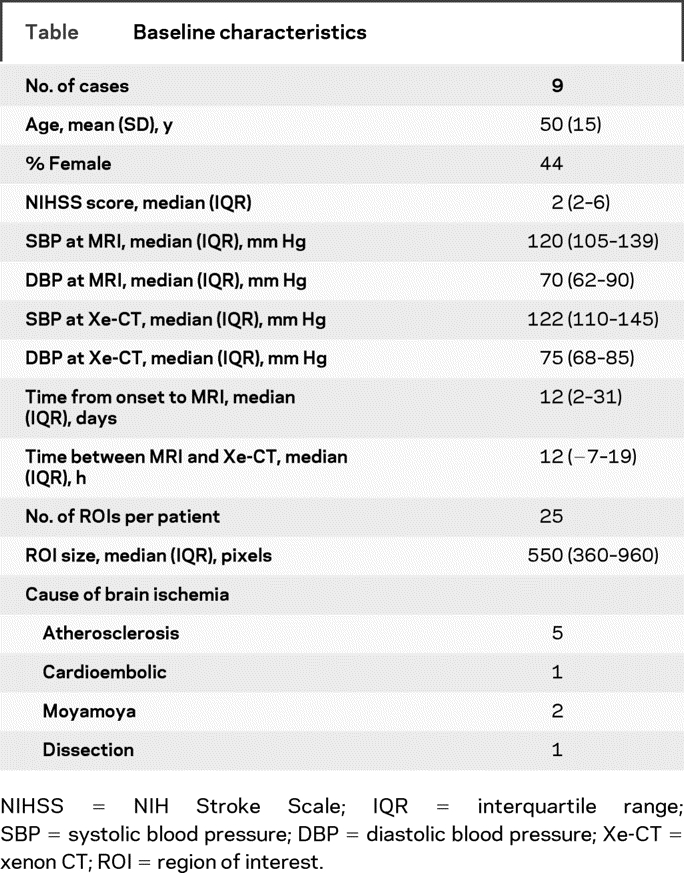
Three patients received acetazolamide during Xe-CT. The acetazolamide test was performed after MRI in one case and more than 24 hours before MRI in two cases (26 and 28 hours after Xe-CT). Only the pre-acetazolamide xenon maps were used for this analysis. The total number of ROIs was 225, and the median (interquartile range [IQR]) ROI size was 550 (range 360–960) pixels. Seventy-one percent of the ROIs were drawn in the white matter, 18% were drawn in the cortex, and 11% were drawn in both. Thirty-nine percent of the ROIs were drawn in a restricted diffusion lesion, and 60% were drawn in a normal region on DWI.
Correlations.
There was a substantial variability between individual patient correlation coefficients: R values ranged from 0.46 to 0.92 for Tmax/Xe-CT CBF and from 0.27 to 0.72 for absolute MTT/Xe-CT CBF. The overall correlation between Tmax and Xe-CT CBF was R = 0.49 (p < 0.001) and between absolute MTT and Xe-CT CBF was R = 0.44 (p < 0.001), p = 0.251, whereas between Tmax and MTT the correlation was R = 0.72 (p < 0.001). To adjust for intersubject variability, we normalized the data by expressing values for each ROI as the percentage of the mean within the subject. Normalization increased the strength of the correlation between MRI and Xe-CT parameters. The correlation between Tmax and Xe-CT CBF (R = 0.62, p < 0.001) was significantly higher than observed for absolute MTT and Xe-CT CBF (R = 0.53, p < 0.001), p = 0.030. The correlation between absolute MTT and Tmax was R = 0.69 (p < 0.001).
Sixty-three ROIs (28%) had a mean Xe-CT CBF value <20 mL/100 g/minute. Compared with the remaining 162 ROIs, 56% vs 20% (p < 0.001) were drawn in areas of restricted diffusion, 81% vs 67% (p = 0.043) were in white matter, and 95% vs 56% (p <0.001) were ipsilateral of the vessel lesion (stenosis/occlusion). This analysis was performed without adjustment for intersubject variability because the number of ROIs per patient varied greatly, from 1 to 17, but differences in the size of the ROI were accounted for. We found a good correlation between absolute MTT and Tmax (R = 0.83, p < 0.001) in the ROIs with a mean Xe-CT CBF <20 mL/100 g/minute. The correlation between Tmax and Xe-CT CBF was moderate (R = 0.45, p < 0.001) and low between absolute MTT and Xe-CT CBF (R = 0.36, p = 0.004) in these regions with low CBF. The mean values of Tmax = 5.2 seconds (SD 2.8) and MTT = 11.3 seconds (SD 3.9) measured in the area with Xe-CT CBF <20 mL/100 g/minute were higher compared with the mean Tmax = 2.5 seconds (SD 2.1) and MTT = 8.5 seconds (SD 3.1) observed in the remaining areas (p < 0.001 and p = 0.001).
ROC curves.
The ROC curve analyses suggested that Tmax >4 seconds corresponded with Xe-CT CBF <20 mL/100 g/minute with a sensitivity of 68% and a specificity 80%. MTT >10 seconds delays corresponded with Xe-CT CBF <20 mL/100 g/minute with a sensitivity of 68% and a specificity of 77%. The accuracies of the thresholds Tmax >4 seconds and MTT >10 seconds to predict Xe-CT CBF <20 mL/100 g/minute were 77% and 75%.
DISCUSSION
Our results suggest that Tmax values correlate better than absolute MTT values with Xe-CT CBF and that ROIs that have Xe-CT CBF <20 mL/100 g/minute predictably have mean PWI Tmax values >4 seconds and MTT values >10 seconds.
Two previous studies estimated the correlation between Xe-CT and PWI. The first study documented a significant correlation between the two techniques in 10 subacute ischemic stroke patients; however, a slight overestimation of CBF by PWI in both gray and white matter was noted.8 This study did not perform either standard or circular SVD. A more recent study that incorporated circular SVD compared the ability of PWI-MRI and intra-arterial Xe-CT to detect CBF change after a revascularization procedure in eight patients with significant carotid stenosis.9 The authors reported a significant correlation between PWI and Xe-CT but noted an underestimation of the change in CBF with PWI. We compared Xe-CT CBF with PWI-MTT or Tmax in a group of patients with subacute stroke and a short time window between the two examinations.
Two previous studies compared PET scan–derived MTT to standard3,10 or circular SVD3 PWI-MRI MTT. The first study enrolled seven healthy volunteers,10 and the second enrolled five acute stroke patients. Both studies found a significant correlation between PWI and PET-MTT. They documented that PWI-derived absolute MTT10 and MTT delay3 were consistently less prolonged than PET-MTT. There was a strong correlation between the PWI-MTT values obtained using both types of deconvolution.3
In our study, individual patient analysis (25 ROIs/case) documented a large variation in the correlation coefficients between PWI Tmax, absolute MTT, and Xe-CT CBF. This finding has been previously documented between PWI-MRI MTT delays and PET scan MTT among stroke patients, whereas these variations were not observed among healthy volunteers.3,10 However, consistent with our results, overall comparisons demonstrated significant correlations. In addition, the correlations between MTT and Tmax with Xe-CT CBF in the areas with a CBF <20 mL/100 g/minute were modest. These findings highlight the limitation of bolus tracking MRI for the absolute quantification of cerebral perfusion in cerebral ischemia. Variability may occur because of bolus delay dispersion caused by vessel lesions, as well as individual patients characteristics (stage of ischemia, local hematocrit, etc.), which can critically alter perfusion quantification.2 Therefore, neither absolute MTT nor Tmax seems to be an adequate substitute for Xe-CT to perform quantitative estimation of CBF in subacute ischemic stroke. Nonetheless, we found that both Tmax and absolute MTT were significantly correlated with Xe-CT CBF and that absolute MTT (>10 seconds) and Tmax threshold (>4 seconds) were able to predict critical hypoperfusion as defined by Xe-CT.
Previous PET studies found that cerebral blood volume (CBV) is often increased downstream of ICA occlusion.11 Because MTT is the ratio CBV/CBF, variations in CBV could have altered the correlation with Xe-CT CBF. In addition, as opposed to Tmax and MTT delay, absolute MTT is not normalized to the unaffected side. The use of MTT delay might have improved the yield of this modality.
Several studies have demonstrated that 20 mL/100 g/minute Xe-CT CBF is an important threshold to define potentially reversible acute ischemic lesions.12–15 Results of our study suggest that thresholds of Tmax >4 seconds and MTT >10 seconds can detect critical hypoperfusion defined by Xe-CT CBF <20 mL/100 g/minute with a sensitivity and specificity >70%. A significant amount of ischemic penumbra was unlikely to be present in most of our patients because they were scanned a median of 12 days after symptoms onset. However, 95% of the ROIs with a Xe-CT CBF <20 mL/100 g/minute were ipsilateral to the symptomatic vessel lesion and associated with restricted DWI lesions, suggesting the persistence of severe hypoperfusion.
In the recent clinical trials Diffusion and Perfusion Imaging Evaluation for Understanding Stroke Evolution (DEFUSE) and Echoplanar Imaging Thrombolytic Evaluation Trial (EPITHET), a threshold of Tmax >2 seconds was used to define critically hypoperfused brain tissue 3 to 6 hours after symptom onset.16,17 In the present study, PWI Tmax acquisition and processing were performed in the same manner as in DEFUSE. ROC curve analysis found that a Tmax threshold >2 seconds could predict Xe-CT CBF <20 mL/100 g/minute with 100% sensitivity but only 12% specificity. Substudies from both DEFUSE and EPITHET have recently reported that Tmax values >4 seconds or >6 seconds more accurately predicted penumbral salvage and infarct growth than the >2-second threshold.18,19 Another study found that Tmax values >6 seconds or >8 seconds correlate well with final infarct volume.20 In addition, a recent study found that Tmax values between >4 seconds and >6 seconds could identify acute ischemic penumbra as assessed by PET scan.3 Therefore, multiple lines of evidence indicate that the commonly used threshold of Tmax >2 seconds overestimates critical hypoperfusion in stroke patients and more severe thresholds should be adopted in future clinical trials.
Our study has several limitations. The Improved PWI Methodology in Acute Clinical Stroke Study is an exploratory study of subacute stroke patients with Xe-CT as the gold standard. In contrast to MRI, Xe-CT evaluation is limited to four hemispheric slices. Therefore, our analyses were restricted by the spatial limitations of Xe-CT. We included subjects who were clinically stable and had limited neurologic deficits to facilitate performing both examinations within a short time period. Therefore, data from this study are not directly applicable to acute stroke patients.
Different PWI sequences and analyses techniques can be used to assess cerebral perfusion.4 We used absolute MTT and Tmax maps generated by deconvolution of the tissue concentration–over–time curve using an arterial input function from the MCA on the unaffected side. Different PWI acquisition or analysis techniques may produce different results. Future studies should compare additional techniques to clarify how PWI acquisition and analysis methods affect the correlations with Xe-CT results. In addition, gray vs white matter regions may have different correlations between PWI and Xe-CT. Larger studies are required to clarify relationships between Xe-CT and PWI in specific brain regions.
AUTHOR CONTRIBUTIONS
M. Mlynash conducted the statistical analysis.
Address correspondence and reprint requests to Dr. Jean-Marc Olivot, Department of Neurology and Neurological Sciences and the Stanford Stroke Center, Stanford University Medical Center, 701 Welch Rd., Suite 325, Palo Alto, CA 94304 jmolivot@stanford.edu
Supported in part by NIH grants (5 R01 NS047607-04, 2R01EB002711, 1R21EB006860, P41RR09784, K23 NS051372).
Disclosure: The authors report no disclosures.
Received August 27, 2008. Accepted in final form December 16, 2008.
REFERENCES
- 1.Kidwell CS, Alger JR, Saver JL. Beyond mismatch: evolving paradigms in imaging the ischemic penumbra with multimodal magnetic resonance imaging. Stroke 2003;34:2729–2735. [DOI] [PubMed] [Google Scholar]
- 2.Calamante F, Gadian DG, Connelly A. Quantification of perfusion using bolus tracking magnetic resonance imaging in stroke: assumptions, limitations, and potential implications for clinical use. Stroke 2002;33:1146–1151. [DOI] [PubMed] [Google Scholar]
- 3.Takasawa M, Jones PS, Guadagno JV, et al. How reliable is perfusion MR in acute stroke? Validation and determination of the penumbra threshold against quantitative PET. Stroke 2008;39:870–877. [DOI] [PubMed] [Google Scholar]
- 4.Latchaw RE, Yonas H, Hunter GJ, et al. Guidelines and recommendations for perfusion imaging in cerebral ischemia: a scientific statement for healthcare professionals by the Writing Group on Perfusion Imaging, from the Council on Cardiovascular Radiology of the American Heart Association. Stroke 2003;34:1084–1104. [DOI] [PubMed] [Google Scholar]
- 5.Johnson DW, Stringer WA, Marks MP, Yonas H, Good WF, Gur D. Stable xenon ct cerebral blood flow imaging: rationale for and role in clinical decision making. AJNR Am J Neuroradiol 1991;12:201–213. [PMC free article] [PubMed] [Google Scholar]
- 6.Ostergaard L, Sorensen AG, Kwong KK, Weisskoff RM, Gyldensted C, Rosen BR. High resolution measurement of cerebral blood flow using intravascular tracer bolus passages, part II: experimental comparison and preliminary results. Magn Reson Med 1996;36:726–736. [DOI] [PubMed] [Google Scholar]
- 7.Ostergaard L, Weisskoff RM, Chesler DA, Gyldensted C, Rosen BR. High resolution measurement of cerebral blood flow using intravascular tracer bolus passages, part I: mathematical approach and statistical analysis. Magn Reson Med 1996;36:715–725. [DOI] [PubMed] [Google Scholar]
- 8.Hagen T, Bartylla K, Piepgras U. Correlation of regional cerebral blood flow measured by stable xenon CT and perfusion MRI. J Comput Assist Tomogr 1999;23:257–264. [DOI] [PubMed] [Google Scholar]
- 9.Ko NU, Achrol AS, Martin AJ, Chopra M, Saloner DA, Higashida RT, Young WL. Magnetic resonance perfusion tracks 133Xe cerebral blood flow changes after carotid stenting. Stroke 2005;36:676–678. [DOI] [PubMed] [Google Scholar]
- 10.Ibaraki M, Ito H, Shimosegawa E, et al. Cerebral vascular mean transit time in healthy humans: a comparative study with PET and dynamic susceptibility contrast-enhanced MRI. J Cereb Blood Flow Metab 2007;27:404–413. [DOI] [PubMed] [Google Scholar]
- 11.Derdeyn CP, Videen TO, Yundt KD, et al. Variability of cerebral blood volume and oxygen extraction: stages of cerebral haemodynamic impairment revisited. Brain 2002;125:595–607. [DOI] [PubMed] [Google Scholar]
- 12.Rubin G, Firlik AD, Levy EI, Pindzola RR, Yonas H. Xenon-enhanced computed tomography cerebral blood flow measurements in acute cerebral ischemia: review of 56 cases. J Stroke Cerebrovasc Dis 1999;8:404–411. [DOI] [PubMed] [Google Scholar]
- 13.Gupta R, Jovin TG, Yonas H. Xenon CT cerebral blood flow in acute stroke. Neuroimaging Clin North Am 2005;15:531–542, x. [DOI] [PubMed] [Google Scholar]
- 14.Firlik AD, Yonas H. The utility of Xe-CT cerebral blood flow in the management of acute stroke. Keio J Med 2000;49 (suppl 1):A129–A130. [PubMed] [Google Scholar]
- 15.Levy EI, Scarrow AM, Kanal E, Rubin G, Yonas H, Kirby L. Reversible ischemia determined by xenon-enhanced CT after 90 minutes of complete basilar artery occlusion. AJNR Am J Neuroradiol 1998;19:1943–1946. [PMC free article] [PubMed] [Google Scholar]
- 16.Albers GW, Thijs VN, Wechsler L, et al. Magnetic resonance imaging profiles predict clinical response to early reperfusion: the Diffusion and Perfusion Imaging Evaluation for Understanding Stroke Evolution (DEFUSE) study. Ann Neurol 2006;60:508–517. [DOI] [PubMed] [Google Scholar]
- 17.Davis SM, Donnan GA, Parsons MW, et al. Effects of alteplase beyond 3 h after stroke in the Echoplanar Imaging Thrombolytic Evaluation Trial (EPITHET): a placebo-controlled randomised trial. Lancet Neurol 2008;7:299–309. [DOI] [PubMed] [Google Scholar]
- 18.Christensen S, Parsons M, De Silva DA, et al. Optimal mismatch definitions for detecting treatment response in acute stroke. Cerebrovasc Dis 2008;25 (suppl 2):33. [Google Scholar]
- 19.Olivot JM, Mlynash M, Thijs V, et al. Optimal Tmax threshold for predicting penumbral tissue in acute stroke. Stroke 2009;40:469–475. [DOI] [PMC free article] [PubMed] [Google Scholar]
- 20.Shih LC, Saver JL, Alger JR, et al. Perfusion-weighted magnetic resonance imaging thresholds identifying core, irreversibly infarcted tissue. Stroke 2003;34:1425–1430. [DOI] [PubMed] [Google Scholar]