

Abstract
Memories are thought to be attractor states of neuronal representations, with the hippocampus a likely substrate for context-dependent episodic memories. However, such states have not been directly observed. For example, the hippocampal place cell representation of location responds continuously to changes in environmental shape alone. We report that exposure to novel square and circular environments made of different materials creates attractor representations for both shapes: place cells abruptly and simultaneously switch between representations as environmental shape changes incrementally. This enables study of attractor dynamics in a cognitive representation and may correspond to the formation of distinct contexts in context-dependent memory.
For over thirty years, auto-associative or attractor dynamics based on Hebbian synaptic modification have been central to neuronal models of memory, with particular focus on the dense recurrent collaterals of the hippocampus and its crucial role in context-dependent episodic memory (1-14). We investigated whether attractors were present in the hippocampal representations of different environments.
Place cells in the mammalian hippocampus signal the location of the animal within its environment by firing whenever it visits a specific region (the ‘place field’ (10,15)). This representation can be specific to the environment, with different cells being active in different environments, or the same cell being active at different locations in different environments (16). The change in representation between environments is known as ‘remapping’. After foraging in square and circular boxes which differed only in their shapes (not texture or colour), CA1 hippocampal place cells took considerable time (many days or weeks) to differentiate between the two boxes, with simultaneously-recorded cells ‘remapping’ at different times (17). Individual cells appeared to represent a location in one or both environments independently of other cells.
We recorded from CA1 place cells in a paradigm designed to produce more rapid remapping (18). Animals were initially exposed to a square and a circle which differed in colour, texture, and shape. The square was a morph box (17) (which can be configured in various shapes, see Fig. S1A & B), while the circle was made of painted wood. This led to rapid remapping with the majority (92% - 48/52) of cells differentiating between the environments at the end of the first day’s six trials (3 in each box, see Fig. 1A). After 3 days of this training, the animals were trained in the morph box configured as a square and a circle on alternate trials for an additional 3 days (Fig. S1C). The place fields of the majority of remapped cells (40/46) transferred successfully to the morph-circle, showing the same pattern as in the wood-circle (see Fig. 1B). Different place fields in two configurations of the morph box can only be cued by environmental shape, as other attributes such as texture and colour do not vary. Of the 6 animals, one failed to show rapid remapping in the morph square and wooden circle, and one did not show wooden circle to morph-circle pattern transfer. In these cases, the experiment was terminated. This paper describes results from the remaining 4 animals.
Fig. 1.
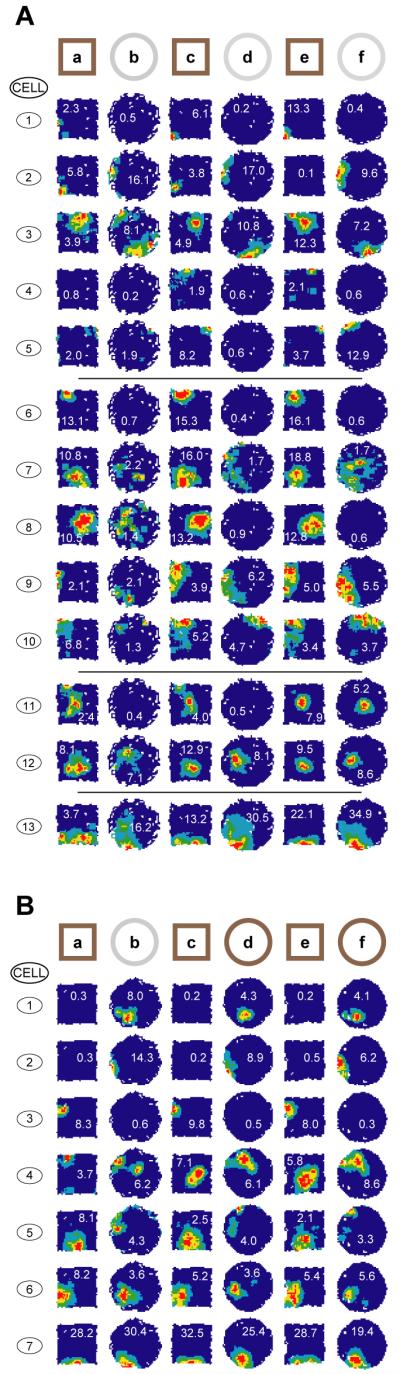
Rapid remapping between the morph square and the wooden circle in Rat 2. A) Most cells differentiate between the morph square and the wooden circle by the end of the first three trials of each. Some cells (1-5) show increasing divergence between the square and circle fields during this initial exposure period. Others (6-10) differentiate between them from the start. Yet others (11-12) appear to converge to a common representation, and a minority (13) do not remap. B) Immediate transfer of representation from wooden circle to morph circle in Rat 2. Firing fields on the first trial in the morph circle are highly similar to those in the wooden circle (compare trials b & d). Each field is auto-scaled to peak firing rate shown in red. Numbers superimposed on fields in this and subsequent figures show peak firing rates.
Are the different hippocampal representations of the morph-square and morph-circle after remapping due to the formation of separate attractors for each shape? If so, each representation would lie at the bottom of a ‘basin of attraction’ within which other representations inevitably evolve into the attractor representation under the system’s dynamics: representations of intermediate shapes would revert to either the square or the circle representation (3,6) (see Fig. S3A-C). If not, representations of intermediate shapes would remain intermediate to those of the circle and square.
We recorded from groups of neurons during a series of probe trials in a set of octagonal morph-boxes (18) which varied from square-like (adjacent side ratio 1:7) to circle-like (adjacent side ratio 4:4) through more ambiguous intermediates (see Fig. 2 top row & Fig. S1D). Almost all simultaneously-recorded cells (28/33) showed an abrupt switch from the square-like pattern to the circle-like one across the octagonal series. Fig. 2 shows the firing fields of 20 simultaneously-recorded place cells in the series. Trials are presented in order of most square-like on the left to most circle-like on the right, but were run in two series of interleaved and balanced order (Fig. S1E). Seventeen of the 20 cells clearly remapped between the square and the circle: 12 rate-remapped (only firing in one or other shape); 5 field position-remapped (firing in different places in the two shapes). The remaining three cells did not reach our criterion for remapping (18). Almost all of the cells abruptly switched from the square-like to the circle-like pattern at the same transition point. Fig. 3A quantifies this effect by comparing the similarity of each cell’s firing in the octagons to that in the square and circle (18). A similar pattern was seen in the other three animals (Fig. 3B-D left column).
Fig. 2.

Abrupt and coherent expression of square- or circle- representation during probe trials in intermediate octagonal environments in Rat 4. The 17 of 20 place cells simultaneously recorded from rat 4 with different (remapped) firing patterns in the square and the circle almost all switch from the square-like to circle-like pattern between the 2:6 and 3:5 octagons. 8 cells had fields in the circle but not the square (cells 1-8); 4 in the square but not the circle (9-12); 5 fired in both but in different places (13-17), and 3 did not did not reach our criterion for remapping (18-20) (18).
Fig. 3.

Co-ordinated shift in square-to-circle switch point between the first and second octagon series. Plots A-D show the similarity of place cells’ firing patterns in probe trials of varying shape to their firing patterns in square (red) or circle (blue) baseline trials (mean and standard error across cells, see Methods). In the first series of octagons all animals show abrupt remapping between the 2:6 and 3:5 octagons (A-D, left column); in the second series (right column), rats 4 (A) and 1 (B) again remap at this point while rat 2 (C) remaps between the square and 1:7 octagon and rat 3 (D) remaps between the 1:7 and 2:6 octagons. E) Firing rate maps for all remapped cells for the two octagon series for rat 2.
The abrupt and coherent remapping of the place cell ensemble seems to require co-ordinated action, as in an auto-associative network, rather than reflecting cells independently responding to the same subtle environmental changes. For example, if each cell independently remapped at any of the 5 shape transitions, the probability of N cells remapping at the same point would be 0.2N-1 (p < 10-11 for the 17 cells from rat 4 in Fig. 2; p < 10-4 for rat 1, Fig. S2A; p < 0.05 for rat 2 and rat 3, Fig. 3E and Fig. S2B respectively). This impression is strengthened by the remapping pattern in two of the 4 animals. In one animal (rat 2) the cells remapped between the 2:6 and 3:5 octagons during the first series of probe trials, but remapped between the square and 1:7 octagons during the second series (Fig. 3C,E). Significantly, all cells again switched at the same point. Another animal (rat 3) showed a similar pattern (remapping at the 1:7-2:6 transition in the second series, Fig. 3D), while the remaining two animals remapped at the same point in both series (Fig. 3A-B).
Are attractor dynamics observable at the start of a trial? The firing patterns in intermediate shapes might take time to reach the circle or square representation, when starting from more intermediate representations (see Fig. S3A-B). The firing patterns in successive 10s intervals from the start of each trial were examined (18) in our largest dataset (17 remapped cells, see Fig. 4A-B). Several results should be noted. First, the similarity of the firing patterns in square and circle probe trials to square and circle baselines is stable across intervals (with the possible exception of the very first interval in the square), controlling for any non-specific temporal effects. Second, the firing in the square-like octagons (1:7 & 2:6) is already more square-like than circle-like in the first 10s interval, but slowly becomes more square-like over the following 2 minutes. A similar pattern is seen in one of the two more circle-like octagons (4:4). This result indicates a surprisingly slow component to attractor dynamics that should be studied further with larger samples of cells (a similar trend which did not reach significance was seen for our next-largest dataset, the 8 remapped cells in Fig. S2A).
Fig. 4.

Attractor dynamics of environmental representations. A) Evolution of the firing pattern in successive 10s intervals of trials in the different shaped environments. Left column: similarity of firing to that in square and circle baseline trials (mean and standard error for the 17 remapped cells in Fig. 2). Right column: difference in similarity to square and circle baseline firing patterns. Grey line shows mean and standard error over cells of the difference between the red and blue curves shown in the left column. This becomes steadily more pronounced over time, and can be fitted by a sigmoid whose slope increases linearly with time (blue line: y = 2/(1+exp[(a0t+a1)(s-s0)]) -1, where t is time in seconds, s=1 to 6 corresponds to the series of shapes from square to circle, and a0=0.019, a1=0.674, s0=3.29 were chosen to fit the data). B) Firing patterns in intermediate 1:7 and 2:6 octagons become more square-like over time, the patterns in 4:4 octagons become more circle-like, while the patterns in the square and circle remain unchanged (* = p < 0.05 1-tailed, linear regression) (18).
Previous experiments, including our own, did not find the integrated co-operative behaviour amongst pyramidal cells shown here (19-22). For example, the place cell representation initially adjusts continuously to changes in environmental shape alone, consistent with purely feed-forward processing (22,23), and individual place cells slowly and independently learn to differentiate between square and circular environments made of the same material (17). One possibility is that synaptic modification in the CA3 recurrent collaterals is triggered by multi-modal changes (e.g. of environmental shape, colour and texture) but not by unimodal changes, consistent with a hippocampal role in forming cross-modal associations between stimuli represented in disparate neocortical areas (7,24). Greater remapping was also seen when both proximal and distal cues were changed than when either set was changed alone (25).
The results suggest the operation of both pattern separation, creating radically different representations from highly similar environmental inputs, and coordination of large numbers of place cells to create a global map-like representation of each environment (2,4,5,7,26). These functions are likely to originate in the hippocampus. Remapping has not been observed in its main cortical input, the entorhinal cortex (27,28), and we expect cells there would respond incrementally to the gradual changes in the octagon series. Although our recordings were made in CA1, following previous authors (2,4,5,7-9,14) we hypothesise that pattern separation takes place in the dentate gyrus while auto-associative integration takes place in the CA3 recurrent collaterals (see Fig. S3C). For example, the inability of mutant mice with disabled CA3 NMDA receptors to compensate for the removal of subsets of cues in the Morris water maze (14), the high sparsity of the CA3 representation (20,25), signs of hysteresis within it (29), and the coherent response of CA3 place cells to inconsistent rotation of two sets of cues (mostly following proximal cues, while CA1 cells followed combinations of proximal and distal cues) (21), are all consistent with CA3 acting as an auto-associative network.
Our finding of coherent activity of place cells specific to each environment has several potential functional consequences. Such representations or ‘charts’ (26) could serve to reduce interference between environments by providing orthogonal representations for each. They would also allow the firing of large numbers of cells to be combined to provide an improved estimate of location (30). The ability of information at distant locations to be integrated with the representation of the current location may allow for short-cut and detour behaviour (10,31). More generally, attractor dynamics are thought to underlie context-dependent recollection (as opposed to, e.g., familiarity-based recognition (32)). Thus, understanding the creation of new attractors, and their dynamics, may directly inform the nature and function of ‘context’ in context-dependent episodic memory, and its failure in amnesia. Finally, the ability to study this mechanism at the single unit level allows for electrophysiological, pharmacological and genetic investigation of the mnemonic function of the hippocampus in health and disease.
Supplementary Material
Acknowledgments
We thank Stephen Burton for technical assistance and Tom Hartley for useful discussions. The work was supported by the Wellcome Trust and the Medical Research Council, U.K.
References and Notes
- 1.Hebb DO. The organisation of behavior. Wiley; New York: 1949. [Google Scholar]
- 2.Marr D. Philos.Trans.R.Soc.Lond B Biol.Sci. 1971;262:23. doi: 10.1098/rstb.1971.0078. [DOI] [PubMed] [Google Scholar]
- 3.Hopfield JJ. Proc.Natl.Acad.Sci.U.S.A. 1982;79:2554. doi: 10.1073/pnas.79.8.2554. [DOI] [PMC free article] [PubMed] [Google Scholar]
- 4.McNaughton BL, Morris RG. Trends Neurosci. 1987;10:408. [Google Scholar]
- 5.Treves A, Rolls ET. Hippocampus. 1992;2:189. doi: 10.1002/hipo.450020209. [DOI] [PubMed] [Google Scholar]
- 6.Amit DJ. Modelling Brain Function: The World of Attractor Neural Networks. Cambridge University Press; 1992. [Google Scholar]
- 7.McClelland JL, McNaughton BL, O’Reilly RC. Psychol.Rev. 1995;102:419. doi: 10.1037/0033-295X.102.3.419. [DOI] [PubMed] [Google Scholar]
- 8.Hasselmo ME, Wyble BP, Wallenstein GV. Hippocampus. 1996;6:693. doi: 10.1002/(SICI)1098-1063(1996)6:6<693::AID-HIPO12>3.0.CO;2-W. [DOI] [PubMed] [Google Scholar]
- 9.Blum KI, Abbott LF. Neural Comput. 1996;8:85. doi: 10.1162/neco.1996.8.1.85. [DOI] [PubMed] [Google Scholar]
- 10.O’Keefe J, Nadel L. The hippocampus as a cognitive map. Oxford University Press; 1978. www.cognitivemap.net. [Google Scholar]
- 11.Squire LR, Zola-Morgan S. Trends Neurosci. 1988;11:170. doi: 10.1016/0166-2236(88)90144-0. [DOI] [PubMed] [Google Scholar]
- 12.Phillips RG, LeDoux JE. Behav.Neurosci. 1992;106:274. doi: 10.1037//0735-7044.106.2.274. [DOI] [PubMed] [Google Scholar]
- 13.Eichenbaum H. Nat.Rev.Neurosci. 2000;1:41. doi: 10.1038/35036213. [DOI] [PubMed] [Google Scholar]
- 14.Nakazawa K, et al. Science. 2002;297:211. doi: 10.1126/science.1071795. [DOI] [PMC free article] [PubMed] [Google Scholar]
- 15.Muller R. Neuron. 1996;17:813. doi: 10.1016/s0896-6273(00)80214-7. [DOI] [PubMed] [Google Scholar]
- 16.Bostock E, Muller RU, Kubie JL. Hippocampus. 1991;1:193. doi: 10.1002/hipo.450010207. [DOI] [PubMed] [Google Scholar]
- 17.Lever C, Wills T, Cacucci F, Burgess N, O’Keefe J. Nature. 2002;416:90. doi: 10.1038/416090a. [DOI] [PubMed] [Google Scholar]
- 18.Materials and methods are available as supporting material on Science Online.
- 19.Shapiro ML, Tanila H, Eichenbaum H. Hippocampus. 1997;7:624. doi: 10.1002/(SICI)1098-1063(1997)7:6<624::AID-HIPO5>3.0.CO;2-E. [DOI] [PubMed] [Google Scholar]
- 20.Leutgeb S, Leutgeb JK, Treves A, Moser MB, Moser EI. Science. 2004;305:1295. doi: 10.1126/science.1100265. [DOI] [PubMed] [Google Scholar]
- 21.Lee I, Yoganarasimha D, Rao G, Knierim JJ. Nature. 2004;430:456. doi: 10.1038/nature02739. [DOI] [PubMed] [Google Scholar]
- 22.O’Keefe J, Burgess N. Nature. 1996;381:425. doi: 10.1038/381425a0. [DOI] [PubMed] [Google Scholar]
- 23.Hartley T, Burgess N, Lever C, Cacucci F, O’Keefe J. Hippocampus. 2000;10:369. doi: 10.1002/1098-1063(2000)10:4<369::AID-HIPO3>3.0.CO;2-0. [DOI] [PubMed] [Google Scholar]
- 24.Alvarez P, Squire LR. Proc.Natl.Acad.Sci.U.S.A. 1994;91:7041. doi: 10.1073/pnas.91.15.7041. [DOI] [PMC free article] [PubMed] [Google Scholar]
- 25.Vazdarjanova A, Guzowski JF. J.Neurosci. 2004;24:6489. doi: 10.1523/JNEUROSCI.0350-04.2004. [DOI] [PMC free article] [PubMed] [Google Scholar]
- 26.Samsonovich A, McNaughton BL. J.Neurosci. 1997;17:5900. doi: 10.1523/JNEUROSCI.17-15-05900.1997. [DOI] [PMC free article] [PubMed] [Google Scholar]
- 27.Quirk GJ, Muller RU, Kubie JL, Ranck JB., Jr. J.Neurosci. 1992;12:1945. doi: 10.1523/JNEUROSCI.12-05-01945.1992. [DOI] [PMC free article] [PubMed] [Google Scholar]
- 28.Fyhn M, Hafting T, Treves A, Moser M, Moser EI. Society for Neuroscience Abstracts, 330.5. 2004 [Google Scholar]
- 29.Leutgeb JK, Leutgeb S, Treves A, Fyhn M, Meyer R, Barnes CA, McNaughton BL, Moser MB, Moser EI. Society for Neuroscience Abstracts, 330.3. 2004 [Google Scholar]
- 30.Deneve S, Latham PE, Pouget A. Nat.Neurosci. 2001;4:826. doi: 10.1038/90541. [DOI] [PubMed] [Google Scholar]
- 31.Muller RU, Stead M, Pach J. J.Gen.Physiol. 1996;107:663. doi: 10.1085/jgp.107.6.663. [DOI] [PMC free article] [PubMed] [Google Scholar]
- 32.Norman KA, O’Reilly RC. Psychol.Rev. 2003;110:611. doi: 10.1037/0033-295X.110.4.611. [DOI] [PubMed] [Google Scholar]
Associated Data
This section collects any data citations, data availability statements, or supplementary materials included in this article.