Abstract
Purpose: To retrospectively assess whether magnetic resonance (MR) imaging and MR spectroscopic imaging and selected molecular markers correlate with each other and with clinically insignificant and significant prostate cancer (PCa), as defined at surgical pathologic analysis.
Materials and Methods: The institutional review board approved this HIPAA-compliant study and waived informed consent. Eighty-nine men (mean age, 63 years; range, 46–79 years) with biopsy-proved PCa underwent combined endorectal MR imaging and MR spectroscopic imaging before radical prostatectomy. Suspicion of clinically insignificant PCa was retrospectively and separately recorded for MR imaging and combined MR imaging and MR spectroscopic imaging by using a scale of 0–3. Clinically insignificant PCa was pathologically defined as organ-confined cancer of 0.5 cm3 or less without poorly differentiated elements. Prostatectomy specimens underwent immunohistochemical analysis for three molecular markers: Ki-67, phospho-Akt (pAkt), and androgen receptor (AR). To examine differences in marker levels for clinically insignificant and significant cancer, a Wilcoxon rank sum test was used. To examine correlations between marker levels and MR imaging or combined MR imaging and MR spectroscopic imaging scores, the Spearman correlation was used.
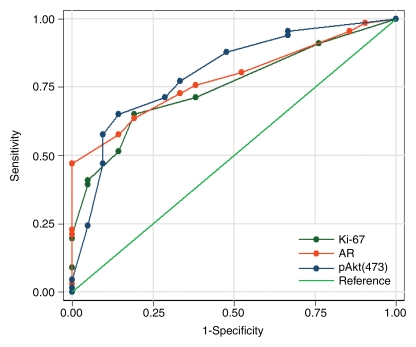
Results: Twenty-one (24%) patients had clinically insignificant and 68 (76%) had clinically significant PCa at surgical pathologic review. All markers were significantly correlated with MR imaging and combined MR imaging and MR spectroscopic imaging findings (all correlation coefficients >0.5). In differentiating clinically insignificant from clinically significant PCa, areas under the receiver operating characteristic curves for Ki-67, AR, pAkt, MR imaging, and combined MR imaging and MR spectroscopic imaging were 0.75, 0.78, 0.80, 0.85, and 0.91, respectively.
Conclusion: The use of pretreatment MR imaging or combined MR imaging and MR spectroscopic imaging and molecular marker analyses of biopsy samples could facilitate better treatment selection.
© RSNA, 2009
Prostate cancer (PCa) screening has led to increased detection of small-volume (≤0.5-cm3) low-grade (Gleason score, ≤6) organ-confined PCas (1). Many of these cancers have indolent histologic characteristics and are not destined to metastasize or otherwise threaten the life of the patient (1). A number of clinical nomograms are available for predicting whether a cancer is clinically insignificant or significant (2–9). The nomograms are used mainly to counsel men who are considering active surveillance rather than immediate therapy with curative intent (2–9). Recently, our group designed and tested the feasibility of applying new nomograms to predict the probability of clinically insignificant PCa on the basis of standard preoperative clinical variables (clinical stage, serum prostate-specific antigen [PSA] level) and biopsy data and findings from magnetic resonance (MR) imaging and MR spectroscopic imaging (10). The nomograms incorporating MR imaging findings proved to be significantly more accurate than the clinical nomograms (P < .001), although the results still need to be validated prospectively (10).
Better methods of discriminating between clinically insignificant and significant cancers are needed to further improve patient management. A trend toward increasing metabolic abnormality with higher Gleason scores has been found in PCa lesions identified correctly by using MR spectroscopic imaging (11). To gain insight into the relationship between cellular proliferation and the metabolic changes associated with the presence and aggressiveness of PCa, investigators correlated the proliferation marker Ki-67 with high-resolution MR metabolic imaging data; both the metabolic data and the mean staining index for Ki-67 differed significantly between benign and malignant tissues (P = .01) (12). Multiple PCa biomarkers have been assessed for their relationship to Gleason grade, clinical stage, and recurrence by using traditional immunohistochemical (IHC) methods or a systems pathology approach (13–32).
The purpose of our study was to retrospectively assess whether combined MR imaging and MR spectroscopic imaging and selected molecular markers correlate with each other and with clinically insignificant or significant PCa, as defined at surgical pathologic examination. Three specific markers were selected on the basis of their reported association with PCa progression: Ki-67, a proliferation marker; phospho-Akt (pAkt), a serine-threonine kinase critical to signal transduction pathways involved in cell proliferation, apoptosis, and angiogenesis; and androgen receptor (AR), the phosphoprotein that mediates the actions of male sex hormones by acting as a transcription factor and interacting with the phosphoinositide 3-kinase pathway (15,20,21,23–32).
MATERIALS AND METHODS
Patient Demographics
From November 1999 to March 2004, 592 patients with PCa were referred (P.T.S., with >30 years experience) from the urology department for MR imaging before radical prostatectomy. Of these, 363 patients underwent combined endorectal MR imaging and MR spectroscopic imaging. Of these, 89 (mean age, 63 years ± [standard deviation] 6.58; range, 46–79 years; PSA range, 2.6–76.8 ng/mL (2.6–76.8 μg/mL); biopsy Gleason score range, 6–9) gave informed consent for tissue collection and molecular marker studies according to an institutionally approved research protocol and were included in our study. All 89 patients had representative archived pathologic materials for IHC studies available. Our study was compliant with the Health Insurance Portability and Accountability Act; the review board approved and waived the informed consent requirement for our retrospective review of the MR and pathologic (presurgical biopsy and surgical pathologic) data. Patient data were collected and handled in accordance with institutional and federal guidelines.
Sixty-two patients in our study were included in a prior study (10) that analyzed patients' combined MR imaging and MR spectroscopic imaging findings with regard to the prediction of insignificant (ie, clinically insignificant) cancer but did not include molecular marker data.
MR Imaging Acquisition and Analysis
Endorectal MR and MR spectroscopic imaging were performed with a 1.5-T imager (Excite; GE Healthcare, Milwaukee, Wis). Patients were imaged by using a body coil for excitation and a pelvic four-channel phased-array coil combined with a commercially available balloon-covered expandable endorectal coil (ecoils; Medrad, Pittsburgh, Pa) for signal reception. Axial T1-weighted images (repetition time msec/echo time msec, 400–700/10–14; section thickness, 5 mm; intersection gap, 0 mm; field of view, 24–26 cm; matrix, 256 × 192), and axial, coronal, and sagittal T2-weighted fast spin-echo images (4400/(effective) 102; echo train length, 12; section thickness, 3 mm; intersection gap, 0 mm; field of view, 14 cm; matrix, 256 × 192) of the prostate and seminal vesicles were obtained. Image acquisition was followed by MR spectroscopic imaging with point-resolved spatial selection voxel excitation and band-selective inversion with gradient dephasing or spectral-spatial pulses for water and lipid suppression. Magnetic field homogeneity was optimized for the selected volume by using an automated shimming algorithm provided by the vendor. Further shimming was performed manually, if necessary, to further reduce the line width. Data sets were acquired as 16 × 8 × 8 phase-encoded spectral arrays (spatial resolution, 0.24–0.33 cm3) with 1000/130; and acquisition time, 17 minutes. The total examination time, including clinical imaging, was 1 hour. The MR spectroscopic imaging data were zero-filled in the superior-to-inferior direction to increase the likelihood of optimal alignment between spectroscopic voxels and the corresponding T2-weighted images. MR spectroscopic imaging data were overlaid on the T2-weighted images and the choline + creatine to citrate ([Cho + Cr]/Cit) ratios were calculated (33,34). The choline + creatine integration ranges contain the polyamine contribution, and the value of (Cho + Cr)/Cit reported in our study may be interpreted as (Cho + polyamine + Cr)/Cit, as has been described elsewhere (35).
MR imaging studies were retrospectively interpreted by a radiologist (H.H., with >10 years experience in prostate MR imaging); MR spectroscopic imaging data were analyzed by a physicist (A.S., with >5 years experience in prostate MR spectroscopic imaging). Both readers were blinded to clinical and pathologic findings. The suspicion of clinically insignificant PCa seen at MR imaging was conservatively set and scored by the radiologist for the whole gland by using the following scoring system: A score of 0 = definite clinically insignificant PCa (no regions with abnormal T2-weighted signal), a score of 1 = probable clinically insignificant PCa (nonnodular decreased T2-weighted signal <0.5 cm3), a score of 2 = indeterminate (nonnodular reduced T2-weighted signal >0.5 cm3 or nodular <0.5 cm3), and a score of 3 = definite clinically significant PCa (nodular reduced T2-weighted signal >0.5 cm3) (10). The physicist analyzed the imaging data by identifying suspicious voxels on the basis of (Cho + Cr)/Cit ratios, as previously described (34). The physicist estimated tumor volumes by multiplying the voxel size by the number of suspicious voxels. The MR spectroscopic readings were provided to the same radiologist who read the MR images, who then assigned an overall combined MR imaging and MR spectroscopic imaging score for the suspicion of clinically insignificant PCa in the whole gland, as seen at combined MR imaging and MR spectroscopic imaging, by using the following scoring system: A score of 0 = definite clinically insignificant PCa (no abnormality seen at MR and no suspicious volume seen at MR spectroscopy), a score of 1 = probable clinically insignificant PCa (total combined MR imaging and MR spectroscopic imaging suspicious volume <0.5 cm3), a score of 2 = indeterminate (total combined MR imaging and MR spectroscopic imaging suspicious volume = 0.5 cm3), and a score of three 3 = definite clinically significant PCa (combined MR imaging and MR spectroscopic imaging suspicious volume >0.5 cm3) (10).
Pathologic Analysis
Whole-mount axial serial step-sections of the prostate (3-mm intervals) were prepared as detailed previously (36). Clinically insignificant PCa was defined at pathologic review as tumor confined to the prostate, with a total volume of 0.5 cm3 or less in the whole gland, displaying no poorly differentiated elements. The volumes of the tumor foci were calculated by using computerized planimetry with image analysis software (Image-Pro Plus, version 4.0; Media Cybernetics, Bethesda, Md) and were summed to determine the total tumor volume (37,38). A Gleason score was also assigned for the whole gland. The pathologic maps and findings were reviewed by a uropathologist (V.E.R., with >10 years experience).
IHC Staining and Analysis
Tissue sections from prostatectomy specimens stained with hemotoxylin-eosin (H-E) were examined by two pathologists with experience in PCa analysis. The IHC staining was done by a pathologist (M.D., with >5 years experience) and the immunostaining analysis was done by a molecular pathologist (C.C., with >10 years experience in IHC analysis). The selected section assessed by using IHC staining contained either the index tumor at H-E staining, or, if the cancer was clinically insignificant and no index tumor could be identified, a representative tumor focus as judged by the molecular pathologist.
The histopathologic characteristics of each case were evaluated by molecular pathologists, who then, in consensus, selected one representative section and corresponding block for each case for the IHC studies. Well-characterized antibodies and corresponding final working concentrations were used (Appendix E1 [http://radiology.rsnajnls.org/cgi/content/full/250/3/803/DC1]) (15,20).
The immunophenotype of the lesions was rendered by scoring the percentage of positive tumor cells (17,28). An exclusively nuclear immunoreaction was considered as positive immunostaining for both AR and Ki-67, while pAkt immunostaining was predominantly cytoplasmic and occasionally nuclear. Immunostaining for Ki-67 is easily quantified. However, it is standard practice at our institution to calculate additional indexes for pAkt and AR. These indices were graded semi-quantitatively as the product of the percentage of cells stained and the staining intensity score. Staining intensity scores were assigned on a scale of 0–2 (0 = no or weak staining, 1 = moderate staining, and 2 = strong staining), and thus, the indices were graded on an overall scale of 0–200. The pathologist who performed the IHC analysis was blinded to clinical data, as well as to surgical pathologic results, until the completion of our study.
Statistical Analysis
To examine the correlation between the marker values and MR imaging or combined MR imaging and MR spectroscopic imaging scores, the Spearman correlation coefficient was used. To see how well each of the molecular markers and combined MR imaging and MR spectroscopic imaging scores could differentiate between clinically insignificant and significant PCas, we conducted a receiver operating characteristic (ROC) curve analysis and calculated the area under the ROC curve (AUC) and corresponding 95% confidence intervals (CIs) by using the methods described by Delong et al (39) and Pepe (40). To assess the incremental accuracy of combining marker values and MR imaging or combined MR imaging and MR spectroscopic imaging scores to differentiate between clinically significant and insignificant PCa, multivariate logistic regression was used. Only markers with a P value of less than .05 were considered to indicate significance. The AUC for the model was calculated and compared with the AUC for MR imaging or combined MR imaging and MR spectroscopic imaging alone. Analyses were performed by using software (Stata, version 9.0 for Windows, Stata, College Station, Tex; R for Windows, R Foundation for Statistical Computing, Vienna, Austria).
RESULTS
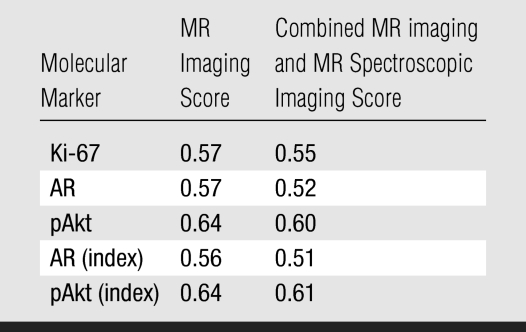
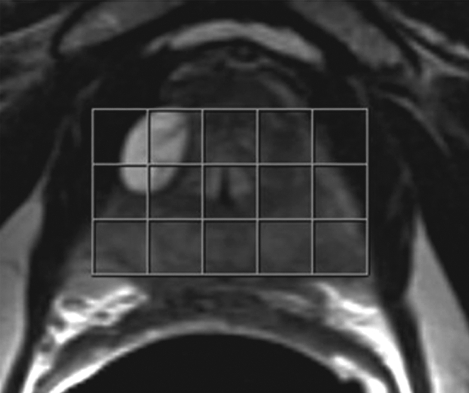
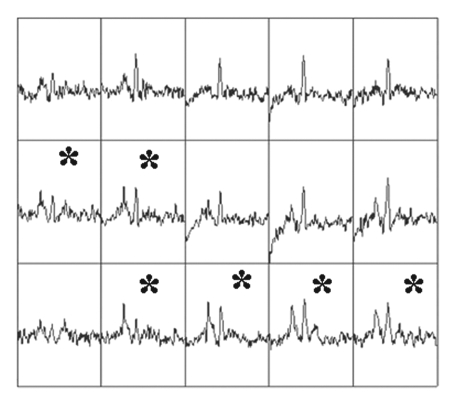
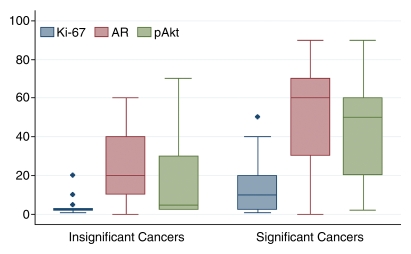
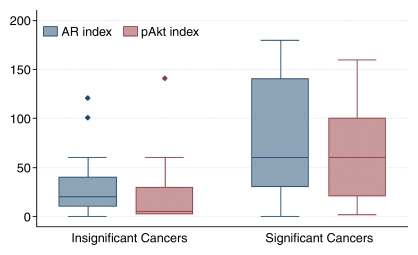
Surgical pathologic analysis identified 21 (24%) patients with clinically insignificant PCa and 68 (76%) patients with clinically significant PCa. The means and 95% CIs of molecular marker levels for clinically insignificant and significant cancers are shown in Table 1. The correlation coefficients for MR imaging and molecular markers ranged from 0.56 to 0.64, and the correlation coefficients for combined MR imaging and MR spectroscopic imaging and molecular markers ranged from 0.51 to 0.61 (all P < .0001) (Table 2). These numbers suggest that as MR imaging or combined MR imaging and MR spectroscopic imaging scores for clinical significance increased, so did the marker values. Figures 1 and 2 show MR data and IHC staining for patients with clinically insignificant and significant PCas. Figure 3 shows the medians and ranges of molecular marker expression levels for pathologically defined clinically insignificant and significant cancers.
Table 1.
Molecular Marker Expression Levels for Tumors Defined at Pathologic Review
Note.—Data are the mean; numbers in parentheses are the 95% confidence intervals.
Table 2.
Correlation between Molecular Marker Expression and MR Imaging and Combined MR imaging and MR Spectroscopic Imaging
Note.—Data are correlation coefficients. All P <.0001.
Figure 1a:
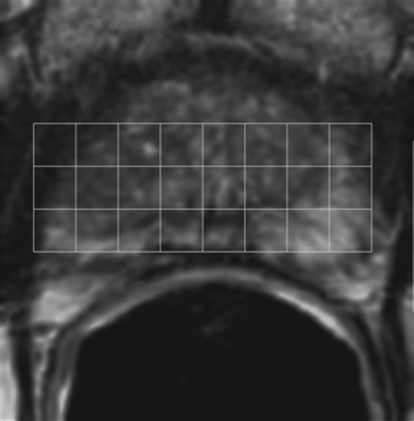
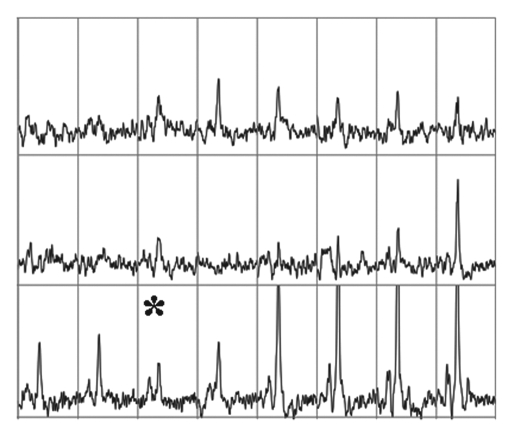
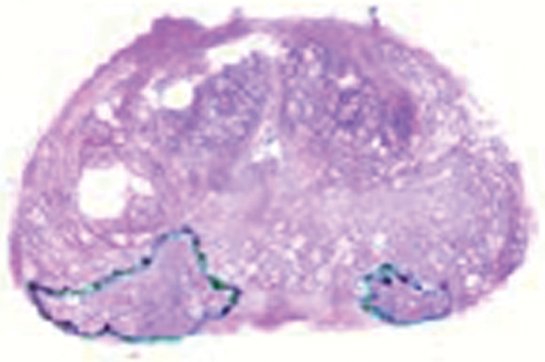
Imaging and pathologic data for 67-year-old patient with PSA level, 9.4 ng/mL (9.4 μg/mL); PCa stage, T2a; and biopsy Gleason score, 6; resulting in combined MR imaging and MR spectroscopic imaging score of 1 (probable insignificant cancer). (a) MR spectroscopic imaging (volume excitation with water and lipid suppression by means of spectral-spatial pulses; 1000/130; chemical shift imaging matrix, 16 × 8 × 8; field of view, 110 × 55 × 55 mm; spatial resolution, 6.9 mm; one signal acquired; and imaging time, 17 minutes) grid superimposed on transverse T2-weighted MR image (4000/102; echo train length, 12; field of view, 14 cm; acquisition matrix, 256 × 192; section thickness, 3 mm; no intersection gap; and four signals acquired). (b) Corresponding spectroscopic grid shows voxel (*) suspicious for cancer. (c) Histopathologic section shows Gleason score, 6 (solid line); total volume, 0.357 cm3 (clinically insignificant cancer). (d) IHC staining of prostatectomy specimens from tissue section shown in c for Ki-67 (left), pAkt (middle), and AR (right).
Figure 1b:
Imaging and pathologic data for 67-year-old patient with PSA level, 9.4 ng/mL (9.4 μg/mL); PCa stage, T2a; and biopsy Gleason score, 6; resulting in combined MR imaging and MR spectroscopic imaging score of 1 (probable insignificant cancer). (a) MR spectroscopic imaging (volume excitation with water and lipid suppression by means of spectral-spatial pulses; 1000/130; chemical shift imaging matrix, 16 × 8 × 8; field of view, 110 × 55 × 55 mm; spatial resolution, 6.9 mm; one signal acquired; and imaging time, 17 minutes) grid superimposed on transverse T2-weighted MR image (4000/102; echo train length, 12; field of view, 14 cm; acquisition matrix, 256 × 192; section thickness, 3 mm; no intersection gap; and four signals acquired). (b) Corresponding spectroscopic grid shows voxel (*) suspicious for cancer. (c) Histopathologic section shows Gleason score, 6 (solid line); total volume, 0.357 cm3 (clinically insignificant cancer). (d) IHC staining of prostatectomy specimens from tissue section shown in c for Ki-67 (left), pAkt (middle), and AR (right).
Figure 1c:
Imaging and pathologic data for 67-year-old patient with PSA level, 9.4 ng/mL (9.4 μg/mL); PCa stage, T2a; and biopsy Gleason score, 6; resulting in combined MR imaging and MR spectroscopic imaging score of 1 (probable insignificant cancer). (a) MR spectroscopic imaging (volume excitation with water and lipid suppression by means of spectral-spatial pulses; 1000/130; chemical shift imaging matrix, 16 × 8 × 8; field of view, 110 × 55 × 55 mm; spatial resolution, 6.9 mm; one signal acquired; and imaging time, 17 minutes) grid superimposed on transverse T2-weighted MR image (4000/102; echo train length, 12; field of view, 14 cm; acquisition matrix, 256 × 192; section thickness, 3 mm; no intersection gap; and four signals acquired). (b) Corresponding spectroscopic grid shows voxel (*) suspicious for cancer. (c) Histopathologic section shows Gleason score, 6 (solid line); total volume, 0.357 cm3 (clinically insignificant cancer). (d) IHC staining of prostatectomy specimens from tissue section shown in c for Ki-67 (left), pAkt (middle), and AR (right).
Figure 1d:
Imaging and pathologic data for 67-year-old patient with PSA level, 9.4 ng/mL (9.4 μg/mL); PCa stage, T2a; and biopsy Gleason score, 6; resulting in combined MR imaging and MR spectroscopic imaging score of 1 (probable insignificant cancer). (a) MR spectroscopic imaging (volume excitation with water and lipid suppression by means of spectral-spatial pulses; 1000/130; chemical shift imaging matrix, 16 × 8 × 8; field of view, 110 × 55 × 55 mm; spatial resolution, 6.9 mm; one signal acquired; and imaging time, 17 minutes) grid superimposed on transverse T2-weighted MR image (4000/102; echo train length, 12; field of view, 14 cm; acquisition matrix, 256 × 192; section thickness, 3 mm; no intersection gap; and four signals acquired). (b) Corresponding spectroscopic grid shows voxel (*) suspicious for cancer. (c) Histopathologic section shows Gleason score, 6 (solid line); total volume, 0.357 cm3 (clinically insignificant cancer). (d) IHC staining of prostatectomy specimens from tissue section shown in c for Ki-67 (left), pAkt (middle), and AR (right).
Figure 2a:
Imaging and pathologic data for 63-year-old patient with PSA level, 21.2 ng/mL (21.2 μg/mL); PCa stage, T2b; and biopsy Gleason score, 7; resulting in combined MR imaging and MR spectroscopic imaging score of 3 (definite clinically significant cancer). (a) MR spectroscopic imaging (volume excitation with water and lipid suppression by means of spectral-spatial pulses; 1000/130; chemical shift imaging matrix, 16 × 8 × 8; field of view, 110 × 55 × 55 mm; spatial resolution, 6.9 mm; one signal acquired; and imaging time, 17 minutes) grid superimposed on transverse T2-weighted MR image (4000/102; echo train length, 12; field of view, 14 cm; acquisition matrix, 256 × 192; section thickness, 3 mm; no intersection gap; and four signals acquired). (b) Corresponding spectroscopic grid shows voxels (*) suspicious for cancer. (c) Histopathologic section shows Gleason score, 7 (solid line); total volume, 8.892 cm3 (clinically significant cancer). (d) IHC staining of prostatectomy specimens from tissue section shown in c for Ki-67(left), pAkt (middle), and AR (right).
Figure 2b:
Imaging and pathologic data for 63-year-old patient with PSA level, 21.2 ng/mL (21.2 μg/mL); PCa stage, T2b; and biopsy Gleason score, 7; resulting in combined MR imaging and MR spectroscopic imaging score of 3 (definite clinically significant cancer). (a) MR spectroscopic imaging (volume excitation with water and lipid suppression by means of spectral-spatial pulses; 1000/130; chemical shift imaging matrix, 16 × 8 × 8; field of view, 110 × 55 × 55 mm; spatial resolution, 6.9 mm; one signal acquired; and imaging time, 17 minutes) grid superimposed on transverse T2-weighted MR image (4000/102; echo train length, 12; field of view, 14 cm; acquisition matrix, 256 × 192; section thickness, 3 mm; no intersection gap; and four signals acquired). (b) Corresponding spectroscopic grid shows voxels (*) suspicious for cancer. (c) Histopathologic section shows Gleason score, 7 (solid line); total volume, 8.892 cm3 (clinically significant cancer). (d) IHC staining of prostatectomy specimens from tissue section shown in c for Ki-67(left), pAkt (middle), and AR (right).
Figure 2c:

Imaging and pathologic data for 63-year-old patient with PSA level, 21.2 ng/mL (21.2 μg/mL); PCa stage, T2b; and biopsy Gleason score, 7; resulting in combined MR imaging and MR spectroscopic imaging score of 3 (definite clinically significant cancer). (a) MR spectroscopic imaging (volume excitation with water and lipid suppression by means of spectral-spatial pulses; 1000/130; chemical shift imaging matrix, 16 × 8 × 8; field of view, 110 × 55 × 55 mm; spatial resolution, 6.9 mm; one signal acquired; and imaging time, 17 minutes) grid superimposed on transverse T2-weighted MR image (4000/102; echo train length, 12; field of view, 14 cm; acquisition matrix, 256 × 192; section thickness, 3 mm; no intersection gap; and four signals acquired). (b) Corresponding spectroscopic grid shows voxels (*) suspicious for cancer. (c) Histopathologic section shows Gleason score, 7 (solid line); total volume, 8.892 cm3 (clinically significant cancer). (d) IHC staining of prostatectomy specimens from tissue section shown in c for Ki-67(left), pAkt (middle), and AR (right).
Figure 2d:
Imaging and pathologic data for 63-year-old patient with PSA level, 21.2 ng/mL (21.2 μg/mL); PCa stage, T2b; and biopsy Gleason score, 7; resulting in combined MR imaging and MR spectroscopic imaging score of 3 (definite clinically significant cancer). (a) MR spectroscopic imaging (volume excitation with water and lipid suppression by means of spectral-spatial pulses; 1000/130; chemical shift imaging matrix, 16 × 8 × 8; field of view, 110 × 55 × 55 mm; spatial resolution, 6.9 mm; one signal acquired; and imaging time, 17 minutes) grid superimposed on transverse T2-weighted MR image (4000/102; echo train length, 12; field of view, 14 cm; acquisition matrix, 256 × 192; section thickness, 3 mm; no intersection gap; and four signals acquired). (b) Corresponding spectroscopic grid shows voxels (*) suspicious for cancer. (c) Histopathologic section shows Gleason score, 7 (solid line); total volume, 8.892 cm3 (clinically significant cancer). (d) IHC staining of prostatectomy specimens from tissue section shown in c for Ki-67(left), pAkt (middle), and AR (right).
Figure 3a:
Box-and-whisker plots show median and range of molecular marker levels, expressed as (a) percentages or (b) indices, in clinically insignificant and significant cancer as defined at pathologic examination. Diamonds indicate outliers.
Figure 3b:
Box-and-whisker plots show median and range of molecular marker levels, expressed as (a) percentages or (b) indices, in clinically insignificant and significant cancer as defined at pathologic examination. Diamonds indicate outliers.
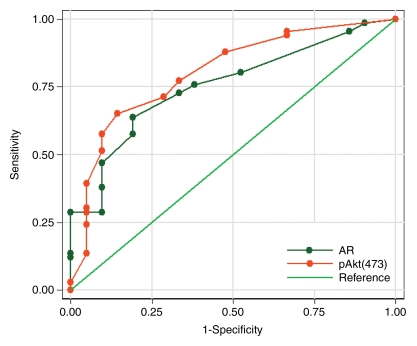
The ROC curves and corresponding AUCs for all three markers (Fig 4a), as well as for AR and pAkt indices (Fig 4b), indicated that they may be useful in differentiating between clinically insignificant and significant PCa. The AUCs were 0.75 (95% CI: 0.64, 0.85) for Ki-67, 0.78 (95% CI: 0.69, 0.88) for AR, 0.80 (95% CI: 0.69, 0.90) for pAkt, 0.76 (95% CI: 0.65, 0.86) for the AR index, and 0.80 (95% CI: 0.69, 0.91) for the pAkt index.
Figure 4a:
(a) Graph shows comparison of ROC curves for Ki-67, pAkt, and AR (expressed as percentages) in differentiating between clinically insignificant and significant PCas defined at pathologic examination; AUCs were 0.75, 0.80, and 0.78, respectively. (b) Graph shows comparison of ROC curves for pAkt and AR indices in differentiating between clinically insignificant and significant PCas defined at pathologic examination; AUCs were 0.80 and 0.76, respectively.
Figure 4b:
(a) Graph shows comparison of ROC curves for Ki-67, pAkt, and AR (expressed as percentages) in differentiating between clinically insignificant and significant PCas defined at pathologic examination; AUCs were 0.75, 0.80, and 0.78, respectively. (b) Graph shows comparison of ROC curves for pAkt and AR indices in differentiating between clinically insignificant and significant PCas defined at pathologic examination; AUCs were 0.80 and 0.76, respectively.
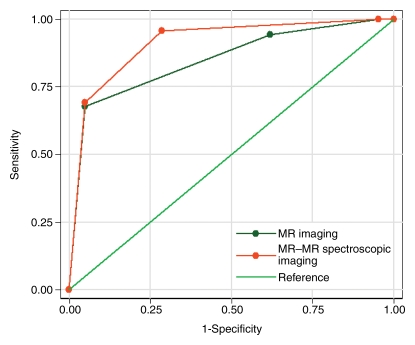
The AUC was 0.85 (95% CI: 0.77, 0.93) for the MR imaging scores and 0.91 (95% CI: 0.84, 0.98) for the combined MR imaging and MR spectroscopic imaging score (Fig 5), suggesting that both the MR imaging and the combined MR imaging and MR spectroscopic imaging scores are useful in differentiating between clinically insignificant and significant PCas. When combined MR imaging and MR spectroscopic imaging scores of 0 or 1 were considered to indicate clinically insignificant PCa, the sensitivity of combined MR imaging and MR spectroscopic imaging for identifying clinically insignificant PCa was 96% and the specificity was 71%.
Figure 5:
Graph shows comparison of ROC curves for MR imaging and combined MR imaging and MR spectroscopic imaging scores in differentiating between clinically insignificant and significant PCas defined at pathologic examination; AUC for MR imaging score was 0.85, AUC for combined MR imaging and MR spectroscopic imaging score was 0.91.
Analysis of the multivariate models showed that none of the molecular markers contributed significant incremental value to MR imaging or combined MR imaging and MR spectroscopic imaging scores in differentiating between clinically insignificant and significant PCa; the AUC was 0.80 (95% CI: 0.70, 0.90) for a model that incorporated all three markers. When MR imaging was added to this model, it yielded a significantly higher AUC of 0.87 (95% CI: 0.79, 0.95) (P = .025). A model that included all three markers and combined MR imaging and MR spectroscopic imaging yielded an AUC of 0.93 (95% CI: 0.87, 0.99), which was also significantly higher than the AUC for the model containing only the three markers (P = .001).
DISCUSSION
The performance of MR imaging and combined MR imaging and MR spectroscopic imaging in PCa detection and staging has improved over the last decade, mainly because of improved MR technology and acquisition techniques, refinement of the morphologic criteria for identifying extraprostatic disease, and increased reader experience (35,41–46). The use of MR spectroscopic imaging for the metabolic mapping of the prostate gland is gaining acceptance (41,43). Zakian et al (11) demonstrated a trend toward increasing metabolic abnormality ([Cho + Cr]/Cit) seen at MR spectroscopic imaging with increasing Gleason score. Coakley et al (47) found that in men with clinically localized PCa who selected watchful waiting, serial PSA levels correlated with findings of malignancy seen at serial combined MR imaging and MR spectroscopic imaging.
Our group recently designed new nomograms for predicting the probability of clinically insignificant PCa by using MR findings and clinical and biopsy data; we found that these nomograms performed significantly better than clinical nomograms (10). Combined MR imaging and MR spectroscopic imaging did well in helping identify either definite clinically insignificant or significant disease. However, there was a gray area (MR imaging or combined MR imaging and MR spectroscopic imaging score of 2: indeterminate), in which volume estimation was limited by confounding factors such as changes after biopsy and prostatitis, which may lead to false-positive findings (48–50). As MR techniques mature further, with newer applications and the use of higher-field-strength magnets that provide higher spatial and spectral resolution (51–53), it may become possible to stratify cancers currently designated as indeterminate to either the definite clinically insignificant or significant category.
It has been hypothesized that tumorigenesis involves an increased cellular proliferation rate, and tumors with a high proliferative fraction may increase in volume and metastasize more rapidly (21,28,31). The monoclonal antibody MIB-1 recognizes the Ki-67 antigen, reported to identify cells in the active cycling phases of the cell cycle (G1, S, G2, and M). Earlier studies showed that Ki-67 expression is related to stage, grade, survival, and biochemical recurrence after radical prostatectomy (21,25,26,28). One study (12) found that data from high-resolution magic-angle spinning MR spectroscopy could be used to differentiate between benign and malignant prostate tissue and that IHC staining for Ki-67 correlated with elevated choline in PCa (P = .01). In our study, the expression of Ki-67 correlated with both MR imaging and combined MR imaging and MR spectroscopic imaging findings for clinically insignificant and significant PCa.
Activated phosphoinositide 3-kinase and its downstream target, Akt or protein kinase B, are important signaling molecules and key survival factors in the control of cell proliferation, apoptosis, and oncogenesis (21,24,28–32). We have previously reported that Akt signaling by means of mTOR and eIF4E proteins is an important mechanism of oncogenesis and drug resistance in vivo (32). Malik et al (23) found a higher level of pAkt expression in cancers with Gleason scores of 8–10 than in cancers with lower scores. Shimizu et al (28) recently investigated the relationship between the expression of pAkt, AR, and Ki-67 (the same molecular markers used in our study) in Japanese men and showed that increased expression of pAkt was associated with higher tumor grades, as well as higher AR staining scores and Ki-67 expression.
The AR is a nuclear transcription factor that mediates the actions of many steroidal hormones (13–15,21,25,28). AR staining is seen predominantly in the nuclei of both epithelial and stromal cells in the normal prostate. Neoplastic areas tend to have an intermingling of AR-positive and AR-negative cells. Sadi and Barrack (54) showed that variability of AR protein expression in PCa metastases correlated with poor response to hormonal therapy. Our other data on AR have shown an association between high levels of AR and a shortened time to increase in PSA level after androgen deprivation theraphy, as well as an association between IHC staining for AR in tumor epithelial cells and a shorter time to biochemical recurrence (15). The data in our study show that clinically insignificant PCas have lower levels of AR expression, as well as MR imaging or combined MR imaging and MR spectroscopic imaging scores of 0 or 1; this study and a previous one have shown that tumors seen as low–signal intensity nodular areas on T2-weighted images that have metabolic abnormality on MR spectroscopic images are clinically significant and should be managed accordingly (10). However, a lack of abnormalities in the gland seen at both MR and MR spectroscopic imaging is an indication that a tumor, if present, is likely to be clinically insignificant (10).
Our study had several limitations, including the fact that it was retrospective. To determine the utility of IHC and MR imaging for pretreatment assessment of disease, it would have been more appropriate to perform the IHC studies on biopsy samples instead of prostatectomy specimens. However, more than 90% of the patients in our study underwent biopsy performed outside our institution, and tissue was not available for detailed pathologic study. Nevertheless, the study design was adequate for achieving the study's main goal, which was to determine whether imaging findings and molecular marker values correlate with each other and with clinically insignificant and significant PCas defined at pathologic examination. It should also be kept in mind that the radiologist and the physicist who interpreted the MR and MR spectroscopic imaging data in our study both had considerable experience in prostate imaging. Prior studies have shown that experience and training can have a substantial effect on the accuracy of radiologists' interpretations (55,56). With a less experienced radiologist and/or a larger sample size, we might have found that molecular markers contributed incremental value in differentiating between clinically insignificant and significant PCas seen at imaging. Finally, there was verification bias in this study, as the decision to proceed to radical prostatectomy may depend in part on the results of the combined MR imaging and MR spectroscopic imaging.
We would like to emphasize that two of our methods of cancer assessment were determined on the basis of evaluation of the entire prostate (step-section pathologic examination with H-E staining and combined MR imaging and MR spectroscopic imaging), and one of our methods (IHC staining for molecular markers) was determined on the basis of a representative sample of the gland (ie, a single tissue section from the prostatectomy specimen). The selected section assessed by using IHC staining contained either the index tumor on H-E staining, or, if the cancer was clinically insignificant and no index tumor could be identified, a representative tumor focus as judged by the molecular pathologist. Another limitation of our study was that we do not know for certain whether the specific tumors assessed by using IHC were actually identified at imaging. In some cases of clinically insignificant cancer, minute lesions seen at H-E staining were not visible at MR imaging, but as Figures 1 and 2 suggest, index lesions assessed at IHC staining were probably identified at imaging.
Regardless of whether the tumors assessed at IHC staining were the same ones seen at imaging, our data demonstrated that as the MR imaging score for the whole gland increased, so did molecular marker expression in the representative tumor lesion assessed. Our study was not about assessing tumor localization by using MR imaging or combined MR imaging and MR spectroscopic imaging; rather, it concerned the capacity of MR to help make an overall assessment of clinically insignificant or significant cancer.
In our study we assessed markers that are important in proliferation, apoptosis, and cell survival. We confirmed that these markers correlate with clinically insignificant PCas identified by using MR imaging or combined MR imaging and MR spectroscopic imaging—something that has not been shown before, to our knowledge. We believe that we are at the beginning of a new era where imaging and pathologic examination can provide more than just tumor detection and grading. In future prospective studies with larger patient populations, the selected markers should be evaluated in the biopsy tissue, as they may provide pretreatment quantitative data on the biologic properties of the tumor.
In conclusion, we demonstrated that combined MR imaging and MR spectroscopic imaging findings and Ki-67, pAkt, and AR values correlated with each other and with clinically insignificant and significant PCa defined at pathologic examination. These results suggest that pretreatment MR imaging or combined MR imaging and MR spectroscopic imaging findings and molecular marker analysis of biopsy samples could help differentiate between clinically insignificant and significant cancers and favorably affect treatment selection.
ADVANCES IN KNOWLEDGE
Combined MR imaging and MR spectroscopic imaging findings for clinically insignificant or significant prostate cancer (PCa) correlated with Ki-67, phospho-Akt (pAkt), and androgen receptor (AR) values.
In differentiating between clinically insignificant and significant PCas, the areas under the receiver operating characteristic curves for Ki-67, AR, pAkt, MR imaging, and combined MR imaging and MR spectroscopic imaging were 0.75, 0.78, 0.80, 0.85, and 0.91, respectively.
IMPLICATION FOR PATIENT CARE
The use of pretreatment MR imaging or combined MR imaging and MR spectroscopic imaging and molecular marker analysis of biopsy samples could favorably affect treatment selection for patients with PCa.
Supplementary Material
Acknowledgments
The authors thank Ada Muellner, BA, Department of Radiology, Memorial Sloan-Kettering Cancer Center, for editing the manuscript.
Abbreviations
AR = androgen receptor
AUC = area under the ROC curve
CI = confidence interval
H-E = hematoxylin-eosin
IHC = immunohistochemical
pAkt = phospho-Akt
PCa = prostate cancer
PSA = prostate-specific antigen
ROC = receiver operating characteristic
Author contributions: Guarantor of integrity of entire study, A.S.; study concepts/study design or data acquisition or data analysis/interpretation, all authors; manuscript drafting or manuscript revision for important intellectual content, all authors; approval of final version of submitted manuscript, all authors; literature research, A.S., C.C.; clinical studies, A.S., H.H., V.E.R., K.L.Z., P.T.S.; experimental studies, M.D., C.C.; statistical analysis, N.M.I., C.S.M.; and manuscript editing, A.S., H.H., V.E.R., K.L.Z., P.T.S., C.C.
Authors stated no financial relationship to disclose.
Funding: This research was supported by the National Institutes of Health (grant no. R01 CA76423) and the National Cancer Institute Specialized Program of Research Excellence in Prostate Cancer (grant no. CA92629).
References
- 1.Klein EA. What is ‘insignificant’ prostate carcinoma? Cancer 2004;101:1923–1925. [DOI] [PubMed] [Google Scholar]
- 2.Carter HB, Sauvageot J, Walsh PC, Epstein JI. Prospective evaluation of men with stage T1C adenocarcinoma of the prostate. J Urol 1997;157:2206–2209. [PMC free article] [PubMed] [Google Scholar]
- 3.Epstein JI, Chan DW, Sokoll LJ, et al. Nonpalpable stage T1c prostate cancer: prediction of insignificant disease using free/total prostate specific antigen levels and needle biopsy findings. J Urol 1998;160:2407. [PubMed] [Google Scholar]
- 4.Epstein JI, Sanderson H, Carter HB, Scharfstein DO. Utility of saturation biopsy to predict insignificant cancer at radical prostatectomy. Urology 2005;66:356–360. [DOI] [PubMed] [Google Scholar]
- 5.Epstein JI, Walsh PC, Carmichael M, Brendler CB. Pathologic and clinical findings to predict tumor extent of nonpalpable (stage T1c) prostate cancer. JAMA 1994;271:368–374. [PubMed] [Google Scholar]
- 6.Goto Y, Ohori M, Arakawa A, Kattan MW, Wheeler TM, Scardino PT. Distinguishing clinically important from unimportant prostate cancers before treatment: value of systematic biopsies. J Urol 1996;156:1059–1063. [PubMed] [Google Scholar]
- 7.Kattan MW, Eastham JA, Wheeler TM, et al. Counseling men with prostate cancer: a nomogram for predicting the presence of small, moderately differentiated, confined tumors. J Urol 2003;170:1792–1797. [DOI] [PubMed] [Google Scholar]
- 8.Partin AW, Kattan MW, Subong EN, et al. Combination of prostate-specific antigen, clinical stage, and Gleason score to predict pathological stage of localized prostate cancer: a multi-institutional update. JAMA 1997;277:1445–1451. [PubMed] [Google Scholar]
- 9.Steyerberg EW, Roobol MJ, Kattan MW, van der Kwast TH, de Koning HJ, Schroder FH. Prediction of indolent prostate cancer: validation and updating of a prognostic nomogram. J Urol 2007;177:107–112. [DOI] [PubMed] [Google Scholar]
- 10.Shukla-Dave A, Hricak H, Kattan MW, et al. The utility of magnetic resonance imaging and spectroscopy for predicting insignificant prostate cancer: an initial analysis. BJU Int 2007;99:786–793. [DOI] [PubMed] [Google Scholar]
- 11.Zakian KL, Sircar K, Hricak H, et al. Correlation of proton MR spectroscopic imaging with Gleason score based on step-section pathologic analysis after radical prostatectomy. Radiology 2005;234:804–814. [DOI] [PubMed] [Google Scholar]
- 12.Swanson MG, Vigneron DB, Tabatabai ZL, et al. Proton HR-MAS spectroscopy and quantitative pathologic analysis of MRI/3D-MRSI-targeted postsurgical prostate tissues. Magn Reson Med 2003;50:944–954. [DOI] [PubMed] [Google Scholar]
- 13.Boddy JL, Fox SB, Han C, et al. The androgen receptor is significantly associated with vascular endothelial growth factor and hypoxia sensing via hypoxia-inducible factors HIF-1a, HIF-2a, and the prolyl hydroxylases in human prostate cancer. Clin Cancer Res 2005;11:7658–7663. [DOI] [PubMed] [Google Scholar]
- 14.Burnstein KL. Regulation of androgen receptor levels: implications for prostate cancer progression and therapy. J Cell Biochem 2005;95:657–669. [DOI] [PubMed] [Google Scholar]
- 15.Cordon-Cardo C, Kotsianti A, Verbel DA, et al. Improved prediction of prostate cancer recurrence through systems pathology. J Clin Invest 2007;117:1876–1883. [DOI] [PMC free article] [PubMed] [Google Scholar]
- 16.de la Taille A, Buttyan R, Benson MC, Katz AE. The role of tumor biomarkers as predictors of serum PSA recurrence after radical prostatectomy. Semin Urol Oncol 1998;16:137–144. [PubMed] [Google Scholar]
- 17.Drobnjak M, Melamed J, Taneja S, et al. Altered expression of p27 and Skp2 proteins in prostate cancer of African-American patients. Clin Cancer Res 2003;9:2613–2619. [PubMed] [Google Scholar]
- 18.Epstein JI. What's new in prostate cancer disease assessment in 2006? Curr Opin Urol 2006;16:146–151. [DOI] [PubMed] [Google Scholar]
- 19.Herawi M, Epstein JI. Immunohistochemical antibody cocktail staining (p63/HMWCK/AMACR) of ductal adenocarcinoma and Gleason pattern 4 cribriform and noncribriform acinar adenocarcinomas of the prostate. Am J Surg Pathol 2007;31:889–894. [DOI] [PubMed] [Google Scholar]
- 20.Hernando E, Charytonowicz E, Dudas ME, et al. The AKT-mTOR pathway plays a critical role in the development of leiomyosarcomas. Nat Med 2007;13:748–753. [DOI] [PubMed] [Google Scholar]
- 21.Kumar-Sinha C, Chinnaiyan AM. Molecular markers to identify patients at risk for recurrence after primary treatment for prostate cancer. Urology 2003;62(suppl 1):19–35. [DOI] [PubMed] [Google Scholar]
- 22.Kurek R, Nunez G, Tselis N, et al. Prognostic value of combined “triple”-reverse transcription-PCR analysis for prostate-specific antigen, human kallikrein 2, and prostate-specific membrane antigen mRNA in peripheral blood and lymph nodes of prostate cancer patients. Clin Cancer Res 2004;10:5808–5814. [DOI] [PubMed] [Google Scholar]
- 23.Malik SN, Brattain M, Ghosh PM, et al. Immunohistochemical demonstration of phospho-Akt in high Gleason grade prostate cancer. Clin Cancer Res 2002;8:1168–1171. [PubMed] [Google Scholar]
- 24.Plas DR, Thompson CB. Akt-dependent transformation: there is more to growth than just surviving. Oncogene 2005;24:7435–7442. [DOI] [PubMed] [Google Scholar]
- 25.Quinn DI, Henshall SM, Sutherland RL. Molecular markers of prostate cancer outcome. Eur J Cancer 2005;41:858–887. [DOI] [PubMed] [Google Scholar]
- 26.Rubio J, Ramos D, Lopez-Guerrero JA, et al. Immunohistochemical expression of Ki-67 antigen, cox-2 and Bax/Bcl-2 in prostate cancer: prognostic value in biopsies and radical prostatectomy specimens. Eur Urol 2005;48:745–751. [DOI] [PubMed] [Google Scholar]
- 27.Saidi O, Cordon-Cardo C, Costa J. Technology insight: will systems pathology replace the pathologist? Nat Clin Pract Urol 2007;4:39–45. [DOI] [PubMed] [Google Scholar]
- 28.Shimizu Y, Segawa T, Inoue T, et al. Increased Akt and phosphorylated Akt expression are associated with malignant biological features of prostate cancer in Japanese men. BJU Int 2007;100:685–690. [DOI] [PubMed] [Google Scholar]
- 29.Teo K, Gemmell L, Mukherjee R, Traynor P, Edwards J. Bad expression influences time to androgen escape in prostate cancer. BJU Int 2007;100:691–696. [DOI] [PubMed] [Google Scholar]
- 30.Trotman LC, Alimonti A, Scaglioni PP, Koutcher JA, Cordon-Cardo C, Pandolfi PP. Identification of a tumour suppressor network opposing nuclear Akt function. Nature 2006;441:523–527. [DOI] [PMC free article] [PubMed] [Google Scholar]
- 31.Troyer DA, Mubiru J, Leach RJ, Naylor SL. Promise and challenge: markers of prostate cancer detection, diagnosis and prognosis. Dis Markers 2004;20:117–128. [DOI] [PMC free article] [PubMed] [Google Scholar]
- 32.Wendel HG, De Stanchina E, Fridman JS, et al. Survival signalling by Akt and eIF4E in oncogenesis and cancer therapy. Nature 2004;428:332–337. [DOI] [PubMed] [Google Scholar]
- 33.Kurhanewicz J, Vigneron DB, Hricak H, Narayan P, Carroll P, Nelson SJ. Three-dimensional H-1 MR spectroscopic imaging of the in situ human prostate with high (0.24–0.7-cm3) spatial resolution. Radiology 1996;198:795–805. [DOI] [PubMed] [Google Scholar]
- 34.Males RG, Vigneron DB, Star-Lack J, et al. Clinical application of BASING and spectral/spatial water and lipid suppression pulses for prostate cancer staging and localization by in vivo 3D 1H magnetic resonance spectroscopic imaging. Magn Reson Med 2000;43:17–22. [DOI] [PubMed] [Google Scholar]
- 35.Pels P, Ozturk-Isik E, Swanson MG, et al. Quantification of prostate MRSI data by model-based time domain fitting and frequency domain analysis. NMR Biomed 2006;19:188–197. [DOI] [PubMed] [Google Scholar]
- 36.Aihara M, Wheeler TM, Ohori M, Scardino PT. Heterogeneity of prostate cancer in radical prostatectomy specimens. Urology 1994;43:60–67. [DOI] [PubMed] [Google Scholar]
- 37.Ohori M, Wheeler TM, Dunn JK, Stamey TA, Scardino PT. The pathological features and prognosis of prostate cancer detectable with current diagnostic tests. J Urol 1994;152:1714–1720. [DOI] [PubMed] [Google Scholar]
- 38.Villers A, McNeal JE, Freiha FS, Stamey TA. Multiple cancers in the prostate. Morphologic features of clinically recognized versus incidental tumors. Cancer 1992;70:2313–2318. [DOI] [PubMed] [Google Scholar]
- 39.Delong ER, Delong DM, Clarke-Pearson DL. Comapring the areas under two or more correlated receiver opertaing curves: a non parametric approach. Biometrics 1988;44:837–845. [PubMed] [Google Scholar]
- 40.Pepe MS. The statistical evaluation of medical tests for classification and prediction. Oxford, England: Oxford University Press, 2003; 67–79.
- 41.Carroll PR, Coakley FV, Kurhanewicz J. Magnetic resonance imaging and spectroscopy of prostate cancer. Rev Urol 2006;8(suppl 1):S4–S10. [PMC free article] [PubMed] [Google Scholar]
- 42.Futterer JJ, Scheenen TW, Heijmink SW, et al. Standardized threshold approach using three-dimensional proton magnetic resonance spectroscopic imaging in prostate cancer localization of the entire prostate. Invest Radiol 2007;42:116–122. [DOI] [PubMed] [Google Scholar]
- 43.Hricak H. MR imaging and MR spectroscopic imaging in the pre-treatment evaluation of prostate cancer. Br J Radiol 2005;78(suppl 2):S103–S111. [DOI] [PubMed] [Google Scholar]
- 44.Hricak H. New horizons in genitourinary oncologic imaging. Abdom Imaging 2006;31:182–187. [DOI] [PubMed] [Google Scholar]
- 45.Hricak H, Wang L, Wei DC, et al. The role of preoperative endorectal magnetic resonance imaging in the decision regarding whether to preserve or resect neurovascular bundles during radical retropubic prostatectomy. Cancer 2004;100:2655–2663. [DOI] [PubMed] [Google Scholar]
- 46.Jung JA, Coakley FV, Vigneron DB, et al. Prostate depiction at endorectal MR spectroscopic imaging: investigation of a standardized evaluation system. Radiology 2004;233:701–708. [DOI] [PubMed] [Google Scholar]
- 47.Coakley FV, Chen I, Qayyum A, et al. Validity of prostate-specific antigen as a tumour marker in men with prostate cancer managed by watchful-waiting: correlation with findings at serial endorectal magnetic resonance imaging and spectroscopic imaging. BJU Int 2007;99:41–45. [DOI] [PubMed] [Google Scholar]
- 48.Coakley FV, Kurhanewicz J, Lu Y, et al. Prostate cancer tumor volume: measurement with endorectal MR and MR spectroscopic imaging. Radiology 2002;223:91–97. [DOI] [PubMed] [Google Scholar]
- 49.Qayyum A, Coakley FV, Lu Y, et al. Organ-confined prostate cancer: effect of prior transrectal biopsy on endorectal MRI and MR spectroscopic imaging. AJR Am J Roentgenol 2004;183:1079–1083. [DOI] [PubMed] [Google Scholar]
- 50.Shukla-Dave A, Hricak H, Eberhardt SC, et al. Chronic prostatitis: MR imaging and 1H MR spectroscopic imaging findings—initial observations. Radiology 2004;231:717–724. [DOI] [PubMed] [Google Scholar]
- 51.Chen AP, Cunningham CH, Kurhanewicz J, et al. High-resolution 3D MR spectroscopic imaging of the prostate at 3 T with the MLEV-PRESS sequence. Magn Reson Imaging 2006;24:825–832. [DOI] [PubMed] [Google Scholar]
- 52.Cunningham CH, Vigneron DB, Marjanska M, et al. Sequence design for magnetic resonance spectroscopic imaging of prostate cancer at 3 T. Magn Reson Med 2005;53:1033–1039. [DOI] [PubMed] [Google Scholar]
- 53.Scheenen TW, Gambarota G, Weiland E, et al. Optimal timing for in vivo 1H-MR spectroscopic imaging of the human prostate at 3T. Magn Reson Med 2005;53:1268–1274. [DOI] [PubMed] [Google Scholar]
- 54.Sadi MV, Barrack ER. Androgen receptors and growth fraction in metastatic prostate cancer as predictors of time to tumour progression after hormonal therapy. Cancer Surv 1991;11:195–215. [PubMed] [Google Scholar]
- 55.Yu KK, Scheidler J, Hricak H, et al. Prostate cancer: prediction of extracapsular extension with endorectal MR imaging and three-dimensional proton MR spectroscopic imaging. Radiology 1999;213:481–488. [DOI] [PubMed] [Google Scholar]
- 56.Mullerad M, Hricak H, Wang L, Chen HN, Kattan MW, Scardino PT. Prostate cancer: detection of extracapsular extension by genitourinary and general body radiologists at MR imaging. Radiology 2004;232:140–146. [DOI] [PubMed] [Google Scholar]
Associated Data
This section collects any data citations, data availability statements, or supplementary materials included in this article.


