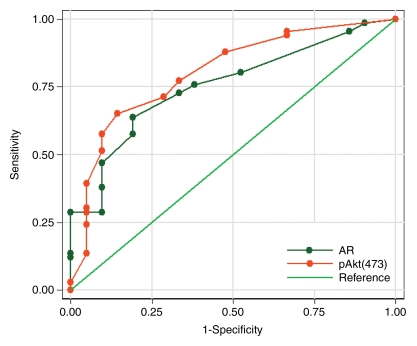
Figure 4b:
(a) Graph shows comparison of ROC curves for Ki-67, pAkt, and AR (expressed as percentages) in differentiating between clinically insignificant and significant PCas defined at pathologic examination; AUCs were 0.75, 0.80, and 0.78, respectively. (b) Graph shows comparison of ROC curves for pAkt and AR indices in differentiating between clinically insignificant and significant PCas defined at pathologic examination; AUCs were 0.80 and 0.76, respectively.

