Abstract
Purpose: To evaluate the risk of cancer (positive predictive value [PPV]) associated with specific findings (mass, calcifications, architectural distortion, asymmetry) in mammographic examinations with abnormal results, to determine the distribution of these findings in examinations in which the patients received a diagnosis of cancer and examinations in which the patients did not, and to analyze PPV variation according to radiologist and patient factors.
Materials and Methods: HIPAA-compliant institutional review board approval was obtained. PPV of mammographic findings was evaluated in a prospective cohort of 10 262 women who underwent 10 641 screening or diagnostic mammographic examinations with abnormal results between January 1998 and December 2002 in the San Francisco Mammography Registry. The cohort was linked with the Surveillance Epidemiology and End Results program to determine cancer status among these women. PPVs were calculated for each finding and were stratified according to patient characteristics, cancer type, and radiologist reader.
Results: Cases of breast cancer (n = 1552) were identified (invasive, n = 1287; ductal carcinoma in situ, n = 270); in five, both kinds of breast cancer were recorded. Overall, of the number of interpretations, masses were most frequently noted in 56%, followed by calcifications in 29%, asymmetry in 12%, and architectural distortion in 4%. Masses, calcifications, architectural distortion, and developing asymmetry demonstrated similar PPVs in screening examinations (9.7%, 12.7%, 10.2%, and 7.4%, respectively), whereas one-view-only and focal asymmetry demonstrated lower PPVs (3.6% and 3.7%, respectively) and were a frequent reason for an abnormal result (42%). Overall, one (5%) in 20 invasive cancers was identified with asymmetry, one (6%) in 16 invasive cancers was identified with architectural distortion, one (21%) in five invasive cancers was identified with calcifications, and two (68%) in three invasive cancers were identified with a mass.
Conclusion: Five percent of invasive cancers were identified with asymmetry, and asymmetry is more weakly associated with cancer in screening examinations than are mass, calcifications, and architectural distortion.
© RSNA, 2009
Mammography is the standard of care in breast cancer screening and has led to a reduction in breast cancer mortality (1,2). However, mammography is imprecise; not all cancers are detected with mammography, and many women without cancer have abnormal mammographic results that lead to additional testing. Clinically occult early-stage cancer often is similar in appearance to a benign breast lesion, and the absolute number of false-positive examination results is more than 10-fold higher than true-positive examination results (3). When mammographic findings that may be associated with breast cancer are identified at screening mammography (eg, masses, calcifications, architectural distortion, and asymmetry), the examination results are classified as abnormal, and further diagnostic work-up is required. The accuracy of mammography is directly related to the prevalence and positive predictive values (PPVs) of mammographic findings. Identifying findings with very high or low PPVs may lead to improved diagnostic algorithms and, thereby, improved mammographic accuracy, while also enabling clinicians and patients to better predict the likelihood of cancer prior to biopsy.
The frequencies and PPVs of mammographic findings have not been well described. Investigators in most prior studies have not comprehensively assessed cancer outcomes, for they assessed cancer status only in patients who underwent biopsy, which led to so-called verification bias, and, thus, they less accurately characterized the predictive value of mammographic findings compared with tumor registry linkage (4–14). In addition, most prior studies were single center based, and, thus, they may have yielded nongeneralizable results. Researchers in some published studies analyzed nonpalpable lesions only and did not clearly separate screening and diagnostic examinations (9,10,13). Finally, investigators in no previous studies assessed the risk of invasive cancer versus ductal carcinoma in situ (DCIS).
We conducted a retrospective analysis of the PPV associated with specific prospectively recorded mammographic findings in screening and diagnostic mammographic examinations by using data from the San Francisco Mammography Registry (SFMR). The aim of the study was to evaluate the risk of cancer (PPV) associated with specific findings (mass, calcifications, architectural distortion, asymmetry) in mammographic examinations with abnormal results, to determine the distribution of these findings in examinations in which the patients received a diagnosis of cancer and examinations in which the patients did not, and to analyze PPV variation according to radiologist and patient factors.
MATERIALS AND METHODS
Study Design and Population
The SFMR is a population-based consortium of 20 mammography facilities in the San Francisco Bay Area, and is one of the National Cancer Institute–funded registries comprising the Breast Cancer Surveillance Consortium. Seven sites in the SFMR routinely record mammographic findings, on average exhibiting a 40%–60% finding reporting rate. All screening and diagnostic mammographic examination results (n = 329 064) obtained at these seven sites between January 1, 1998, and December 31, 2002, were included. Both the screening and diagnostic mammographic examination results in patients who were recalled on the basis of screening examination results were included in this analysis. To understand the cancer risk of specific findings, we limited our analysis to all examination results interpreted as abnormal (defined as having a Breast Imaging Reporting and Data System [BI-RADS] overall assessment of category 0, category 3 with a recommendation for immediate further assessment, category 4, or category 5) for which a specific mammographic finding was recorded. Mammographic examination results in women with a self-reported or documented history of breast cancer or breast reduction (n = 2611) were excluded. University of California, San Francisco (San Francisco, Calif), Institutional Review Board approval was obtained to collect and analyze data, with Health Insurance Portability and Accountability Act compliance.
Patient Variables
Demographic information and a self-reported breast health history were collected at each mammographic examination. All variables were defined prior to data analysis. Women were characterized as white (non-Hispanic whites), African American (non-Hispanic African Americans), Hispanic, Asian (including Hawaiian natives and Pacific islanders), or Native American (including Alaskan natives). Examinations were considered screening or diagnostic on the basis of the indication for the examination recorded by the radiologist at interpretation; billing codes were not used. Diagnostic examinations were initially classified by using the indication (symptom evaluation vs follow-up to imaging with abnormal findings) but later were combined into one diagnostic category because of similar results. Screening cycle was assigned as first or subsequent. Symptoms were self reported. If a woman had at least one first-degree relative who received a diagnosis of breast cancer at an age younger than 50 years, she was considered to have a family history of breast cancer. If a woman previously underwent a surgical or core biopsy, she was considered to have a history of biopsy.
Mammographic Interpretation
For each examination, one of 46 radiologists prospectively recorded the mammographic examination type (screening or diagnostic), breast density, overall BI-RADS assessment, and the specific findings requiring further diagnostic work-up. Sonography did not influence screening BI-RADS assessment but could influence the final assessment for diagnostic examinations. We initially examined four Breast Cancer Surveillance Consortium–recorded findings: mass, calcifications, architectural distortion, and asymmetry. The term asymmetry was used to describe asymmetry subtypes overall. Because the SFMR reporting system includes three asymmetry subtypes (one-view-only asymmetry, focal asymmetry, and developing asymmetry), we also performed a subgroup analysis to characterize the PPVs of the subtypes of asymmetry at the six study sites that reported these findings. One-view-only asymmetry was defined as density in the third edition of the BI-RADS lexicon (15) or as asymmetry in the fourth edition of the BI-RADS lexicon (16). Focal asymmetry was defined as focal asymmetry in the fourth edition of the BI-RADS lexicon or as focal asymmetric density in the third edition of the BI-RADS lexicon. Developing asymmetry is not specifically described in the BI-RADS lexicon but has been described in previous articles as developing density, a term well known to most practicing radiologists. We updated this term to developing asymmetry to be consistent with information in a more recent article by Leung and Sickles (17). In November 2003, all participating radiologists received updated information in regard to changes in BI-RADS terminology for asymmetry.
Cancer Assessment
Cancer was defined as a diagnosis of DCIS (International Classification of Diseases for Oncology, second edition, morphology codes 85002 or 85222) or of invasive cancer (International Classification of Diseases for Oncology, second edition, morphology codes with the last digit of three and primary site code of C50) within 12 months of a mammographic examination, as determined through linkage with the regional Surveillance Epidemiology and End Results program and the California Cancer Registry. Per cancer registry protocol, co-occurring invasive cancer and DCIS were recorded as invasive cancer only. Previous research showed cancer ascertainment to be at least 95% complete (18). We identified 1781 cancer-linked mammographic examination results, with 326 linked to DCIS and 1455 linked to invasive cancer, describing 1552 unique cancers. Linkage was conducted according to human subject protocols to maintain patient confidentiality.
Statistical Analysis
The patient demographics in women with cancer and women without cancer were compared by using the Pearson χ2 test. A true-positive examination result was defined as a mammographic examination with an abnormal result and a cancer diagnosis within 12 months. A false-positive examination result was defined as a mammographic examination with an abnormal result without a cancer diagnosis within 12 months. PPV was defined as the percentage of abnormal mammographic examination results with a specific finding that had a subsequent cancer diagnosis (19). PPVs and 95% confidence intervals were calculated for mass, calcifications, architectural distortion, and asymmetry for all cancers and were stratified according to cancer type (invasive cancer vs DCIS) and type of examination (screening or diagnostic). The Wilson score method was used to calculate all confidence intervals (20). PPVs for each finding were also stratified according to patient age (in 10-year intervals), race or ethnicity, breast density, screening cycle (first vs subsequent), symptoms, family history of breast cancer, and previous breast biopsy. These PPVs were age adjusted to account for the differing prevalence among populations of different ages. A test for equality of percentages was used to compare PPVs among different race or ethnicity and symptom subgroups. The Cochran-Armitage test was used to analyze trends in PPV according to age strata. A clustered analysis was not performed because the results of more than one mammographic examination were included in the study in fewer than 4% of patients.
The finding-specific percentage of true-positive results in screening examinations was plotted versus the finding-specific percentage of false-positive results in screening examinations to analyze the effective contribution of each finding to mammographic accuracy. We calculated the finding-specific PPV for screening for each radiologist and plotted the results to analyze range and variability of values. To obtain a stable estimate of PPV, we limited our analysis to 23 readers who read at least 100 examinations. We also examined the association between a radiologist's volume or frequency of citing a specific finding with the PPV of that finding. We estimated both the number of screening examinations needed to detect one case of finding-specific breast cancer and the number of false-positive examination results that occurred per case of finding-specific breast cancer. Statistical analyses were performed by using software (Stata 8.0, Stata, College Station, Tex; SAS 8.2, SAS Institute, Cary, NC).
RESULTS
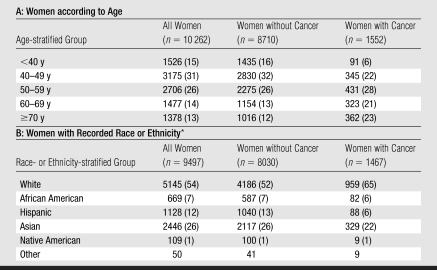
Across seven sites in the SFMR, 10 262 women underwent 10 641 screening and diagnostic mammographic examinations, with abnormal results (Table 1). Overall 15% of study participants (n = 1552) were diagnosed with cancer (invasive cancer, 1287 [83%]; DCIS, 270 [17%]). Women diagnosed with cancer were older (P < .005) and more likely to be white (P < .005) than women who were not diagnosed with cancer. Some cancers (n = 229 [15%]) were associated with both screening and diagnostic examinations.
Table 1.
Demographic Characteristics of Study Sample
Note.—Data are numbers of women. Numbers in parentheses are percentages, and percentages were rounded. The P value for age and race or ethnicity is less than .005 and was calculated by using the Pearson χ2 test.
Self reported in SFMR Breast Health Questionnaire. Numbers were summed and percentages were calculated by using known race only. The summed numbers did not include numbers in the category for other, and no percentages were calculated for that category.
Distribution of Abnormal Mammographic Findings
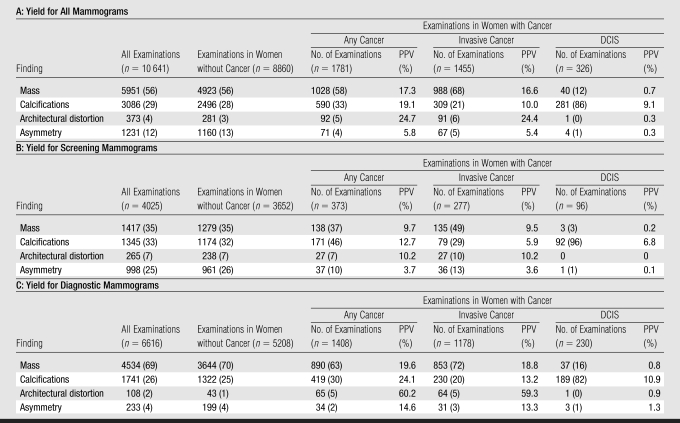
Overall, masses (56%) and calcifications (29%) were the most commonly recorded findings, followed by asymmetry (12%) and architectural distortion (4%) (Table 2). The distributions of these findings varied according to mammographic type. Diagnostic examinations had a higher percentage of masses (69%); in contrast, masses (35%), calcifications (33%), and asymmetry (25%) were equally common in screening examinations. Architectural distortion was an uncommon finding on both screening (7%) and diagnostic (2%) mammograms.
Table 2.
Distribution and Yield of Cancer (PPV) for Radiographic Findings in Abnormal Mammograms
Note.—Each mammogram appears only once; however, a given cancer may be linked to more than one mammogram. Most cancers are linked to only one mammogram. Women without cancer were considered to have false-positive results, and women with cancer were considered to have true-positive results. Numbers in parentheses are percentages, and percentages were rounded.
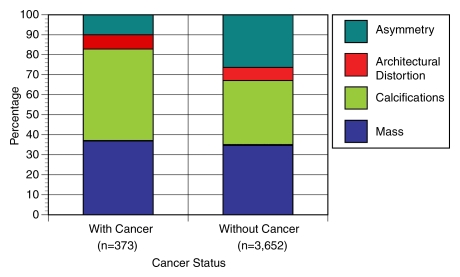
The distributions of mammographic findings among women with cancer (true-positive examination results) and women without cancer (false-positive examination results) who underwent screening mammography are shown in Figure 1. For screening mammography, masses and architectural distortion each reflected a similar percentage of true-positive and false-positive examination results (masses, 37% vs 35%; architectural distortion, 7% vs 7%, respectively). In contrast, asymmetry was much more common in false-positive examination results (26%) than in true-positive examination results (10%). Calcifications were more frequent in true-positive screening examination results (46%) compared with false-positive examination results (32%).
Figure 1:
Graph shows percentage of screening mammographic examinations with specific mammographic findings among women with cancer (true-positive results) and among women without cancer (false-positive results). Asymmetry represents 26% of false-positive results and 10% of true-positive results, compared with other findings that are more prevalent in true-positive results than in false-positive results. Sample sizes (n) refer to number of mammographic examinations.
Cancer Yield according to Finding
Invasive cancer.—Mass and calcifications were predictive of invasive cancer in both screening (PPV for mass, 9.5%; PPV for calcifications, 5.9%) and diagnostic examinations (PPV for mass, 18.8%; PPV for calcifications, 13.2%) (Table 2).
Architectural distortion exhibited high PPVs for invasive cancer in screening (10.2%) and diagnostic (59.3%) examinations.
Asymmetry was predictive of invasive cancer in diagnostic examinations (PPV, 13.3%) but demonstrated the lowest PPV of all findings in screening examinations (PPV, 3.6%).
DCIS.—Calcifications were the only finding predictive of DCIS in screening (PPV, 6.8%) and diagnostic (PPV, 10.9%) examinations.
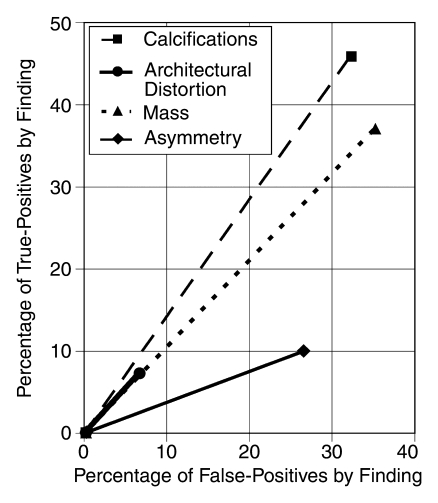
Figure 2 denotes the percentage of all true-positive results owing to a specific finding versus the percentage of all false-positive results owing to that finding at screening mammography. Among screening examinations, asymmetry was the least predictive of cancer. Asymmetry contributed to true-positive results (10%) but comprised a higher percentage of false-positive results (26%). Although architectural distortion made a smaller contribution to true-positive results (7%), it did so with relatively fewer false-positive results (7%). In contrast, asymmetry comprised only 4% of diagnostic false-positive results.
Figure 2:
Graph shows relative efficiency of each finding among all mammograms, plotting finding-specific percentage of true-positive results versus finding-specific percentage of false-positive results. The steeper the line, the more predictive the finding is of cancer. Asymmetry is the least predictive finding.
By using our estimation, 1690 screening mammographic examinations were needed to detect one asymmetry-associated cancer. In addition, 26 false-positive screening mammographic examinations with an identified asymmetry occurred per case of asymmetry-associated cancer detected. In contrast, fewer screening examinations were needed to detect one mass-associated cancer (n = 464) and one calcification-associated cancer (n = 368), and fewer false-positive results occurred per cancer detected (mass, 9.5; calcifications, 6.9). Architectural distortion required the greatest number of screening examinations to detect one cancer (n = 2303), with 8.8 false-positive results per architectural distortion–associated cancer detected.
Patient and Imaging Factors
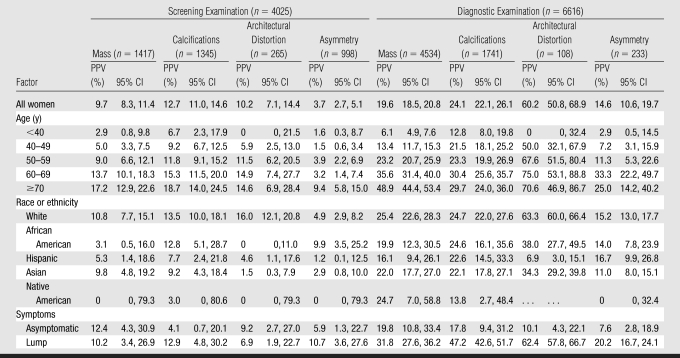
Diagnostic examinations demonstrated significantly higher PPVs than did screening examinations for each finding, as indicated by nonoverlapping 95% confidence intervals (Table 3). Finding-specific PPVs increased significantly according to age for both screening and diagnostic examinations (all, P < .05) but slightly less dramatically for calcifications and architectural distortion. For mass, the PPV for screening increased from 2.9% among women younger than 40 years to 17.2% among women 70 years or older; for calcifications, the PPV increased from 6.7% to 18.7%; for architectural distortion, the PPV increased from 0% to 14.6%; and for asymmetry, the PPV increased from 1.6% to 9.4%. Change in PPV for screening with age was particularly dramatic for asymmetry, which increased from less than 4.0% for all age categories younger than 70 years to 9.4% among women 70 years and older. Of note, the PPV for screening for all other findings was more than 4.0% for each age category except for mass (PPV, 2.9%) and architectural distortion (PPV, 0%) in women younger than 40 years.
Table 3.
Yield of Cancer (PPV) for Mammographic Findings according to Patient Factors in Screening and Diagnostic Examinations
Note.—All PPVs were reported as age adjusted (except for age stratification). CI = confidence interval.
Masses at screening examinations were more predictive of cancer among white women than among African American women (P = .005). Masses were less predictive of cancer among Hispanic women than among white women at screening (P = .012) and diagnostic (P < .001) examinations. Architectural distortion was less predictive of cancer among Asians than among whites at screening (P = .002) and diagnostic (P = .015) examinations. Architectural distortion at diagnostic examinations was less predictive of cancer among Hispanics than among whites (P = .002), with a less marked trend in screening examinations. PPVs did not vary significantly according to breast density, screening cycle, family history, or previous breast biopsy, although the study was not powered to detect small differences between subgroups. Across diagnostic examinations, mass, calcifications, and architectural distortion were significantly associated with cancer in women with a self-reported lump than in asymptomatic women (mass, P = .001; calcifications, P < .001; architectural distortion, P = .041).
There were much weaker, nonsignificant associations between PPV, on the one hand, and age, screening cycle, and type of mammographic examination for DCIS, on the other.
Cancer Yield for Asymmetry
Asymmetry subtypes (one view only, focal, and developing) demonstrated very different cancer yields (Table 4). Developing asymmetry, although infrequently reported at screening (4.4%) and diagnostic (2.9%) examinations, was the most predictive of cancer at screening (PPV, 7.4%) and diagnostic (PPV, 19.7%) examinations. In contrast, one-view-only and focal asymmetry were commonly reported at screening examinations (20.5% and 21.4%, respectively) but were the least predictive of cancer at screening examinations (PPV, 3.6% and 3.7%, respectively). Although one-view-only asymmetry was very common at screening examinations, it was rare at diagnostic examinations (frequency prevalence, 1.5%).
Table 4.
Yield of Cancer (PPV) for Asymmetry according to Age in Screening and Diagnostic Examinations
Note.—PPVs were calculated for six of seven study sites. CI = confidence interval.
Cancer Yield according to Reader
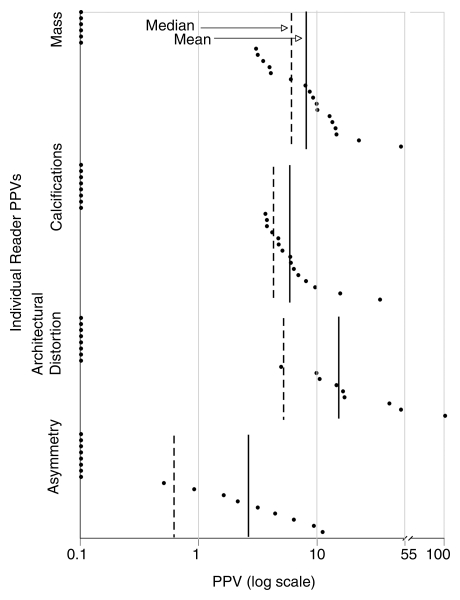
The mean and median PPV for screening were similar for mass (mean, 8.5%; median, 5.9%) and calcifications (mean, 5.2%; median, 4.1%) (Fig 3). Architectural distortion had a median of 4.9% but a mean of 15.4% owing to the high PPV for screening of a few readers. Asymmetry had the lowest mean PPV for screening, which was 2.3%, and a much lower median, which was 0.5%, relative to the mean than did the other findings.
Figure 3:
Graph shows finding-specific PPV for invasive cancer among screening mammographic examinations for individual high-volume radiologist readers. Asymmetry demonstrated lowest mean (2.3%) and median (0.5%) of all findings. Both architectural distortion and asymmetry demonstrated more skewedness than mass and calcifications, as demonstrated by greater discrepancy between their median and mean.
There was no association between a radiologist's volume or frequency of citing a specific finding with the PPV for screening of that finding. For example, the most prolific reader for asymmetry, who recorded 186 cases of asymmetry at screening examinations, had a PPV for screening of 0.5%, whereas the next prolific reader (n = 142) had a PPV for screening of 9.2%.
DISCUSSION
We describe the predictive value of four common mammographic findings among 46 San Francisco–based radiologists. Surprisingly, we found that calcifications were similarly predictive of invasive cancer and DCIS at screening and diagnostic mammographic examinations, leading to the detection of one in five invasive cancers. The presence of calcifications at mammography with abnormal results should prompt the clinician to suspect both invasive cancer and DCIS.
Architectural distortion has a low prevalence but is highly predictive of invasive cancer at screening and diagnostic examinations. Further studies could determine whether improved training in its identification improves mammographic outcomes and/or whether interreader variability is caused by inconsistent use of terminologies for findings. For example, misclassification of spiculated masses as architectural distortion could explain our high PPV for diagnostic examinations (60.2%), as spiculated mass is known to be highly predictive of cancer (10,13). If radiologists erroneously did not recall patients with subtypes of architectural distortion with a low cancer yield, for example, radial scars, the PPV for architectural distortion could be artificially inflated.
Asymmetry is the finding with the lowest cancer yield at screening examinations; with asymmetry, invasive cancer (particularly among women younger than 70 years) was infrequently identified and was commonly a false-positive result. The high false-positive rate probably occurs for two reasons: First, radiologists recall patients with abnormal one-view-only findings because they may represent cancers that are either obscured by dense tissue on the other view or not included in the image field. Most one-view-only findings represent superimposition of normal breast structures, so-called summation artifacts (21), and are infrequently cancer. However, some asymmetry findings are reclassified as mass, architectural distortion, or calcifications after full diagnostic imaging and lead to cancer detection, despite carrying a low likelihood of malignancy. Second, focal asymmetry is usually managed with short-interval follow-up rather than biopsy (22–26). Despite a low PPV, we found that asymmetry may be the only mammographic indicator of an abnormality, accounting for 5% of clinically occult invasive cancers. Because all participating radiologists received updated information in regard to changes in BI-RADS terminology for asymmetry in November 2003, we do not believe that there was confusion in the use of these terms.
Developing asymmetry is known to have a higher PPV for diagnostic examination than the other types of asymmetry (17,22–26). We also found that developing asymmetry was more predictive of cancer than was focal asymmetry or one-view-only asymmetry, and focal asymmetry and one-view-only asymmetry were less predictive of cancer than were mass, calcifications, and architectural distortion.
Patient Factors
Our study findings refine the known trend that PPV increases with age, showing that calcifications and architectural distortion vary slightly less according to age than do mass and asymmetry at screening and diagnostic examinations (27). The increased prevalence of breast cancer and the decreased prevalence of common benign lesions (eg, cysts, fibroadenomas) according to age probably explain this trend for mass. The decreased prevalence of benign asymmetry according to age, as adipose tissue replaces fibroglandular tissue, may explain this trend for asymmetry. In contrast, architectural distortion may be more detectable with age, as it is unmasked by the loss of fibroglandular tissue, but likely varies less with age simply because it is highly predictive of cancer even in low-risk women.
Masses at screening examinations are better predictive of cancer among white women than among African American or Hispanic women. Perhaps African American and Hispanic women have more benign breast masses, which would lead to a decrease in PPV in a predominantly healthy screening population. Women of different racial or ethnic groups may cluster according to facility; thus, facility could be a confounder of the relationship between race or ethnicity and PPV of masses. PPV surprisingly did not vary significantly according to breast density, screening cycle, family history, or history of biopsy. Thus, once a mammographic finding is identified, it should be evaluated in the same manner irrespective of these known breast cancer risk factors.
Strengths
Our study prospectively followed cases of mammographic examinations with abnormal results in a 5-year period and linked them to subsequent cancer diagnoses. We are aware of only two comparable large, prospective studies—one limited to screening examinations followed by biopsy recommendation and one limited to screening examinations followed by open biopsy in a Singaporean population (5,28). Compared with prior studies limited to biopsied breasts, we enabled more accurate determination of true- versus false-positive results by including outcomes on all findings through Surveillance Epidemiology and End Results linkage (4–14). Most prior studies are retrospective, small, at a single site, and have limited generalizability. In contrast, our study characterizes a large prospective cohort of women with stronger external validity because of the inclusion of multiple sites and readers. The uniformly used patient questionnaire of SFMR enabled PPV stratification that was based on consistently defined patient variables. Finally, both palpable and nonpalpable lesions were included, and we separately analyzed screening and diagnostic examination results.
Limitations
Our study was restricted to mammographic examinations with prospectively recorded findings. On average, the seven sites exhibited a 40%–60% finding reporting rate, as some readers may never have recorded specific findings. It seems unlikely that this would have introduced bias, as normal and abnormal examination results are distributed randomly to all readers at a given site. Data collection at most sites permitted single-finding identification only; thus, combinations of findings were not analyzed. Although inclusion of multiple mammographic facilities increased the generalizability of our results, it may have decreased the uniformity of lesion classification and contributed to interreader variability in PPVs. PPV is affected by breast cancer prevalence, and the PPVs will therefore vary in different parts of the country. However, it is likely that the relative predictive value of the different findings will remain the same. Finally, interpretation approaches of SFMR radiologists may not be generalizable to the approaches used by physicians throughout the United States.
Considerations
To our knowledge, this is the first large, comprehensive study of PPVs associated with specific mammographic findings. These PPVs can inform patients and providers of the expected outcomes of further work-up for abnormal findings (29). We found a very low median yield of cancer when high-volume radiologists recall patients with asymmetry for diagnostic imaging—the accepted interpretive approach (30).
On the basis of the results in our study, the work-up in patients with abnormal mammographic findings should be performed regardless of the specific patient risk factors that we analyzed. Findings at screening mammographic examinations have a lower change of malignancy (PPV for mass, 9.7%; PPV for calcifications, 12.7%; PPV for architectural distortion, 10.2%; PPV for asymmetry, 3.7%) than do findings at diagnostic mammographic examinations (PPV for mass, 19.6%; PPV for calcifications, 24.1%; PPV for architectural distortion, 60.2%; PPV for asymmetry, 14.6%). Notably, calcifications are similarly predictive of invasive cancer and DCIS, architectural distortion is associated with a high risk of cancer although it is infrequently described, and asymmetry at screening mammography has a low but clinically important yield of invasive cancer.
ADVANCES IN KNOWLEDGE
Calcifications are similarly predictive of invasive cancer and ductal carcinoma in situ when seen at screening and diagnostic mammographic examinations.
Architectural distortion as a mammographic finding has a low prevalence yet demonstrates a high positive predictive value (PPV) for cancer at screening and diagnostic examinations.
Asymmetry at screening mammographic examinations has a low but clinically important yield of invasive cancer and is a common source of false-positive results, particularly among women younger than 70 years.
Masses and architectural distortion have varying predictive power according to race or ethnicity at screening and diagnostic mammographic examinations.
PPV varies according to age to different degrees, depending on the specific mammographic finding identified at screening and diagnostic examinations.
IMPLICATION FOR PATIENT CARE
The PPVs from this study can be used to inform patients and providers of the expected outcomes of further work-up for abnormal mammographic findings.
Supplementary Material
Acknowledgments
Thanks to Michael Hofmann from the SFMR for his contribution to data extraction.
Abbreviations
BI-RADS = Breast Imaging Reporting and Data System
DCIS = ductal carcinoma in situ
PPV = positive predictive value
SFMR = San Francisco Mammography Registry
The ideas and opinions expressed herein are those of the authors and endorsement by the State of California, Department of Public Health, the National Cancer Institute, and Centers for Disease Control and Prevention or their contractors and subcontractors is not intended nor should be inferred.
Author contributions: Guarantors of integrity of entire study, A.V., K.K., R.S.; study concepts/study design or data acquisition or data analysis/interpretation, all authors; manuscript drafting or manuscript revision for important intellectual content, all authors; manuscript final version approval, all authors; literature research, A.V., E.A.S., R.S.; clinical studies, A.V., R.S.; statistical analysis, A.V., P.C., R.S.; and manuscript editing, A.V., K.K., E.A.S., R.S.
Authors stated no financial relationship to disclose.
Funding: This research was supported by the National Cancer Institute (grant no. U01CA63740).
References
- 1.Kerlikowske K, Grady D, Rubin SM, Sandrock C, Ernster VL. Efficacy of screening mammography: a meta-analysis. JAMA 1995;273:149–154. [PubMed] [Google Scholar]
- 2.Berry DA, Cronin KA, Plevritis SK, et al. Effect of screening and adjuvant therapy on mortality from breast cancer. N Engl J Med 2005;353:1784–1792. [DOI] [PubMed] [Google Scholar]
- 3.Pisano ED, Gatsonis C, Hendrick E, et al. Diagnostic performance of digital versus film mammography for breast-cancer screening. N Engl J Med 2005;353:1773–1783. [DOI] [PubMed] [Google Scholar]
- 4.Lijmer JG, Mol BW, Heisterkamp S, et al. Empirical evidence of design-related bias in studies of diagnostic tests. JAMA 1999;282:1061–1066. [DOI] [PubMed] [Google Scholar]
- 5.Moskowitz M. The predictive value of certain mammographic signs in screening for breast cancer. Cancer 1983;51:1007–1011. [DOI] [PubMed] [Google Scholar]
- 6.Stomper PC, Geradts J, Edge SB, Levine EG. Mammographic predictors of the presence and size of invasive carcinomas associated with malignant microcalcification lesions without a mass. AJR Am J Roentgenol 2003;181:1679–1684. [DOI] [PubMed] [Google Scholar]
- 7.Hermann G, Janus C, Schwartz IS, Papatestas A, Hermann DG, Rabinowitz JG. Occult malignant breast lesions in 114 patients: relationship to age and the presence of microcalcifications. Radiology 1988;169:321–324. [DOI] [PubMed] [Google Scholar]
- 8.Rosenbloom MB, Lisbona A. A prospective study of 8413 asymptomatic women undergoing mammography. Can Assoc Radiol J 1990;41:207–209. [PubMed] [Google Scholar]
- 9.Knutzen AM, Gisvold JJ. Likelihood of malignant disease for various categories of mammographically detected, nonpalpable breast lesions. Mayo Clin Proc 1993;68:454–460. [DOI] [PubMed] [Google Scholar]
- 10.Liberman L, Abramson AF, Squires FB, Glassman JR, Morris EA, Dershaw DD. The Breast Imaging Reporting and Data System: positive predictive value of mammographic features and final assessment categories. AJR Am J Roentgenol 1998;171:35–40. [DOI] [PubMed] [Google Scholar]
- 11.Goedde TA, Frykberg ER, Crump JM, Lay SF, Turetsky DB, Linden SS. The impact of mammography on breast biopsy. Am Surg 1992;58:661–666. [PubMed] [Google Scholar]
- 12.Ciatto S, Cataliotti L, Distante V. Nonpalpable lesions detected with mammography: review of 512 consecutive cases. Radiology 1987;165:99–102. [DOI] [PubMed] [Google Scholar]
- 13.Ciatto S, Del Turco MR, Bonardi R, et al. Non-palpable lesions of the breast detected by mammography: review of 1182 consecutive histologically confirmed cases. Eur J Cancer 1994;30A:40–44. [DOI] [PubMed] [Google Scholar]
- 14.Burrell HC, Pinder SE, Wilson AR, et al. The positive predictive value of mammographic signs: a review of 425 non-palpable breast lesions. Clin Radiol 1996;51:277–281. [DOI] [PubMed] [Google Scholar]
- 15.American College of Radiology. Breast imaging reporting and data system (BI-RADS). 3rd ed. Reston, Va: American College of Radiology, 1998.
- 16.American College of Radiology. Breast imaging reporting and data system (BI-RADS). 4th ed. Reston, Va: American College of Radiology, 2003.
- 17.Leung JW, Sickles EA. Developing asymmetry identified on mammography: correlation with imaging outcome and pathologic findings. AJR Am J Roentgenol 2007;188:667–675. [DOI] [PubMed] [Google Scholar]
- 18.Ernster VL, Ballard-Barbash R, Barlow WE, et al. Detection of DCIS in women undergoing screening mammography. J Natl Cancer Inst 2002;94:1546–1554. [DOI] [PubMed] [Google Scholar]
- 19.Nass S, Ball J, eds. Executive summary: improving breast imaging quality standards. Committee on Improving Mammography Quality Standards. Washington, DC: National Research Council, 2005.
- 20.Agresti A, Coull BA. Approximate is better than “exact” for interval estimation of binomial proportions. Am Stat 1998;52:119–126. [Google Scholar]
- 21.Sickles EA. Findings at mammographic screening on only one standard projection: outcomes analysis. Radiology 1998;208:471–475. [DOI] [PubMed] [Google Scholar]
- 22.Helvie MA, Pennes DR, Rebner M, Adler DD. Mammographic follow-up of low-suspicion lesions: compliance rate and diagnostic yield. Radiology 1991;178:155–158. [DOI] [PubMed] [Google Scholar]
- 23.Sickles EA. Periodic mammographic follow-up of probably benign lesions: results in 3,184 consecutive cases. Radiology 1991;179:463–468. [DOI] [PubMed] [Google Scholar]
- 24.Varas X, Leborgne F, Leborgne JH. Nonpalpable, probably benign lesions: role of follow-up mammography. Radiology 1992;184:409–414. [DOI] [PubMed] [Google Scholar]
- 25.Varas X, Leborgne JH, Leborgne F, Mezzera J, Jaumandreu S, Leborgne F. Revisiting the mammographic follow-up of BI-RADS category 3 lesions. AJR Am J Roentgenol 2002;179:691–695. [DOI] [PubMed] [Google Scholar]
- 26.Vizcaino I, Gadea L, Andreo L, et al. Short-term follow-up results in 795 nonpalpable probably benign lesions detected at screen mammography. Radiology 2001;219:475–483. [DOI] [PubMed] [Google Scholar]
- 27.Franceschi D, Crowe JP, Lie S, et al. Not all nonpalpable breast cancers are alike. Arch Surg 1991;126:967–970. [DOI] [PubMed] [Google Scholar]
- 28.Tan YY, Wee SB, Tan MP, Chong BK. Positive predictive value of BI-RADS categorization in an Asian population. Asian J Surg 2004;27:186–191. [DOI] [PubMed] [Google Scholar]
- 29.Kopans DB. The positive predictive value of mammography. AJR Am J Roentgenol 1992;158:521–526. [DOI] [PubMed] [Google Scholar]
- 30.Sickles EA. The spectrum of breast asymmetries: imaging features, work-up, management. Radiol Clin North Am 2007;45:765–771. [DOI] [PubMed] [Google Scholar]
Associated Data
This section collects any data citations, data availability statements, or supplementary materials included in this article.


