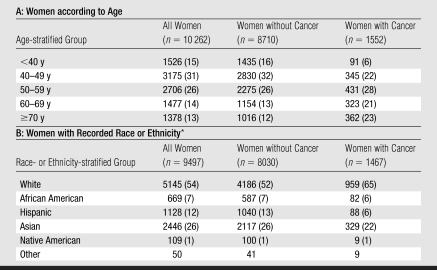
Table 1.
Demographic Characteristics of Study Sample
Note.—Data are numbers of women. Numbers in parentheses are percentages, and percentages were rounded. The P value for age and race or ethnicity is less than .005 and was calculated by using the Pearson χ2 test.
Self reported in SFMR Breast Health Questionnaire. Numbers were summed and percentages were calculated by using known race only. The summed numbers did not include numbers in the category for other, and no percentages were calculated for that category.

