Abstract
Purpose: To use first-pass perfusion and delayed-enhanced (DE) magnetic resonance (MR) imaging for the detection of the early effects of coronary microembolization on myocardial perfusion and viability.
Materials and Methods: Approval was obtained from the institutional committee on animal research. A hybrid x-ray and MR imaging system was used to guide the endovascular catheter and quantify the left anterior descending coronary artery (LAD) perfusion territory before microembolization and ischemic myocardium and microinfarction after microembolization. The embolic agent was selectively delivered in the LAD in six pigs. First-pass perfusion MR imaging was performed 1 hour and 1 week after microembolization. Microinfarction was measured on DE MR images in beating and nonbeating hearts (high-spatial-resolution sequence) by using extracellular and blood pool MR contrast media and after death. The Wilcoxon signed rank test and correlation analysis were used.
Results: The LAD perfusion territory was 35% of left ventricular (LV) mass ± 2 (standard error of the mean). Microembolization caused perfusion deficit in 15.7% of LV mass ± 2.6 compared with that of LAD territory (P = .03). At 1 week, perfusion parameters improved and the extent of hypoperfused territory declined (4.6% of LV mass ± 1.4, P = .03). Microinfarction size expanded from 1.4% of LV mass ± 0.2 at 1 hour to 7.5% of LV mass ± 1.2 at 1 week. In nonbeating hearts and at triphenyltetrazolium chloride staining at 1 week, microinfarction size was 7.6% of LV mass ± 1.4 and 7.2% of LV mass ± 1.5, respectively. There was no correlation between the ejection fraction and the extents of microinfarction or hypoperfused territory. Histopathologic findings confirmed the presence of patchy microinfarction.
Conclusion: Coronary microembolization caused persistent decline in myocardial perfusion at first-pass perfusion imaging. DE MR imaging has the potential to help reliably quantify subacute microinfarction. The magnitude of LV dysfunction is not related to the extents of microinfarction or hypoperfused territory.
© RSNA, 2009
Coronary microemboli fragmented from atherosclerotic plaque in acute coronary syndrome and unstable angina (1,2) and after reperfusion at percutaneous coronary intervention (3–7) cause microinfarction and release of myocardial ischemic markers. It is difficult to separate the effects of reperfusion injury (8) from distal microinfarction after coronary intervention because they overlap in an uncontrolled fashion. Furthermore, invasive physiologic studies (9–12) have shown that the magnitude of left ventricular (LV) dysfunction is not closely related to the mass of microinfarction. Methodologic difficulties have hindered the use of noninvasive techniques in simultaneously measuring and linking microinfarction size, perfusion, and LV function.
Magnetic resonance (MR) imaging, in combination with extracellular and blood pool MR contrast media (13,14), has the ability to help noninvasively measure myocardial perfusion (15–17), infarction size (18–20), and LV function (21,22). Differentiation of viable from nonviable myocardium on contrast material–enhanced MR images is based on the differences in the distribution volume and kinetics of MR imaging contrast media (23,24). Clinical MR imaging studies (2,7,25,26) have demonstrated microinfarction as hyperenhanced regions on delayed-enhanced (DE) images in patients with an elevation of myocardial ischemic markers after percutaneous coronary intervention.
Sato et al (27) illustrated that microembolization plays a major role in decreasing coronary flow after percutaneous coronary intervention by using intravascular ultrasonography and Thrombolysis in Myocardial Infarction frame count in 60 patients. In another clinical study, Taylor et al (28) showed percutaneous coronary intervention–induced impairment of resting microvascular perfusion in the coronary artery perfusion territory in patients and related this to iatrogenic atherosclerotic plaque rupture. MR and Doppler imaging studies (7,29) showed decreased myocardial perfusion reserve, but not at rest, in patients with microinfarction after coronary intervention.
Unlike contiguous infarction, to our knowledge, no study has addressed the combined use of first-pass perfusion and DE MR imaging in the assessment of the immediate (acute) and delayed (subacute) effects of coronary microembolization. Both extracellular and blood pool gadolinium–based MR contrast agents have been used for the delineation of acute infarction, but blood pool agents provide prolonged delineation of contiguous infarction (30). The rationale of using a blood pool agent in our study was that the extracellular agent washes out quickly from microinfarction and the intravascular agent provides longer enhancement because of its slow washout. Therefore, both extracellular and blood pool MR contrast agents were tested to help visualize microinfarction after coronary microembolization. The importance of early detection of the effects of microembolization is derived from previous clinical studies in acute coronary syndrome, percutaneous coronary intervention, and coronary artery bypass graft surgery (1–7). The aim of this study was to use first-pass perfusion and DE MR imaging for the detection of the early effects of coronary microembolization on myocardial perfusion and viability.
MATERIALS AND METHODS
Animals and Study Protocol
The study was performed in concordance with the Guide for the Care and Use of Laboratory Animals (31), and approval was obtained from the institutional committee on animal research. Pigs (n = 8, 34 kg ± 1 [standard deviation]) (Pork Power Farms, Turlock, Calif) were premedicated (1.1 mg per kilogram of body weight acepromazine [PromAce; Fort Dodge Animal Health, Fort Dodge, Iowa] and 30 minutes later 22–33 mg/kg ketamine [Ketaset; Fort Dodge Animal Health]) and anesthetized (isoflurane [2%–5%] [IsoFlo; Abbott Laboratories, Chicago, Ill] and oxygen [2–3 L/min]).
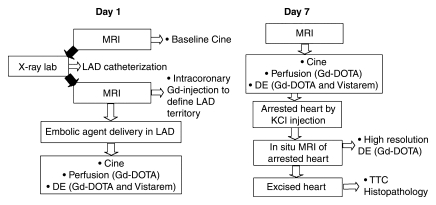
All studies were performed with a hybrid x-ray and MR system suite (Philips Medical Systems, Best, the Netherlands). X-ray fluoroscopy (Integris V5000; Philips Medical Systems) was used for coronary catheterization (M.W., M.S., and M.C., with 10, 20, and 1 year of experience, respectively), and an MR imager (Achieva I/T; Philips Medical Systems) was used for visualization and assessment of the effects of microinfarction (A.J.M., M.S., and M.C., with 10, 20, and 8 years of experience in cardiac MR imaging). The study and imaging protocols are shown in Figure 1.
Figure 1:
Schematic diagram shows study design and imaging protocol. The study was performed with a hybrid system composed of an x-ray C-arm and MR imager. Black arrows = transfer of the animal with a floating table between the units. DE = delayed-enhanced MR imaging, Gd = gadolinium-based, Gd-DOTA = gadoterate meglumine, KCl = saturated potassium chloride, LAD = left anterior descending coronary artery, TTC = triphenyltetrazolium chloride.
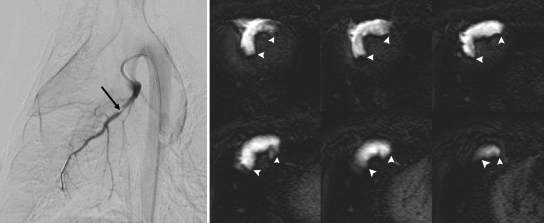
After placement of a 6-F sheath (Avanti; Cordis, Miami, Fla) in the femoral artery, selective catheterization of the LAD was performed (6-F catheter, Vistabritetip; Cordis) by using a 50:50 solution of saline and iohexol (Omnipaque 300; GE Healthcare, Milwaukee, Wis). A 3-F catheter (Infusion Catheter; Cook, Chicago, Ill) was placed distal to the first diagonal, and the animal was then moved to the MR imager by using a continuous rail system. An injection of 10% gadoterate meglumine (Dotarem; Guerbet, Villepinte, France) through the coronary catheter followed by DE MR imaging was used to map the LAD perfusion territory (Fig 2). After the delineation of the LAD perfusion territory (Fig 1), microinfarction was created with slow injection of an embolic agent (7500 particles, 100–300 μm in diameter, Embosphere; Biosphere Medical, Rockland, Mass) through the 3-F coronary catheter (M.S. and M.C.). The medium-size particles of the embolic agent used in this study were based on the range of microemboli sizes (47–2503 μm in diameter) determined during coronary intervention in patients (32,33). The embolic agent employed in this study is approved for clinical use in interventional procedures, such as embolization of tumors and arteriovenous malformations. One pig died during catheterization because of ventricular fibrillation, and one pig died 4 hours after the procedure.
Figure 2:
Angiogram and DE MR images show the use of an x-ray and MR system for catheter placement with x-ray fluoroscopy in LAD and quantification of the embolized territory with MR imaging. Left: LAD coronary angiogram. Tip of the 3-F coronary catheter is seen distal to the first diagonal (arrow). Right: Selection of DE MR images (20 images in total covering the LV) obtained after selective injection of 6 mL 10% gadoterate meglumine into LAD. Hyperenhanced territory (arrowheads) demonstrates LAD perfusion territory. Slow delivery of embolic agent was performed 10 minutes after defining the LAD territory.
MR Imaging Protocol
1. A saturation-recovery gradient-echo sequence was used for assessing regional perfusion, and imaging parameters were as follows: repetition time msec/echo time msec, 4.5/2.2; flip angle, 20°; section thickness, 10 mm; field of view, 26 × 26 cm; matrix size, 128 × 128; and acquisition time, two R-R intervals per dynamic acquisition. First-pass perfusion imaging was performed starting 5–6 seconds prior to intravenous injection of 0.1 mmol/kg gadolinium-based contrast material and continuing for approximately 100 seconds in four short-axis sections spaced to encompass the embolized territory defined earlier with the intracoronary injection of 10% gadoterate meglumine (6 mL).
2. DE MR imaging was performed by using an inversion recovery gradient-echo sequence in short-axis and long-axis views encompassing the heart (18–20 sections) to locate and quantify the extent of microinfarction. The imaging parameters were as follows: 5/2; flip angle, 15°; shot interval, two R-R intervals; section thickness, 3 mm; no intersection gap; field of view, 26 × 26 cm; and matrix size, 256 × 162. The inversion time was chosen to null normal myocardium and was obtained by using a Look-Locker sequence. An additional 0.05 mmol/kg gadoterate meglumine was administered, and DE MR imaging was performed every 2 minutes for 20 minutes after gadoterate meglumine administration. Thirty minutes later, 0.026 mmol/kg of intravascular MR contrast agent P792 (Vistarem; Guerbet, Paris, France) was injected, and DE MR imaging was repeated at 5, 10, and 20 minutes after injection.
3. Cine MR images were acquired by using a steady-state free precession sequence with the following imaging parameters: 3.5/1.75; flip angle, 70°; section thickness, 10 mm; no intersection gap; field of view, 25 × 25 cm; matrix size, 160 × 152; and heart phases, 16. These images were obtained for measurement of ejection fraction (EF) at baseline, 1 hour, and 1 week.
Imaging of Nonbeating Heart
At 1 week, the animals were sacrificed by injecting 40 mL saturated potassium chloride to arrest the heart at end diastole. A high-spatial-resolution DE MR imaging sequence was used for imaging the heart in situ (Fig 1). A simulated electrocardiogram was set to the same heart rate as before sacrifice. Imaging parameters for this sequence were as follows: 1.7/5.5; flip angle, 15°; acquired voxel section, 1 × 1 × 2 mm reconstructed to 0.88 × 0.88 × 1.00 mm; turbo field-echo factor, 37; and number of signals acquired, three. Shot interval and inversion time were set to be equivalent to two R-R intervals of the beating heart, and the resulting imaging time was 15–20 minutes.
MR Imaging Data Analysis
All MR imaging data were analyzed by two investigators (M.S. and M.C.) in a blinded fashion and in consensus by using freely available software (Segment, version 1.6; http://segment.heiberg.se) (34). Anatomic landmarks such as the papillary muscles, right ventricular insertion points, and the length from base to apex enabled the matching of sections between 1 day after microembolization, 1 week after microembolization, and TTC staining. The LAD perfusion territory was quantified on DE MR images. The images were automatically analyzed by using a thresholding method of the signal intensity + 3 standard deviations higher than that of remote myocardium. Thresholding of 2 standard deviations or more has previously been described for quantifying hyperenhanced myocardium (35).
Regional maximum upslope, peak signal intensity, and time to peak were obtained at first-pass perfusion MR imaging. The region of interest for perfusion analysis included the midmyocardium but excluded the immediate subepicardial and subendocardial regions to minimize the influence of volume averaging effects and/or susceptibility artifacts. To compare the first-pass perfusion curves between different animals and different acquisitions, the images were normalized. Mean signal intensity from the LV blood before arrival of the contrast agents was used as a reference signal, and all images were multiplied by this factor (SIa/SIrv, where SIa is signal intensity in the individual animal before arrival of contrast material, and SIrv is the signal intensity of reference values before arrival of contrast material). Microinfarction was quantified on DE MR images by using the thresholding method of signal intensity + 3 standard deviations higher than that of remote myocardium within the area at risk and was expressed as percentage of LV mass and circumferential extent. Cine images were used to calculate the EF by delineation of the endocardium on all short-axis images at end diastole and end systole. LV mass was measured as the difference between epicardial and endocardial volumes multiplied by 1.05.
Postmortem Analysis
Histopathologic findings were used to confirm delivery of the embolic agent and microinfarction. The hearts were excised after sacrificing the animals, sliced into 10-mm slices, and soaked for 15 minutes in 2% TTC stain. Digital images of the TTC-stained slices were obtained and converted to black and white images by using software (Adobe Photoshop CS2; http://www.adobe.com/). Microinfarcted tissue was automatically quantified from TTC-stained slices by using software (ImageJ, version 1.30; National Institutes of Health, http://rsb.info.nih.gov/ij/) and also by thresholding the pixels (+3 standard deviations higher than the signal intensity of remote myocardium). Tissue samples were taken from the embolized region and remote myocardium, embedded in paraffin, sliced (5 μm), and stained with hematoxylin-eosin and Masson trichrome.
Statistical Analysis
All continuous variables were presented as means ± standard errors of the mean. Six animals were used for analysis, and software (Prism, version 5.0; GraphPad Software, San Diego, Calif) was used for all calculations. The Wilcoxon signed rank test was used to determine if variables differed between time points and myocardial regions. Correlation analysis was performed between EF and microinfarction size and hypoperfused myocardium. Bias was calculated as the mean difference between the methods and was presented as mean difference ± standard deviation of the difference by using the Bland-Altman test. P values less than .05 were considered to indicate statistically significant differences.
RESULTS
Catheterization and Microembolization
With x-ray fluoroscopy, the LAD was successfully catheterized in all animals. After moving the table top from the x-ray catheterization laboratory to the MR imager, LAD territory was identified prior to the delivery of the embolic agent in all animals by using a first-pass perfusion sequence after injection of 6–10 mL 10% gadoterate meglumine into the LAD (Fig 2). The extent of the LAD perfusion territory was observed to have a mean equal to 35% of LV mass ± 2 (standard error of the mean). Injection of the embolic agent induced ST segment depression and T wave inversion on the electrocardiogram and solitary premature ventricular ectopic beats. One pig died during catheterization because of ventricular fibrillation, and one pig died 4 hours after the procedure.
Perfusion Results
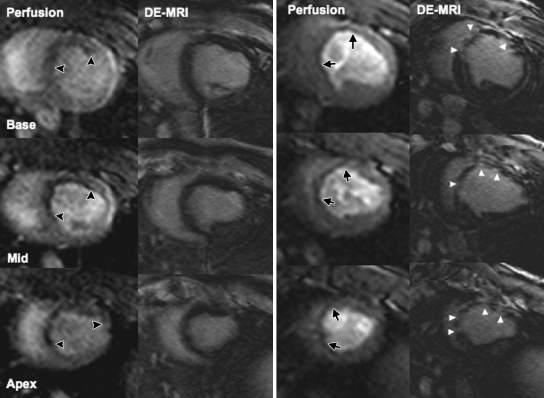
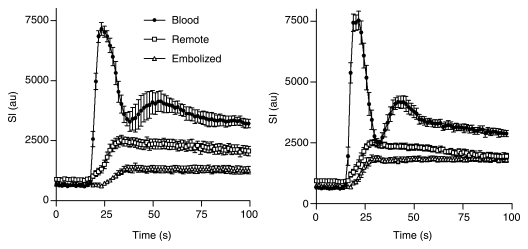
First-pass perfusion results revealed the embolized region as hypoenhanced at 1 hour, but the perfusion defect was less prominent at 1 week (Fig 3). The extent of the hypoperfused territory 1 hour after embolization (15.7% of LV mass ± 2.6) was smaller than that of the LAD territory (P = .03). At 1 week, the extent of the hypoperfused territory declined (4.6% of LV mass ± 1.4, P = .03). Quantitative perfusion parameters are shown in the Table, and the dynamics of the perfusion for all animals are shown in Figure 4. At 1 hour, maximum signal intensity and peak slope were lower and time to peak was longer in embolized myocardium than in remote myocardium (P = .03 for all). At 1 week, there was significant improvement in time to peak and peak slope in the embolized myocardium (P = .03 for both) but not for maximum signal intensity (P = .09). However, all perfusion parameters in the embolized myocardium were still lower than in the remote myocardium (P = .03). Maximum signal intensity, time to peak, and peak slope were not significantly different at 1 hour and 1 week in the blood pool (P = .56, .84, and .84, respectively) or in the remote myocardium (P = .69, .31, and .69, respectively).
Figure 3:
Multisection first-pass perfusion and DE MR images (DE-MRI) at 1 hour (left) and 1 week (right) demonstrate the effects of microembolization. Perfusion is decreased in embolized region (black arrowheads). DE MR images show fuzzy scattered hyperenhancement at 1 hour. At 1 week, perfusion defect was less pronounced (black arrows), but microinfarction was well defined as patchy hyperenhanced regions on DE MR images (white arrowheads).
Table 1.
Perfusion Parameters Measured in Myocardial Regions 1 Hour and 1 Week after Coronary Microembolization
Note.—Data are means ± standard errors of the mean. Mean heart rate 1 hour after microembolization was 76 beats per minute ± 4, and mean heart rate 1 week after microembolization was 92 beats per minute ± 3.
P < .05 for the comparison of remote to embolized myocardium.
P < .05 for the comparison of 1 hour to 1 week.
Figure 4:
The passage of MR contrast media in LV blood pool, remote myocardium, and embolized myocardium 1 hour (left) and 1 week (right) after microembolization. Note marked reduction in perfusion in embolized territory compared with that in remote myocardium at 1 hour and the partial recovery after 1 week. au = arbitrary units, SI = signal intensity.
Myocardial Microinfarction
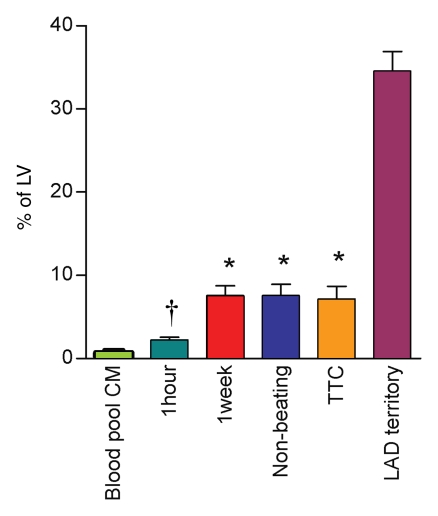
At 1 hour after microembolization, discrete microinfarction with fuzzy borders was visualized in three animals on DE MR images. By using the automated thresholding method, the extent of microinfarction was 1.4% of LV mass ± 0.2 (Fig 3). Therefore, we concluded that DE MR imaging is not a reliable technique for measurement of final microinfarction size at this time. However, at 1 week, all animals showed larger microinfarction in the embolized region on DE MR images in the beating heart and on high-spatial-resolution DE MR images in the arrested heart than at 1 hour. At 1 week, the extent of microinfarction did not differ (P = .56) between DE MR images in the beating heart (7.5% of LV mass ± 1.2, P = .03 vs beating heart at 1 hour) and DE MR images in the arrested heart (7.6% of LV mass ± 1.4, P = .03 vs beating heart at 1 hour) (Fig 5). Furthermore, the circumferential extent of the microinfarcted territory was 23% of LV mass ± 1.
Figure 5:
Microinfarction size in percentage of the LV mass measured on DE MR images after injection of blood pool contrast medium (CM) (green bar) and after injection of extracellular contrast medium at 1 hour (teal bar) and 1 week (red bar), on high-spatial-resolution MR images in nonbeating hearts (blue bar), and at TTC staining (orange bar). The LAD perfusion territory in percentage of the LV (purple bar) is shown for comparison. There was no significant difference between MR imaging measurements at 1 week in the beating heart and MR imaging measurements in the nonbeating heart or measurements at TTC staining. * = P < .05 compared with 1 hour. † = P = .03 compared with the extent after administration of blood pool contrast medium. Error bars = standard errors of the mean.
Microinfarctions caused by microembolization were patchy and distributed in the entire transmural extent of the embolized myocardium, rather than being limited to the endocardium. The microinfarction showed a striped pattern from the endocardium to the epicardium, which was different from contiguous infarction after occlusion of an epicardial artery (Figs 3, 6). The ratio of signal intensity between microinfarction and remote myocardium was highest (4.2 ± 2.8) at 6 minutes ± 4 (standard deviation) after contrast material injection. The hyperenhanced regions on DE MR images after blood pool contrast medium injection at 1 hour (0.7% of LV mass ± 0.3) were smaller than those after extracellular MR contrast material injection (P = .03).
Figure 6:
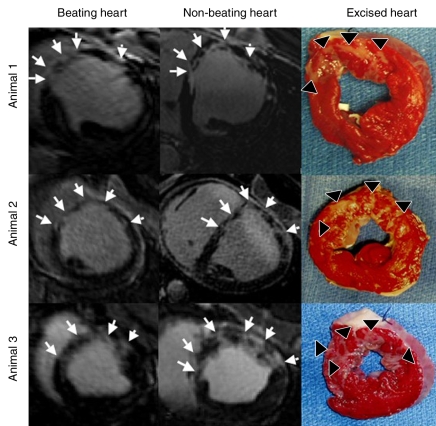
DE MR images (beating and nonbeating hearts) and TTC-stained excised hearts show different patterns of patchy microinfarction in three animals. The microinfarction is patchy with stripes from the endocardium to the epicardium, as shown on MR images (arrows) and at TTC staining (arrowheads).
Global LV Function
The EF declined from 49% ± 1 at baseline to 29% ± 1 at 1 hour (P = .02) and 36% ± 1 at 1 week after microembolization (P = .03). The EF did not correlate with the extent of enhanced microinfarction calculated at DE MR imaging (r = 0.20) at 1 hour or at MR imaging (r = 0.54) and TTC staining (r = 0.04) at 1 week. In addition, there was no correlation between EF and circumferential extent of microinfarction (r = 0.19) or the extent of hypoperfused myocardium at first-pass perfusion imaging at 1 hour (r = 0.27) or 1 week (r = 0.39) (P = not significant for all).
Histopathologic Results
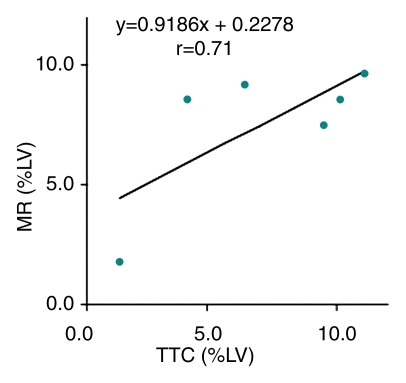
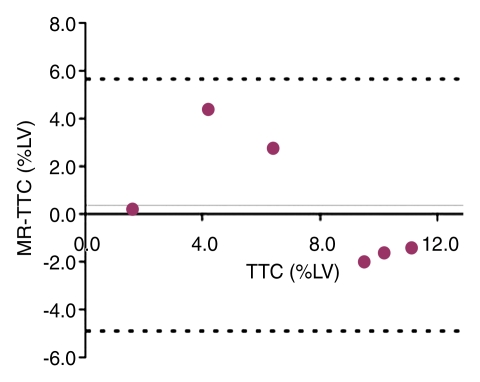
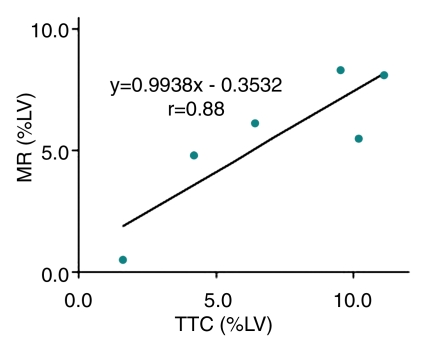
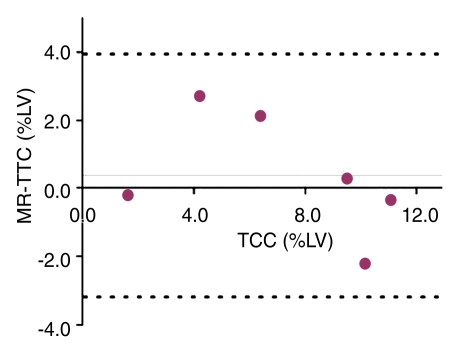
TTC staining results confirmed MR imaging findings with patchy microinfarction in all animals (Fig 6). The extent of microinfarction quantified with TTC staining (7.2% of LV mass ± 1.5) did not differ significantly from the extent determined by using DE MR imaging of the beating heart at 1 week (7.5% of LV mass ± 1.2, P = .84) or by using DE MR imaging of the nonbeating heart (7.6% of LV mass ± 1.4, P = .75) (Fig 5). The high correlation between TTC staining and DE MR imaging in beating and nonbeating hearts (r = 0.71, y = 0.92x + 0.23 and r = 0.88, y = 0.99x − 0.35, respectively) and low bias (0.4% ± 2.5 and 0.4% ± 1.8) (Fig 7) indicated that DE MR imaging after administration of extracellular MR contrast agent is an accurate method for the quantification of microinfarction.
Figure 7a:
(a) Graph shows correlation between extent of microinfarction measured at MR imaging and TTC staining in beating hearts in six animals. (b) Bland-Altman plot shows bias between MR imaging and TTC staining in beating hearts in six animals. (c) Graph shows correlation between extent of microinfarction measured at MR imaging and TTC staining in nonbeating hearts in six animals. (d) Bland-Altman plot shows bias between MR imaging and TTC staining in nonbeating hearts in six animals. Dotted lines in b and d represent 2 standard deviations above and below the mean.
Figure 7b:
(a) Graph shows correlation between extent of microinfarction measured at MR imaging and TTC staining in beating hearts in six animals. (b) Bland-Altman plot shows bias between MR imaging and TTC staining in beating hearts in six animals. (c) Graph shows correlation between extent of microinfarction measured at MR imaging and TTC staining in nonbeating hearts in six animals. (d) Bland-Altman plot shows bias between MR imaging and TTC staining in nonbeating hearts in six animals. Dotted lines in b and d represent 2 standard deviations above and below the mean.
Figure 7c:
(a) Graph shows correlation between extent of microinfarction measured at MR imaging and TTC staining in beating hearts in six animals. (b) Bland-Altman plot shows bias between MR imaging and TTC staining in beating hearts in six animals. (c) Graph shows correlation between extent of microinfarction measured at MR imaging and TTC staining in nonbeating hearts in six animals. (d) Bland-Altman plot shows bias between MR imaging and TTC staining in nonbeating hearts in six animals. Dotted lines in b and d represent 2 standard deviations above and below the mean.
Figure 7d:
(a) Graph shows correlation between extent of microinfarction measured at MR imaging and TTC staining in beating hearts in six animals. (b) Bland-Altman plot shows bias between MR imaging and TTC staining in beating hearts in six animals. (c) Graph shows correlation between extent of microinfarction measured at MR imaging and TTC staining in nonbeating hearts in six animals. (d) Bland-Altman plot shows bias between MR imaging and TTC staining in nonbeating hearts in six animals. Dotted lines in b and d represent 2 standard deviations above and below the mean.
Microscopic examination results showed partially healed microinfarction in stripes from the epicardium to the endocardium (Fig 8), with inflammatory cells in the healing infarcted tissue. The embolic agent was present in various sizes of coronary arterioles and was clustered within the vascular lumen, and the obstructed vessels showed evidence of inflammation and thrombi formation.
Figure 8a:
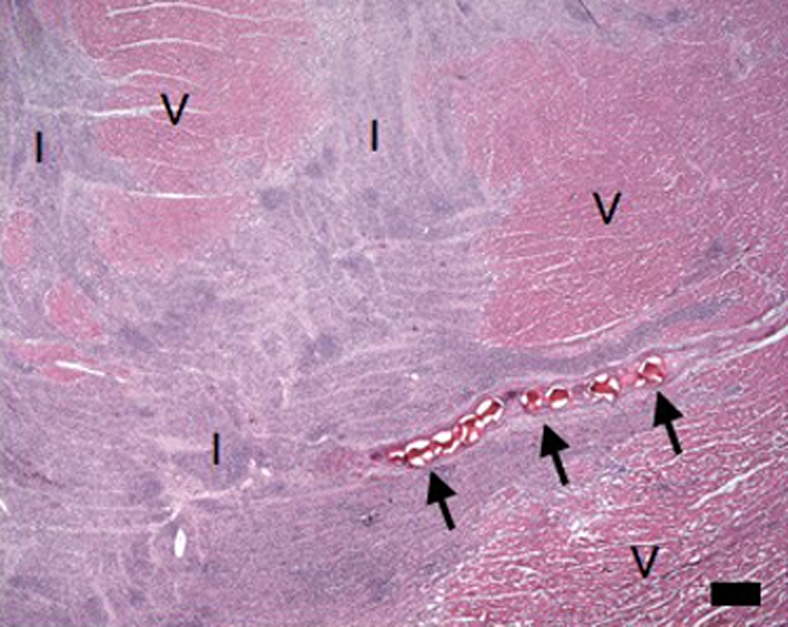
(a–d) Histologic slices obtained from the microinfarcted territory show microinfarction (I) surrounded by viable myocardium (V) and embolic agents (arrows) obstructing microvessels. (a) Several embolic agents are shown inside a vessel surrounded by microinfarction. (b) Stripes of infarcted tissue with inflammatory cells from the epicardium (left bottom corner) to the endocardium (out of field at right). (c) A thin stripe of healing microinfarction extends from epicardial surface (top right) to endocardium (bottom left) where the microinfarction is broader. (d) A longitudinally cut vessel with two embolic agents is surrounded by fibrin and organizing tissue, which are signs of inflammatory reaction within the vessel. Scale bars = 400 μm. (a and b, hematoxylin-eosin stain; original magnification, ×25.) (c and d, Masson trichrome stain; original magnification, ×100 for c and ×400 for d.)
Figure 8b:
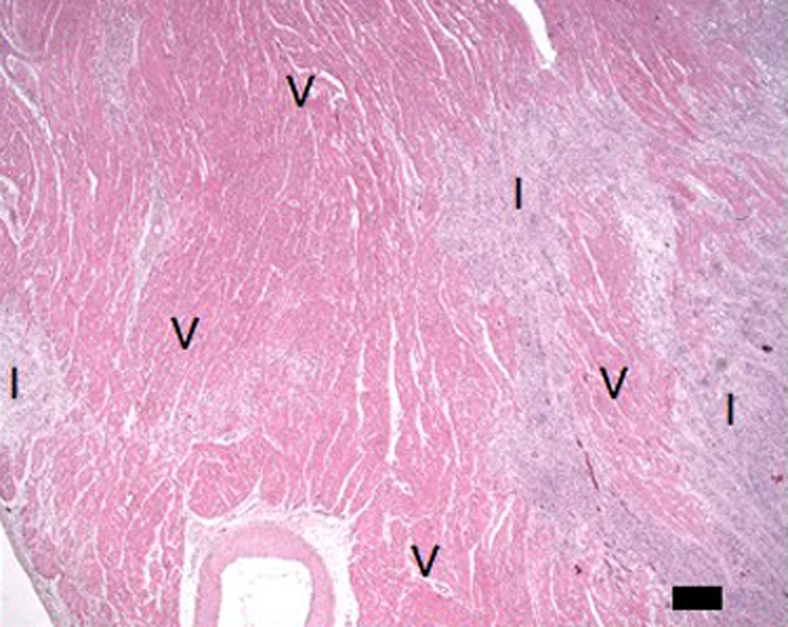
(a–d) Histologic slices obtained from the microinfarcted territory show microinfarction (I) surrounded by viable myocardium (V) and embolic agents (arrows) obstructing microvessels. (a) Several embolic agents are shown inside a vessel surrounded by microinfarction. (b) Stripes of infarcted tissue with inflammatory cells from the epicardium (left bottom corner) to the endocardium (out of field at right). (c) A thin stripe of healing microinfarction extends from epicardial surface (top right) to endocardium (bottom left) where the microinfarction is broader. (d) A longitudinally cut vessel with two embolic agents is surrounded by fibrin and organizing tissue, which are signs of inflammatory reaction within the vessel. Scale bars = 400 μm. (a and b, hematoxylin-eosin stain; original magnification, ×25.) (c and d, Masson trichrome stain; original magnification, ×100 for c and ×400 for d.)
Figure 8c:
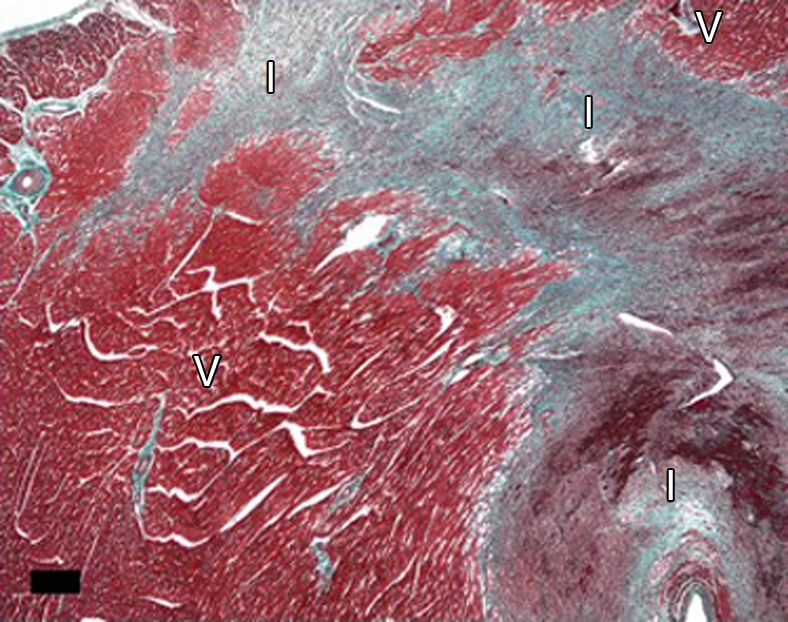
(a–d) Histologic slices obtained from the microinfarcted territory show microinfarction (I) surrounded by viable myocardium (V) and embolic agents (arrows) obstructing microvessels. (a) Several embolic agents are shown inside a vessel surrounded by microinfarction. (b) Stripes of infarcted tissue with inflammatory cells from the epicardium (left bottom corner) to the endocardium (out of field at right). (c) A thin stripe of healing microinfarction extends from epicardial surface (top right) to endocardium (bottom left) where the microinfarction is broader. (d) A longitudinally cut vessel with two embolic agents is surrounded by fibrin and organizing tissue, which are signs of inflammatory reaction within the vessel. Scale bars = 400 μm. (a and b, hematoxylin-eosin stain; original magnification, ×25.) (c and d, Masson trichrome stain; original magnification, ×100 for c and ×400 for d.)
Figure 8d:
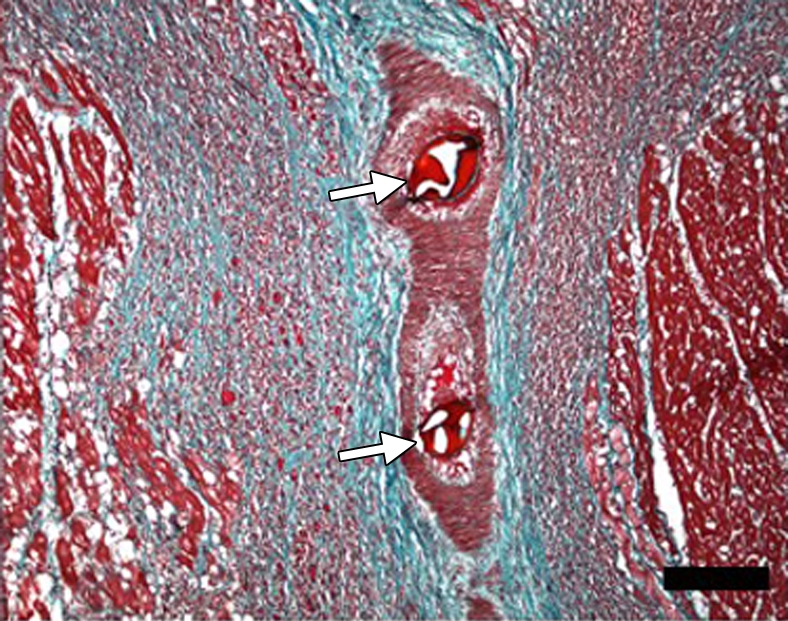
(a–d) Histologic slices obtained from the microinfarcted territory show microinfarction (I) surrounded by viable myocardium (V) and embolic agents (arrows) obstructing microvessels. (a) Several embolic agents are shown inside a vessel surrounded by microinfarction. (b) Stripes of infarcted tissue with inflammatory cells from the epicardium (left bottom corner) to the endocardium (out of field at right). (c) A thin stripe of healing microinfarction extends from epicardial surface (top right) to endocardium (bottom left) where the microinfarction is broader. (d) A longitudinally cut vessel with two embolic agents is surrounded by fibrin and organizing tissue, which are signs of inflammatory reaction within the vessel. Scale bars = 400 μm. (a and b, hematoxylin-eosin stain; original magnification, ×25.) (c and d, Masson trichrome stain; original magnification, ×100 for c and ×400 for d.)
DISCUSSION
The main findings of this experimental study were (a) coronary microembolization causes acute and subacute hypoperfusion detectable on first-pass perfusion MR images after coronary intervention; (b) DE MR imaging can help visualize and reliably quantify subacute, but not acute, microinfarction; (c) the magnitude of LV dysfunction after microembolization is not closely related to the extents of microinfarction or hypoperfused territory; and (d) a blood pool contrast agent did not help detect acute microinfarction on DE MR images. To our knowledge, this study was the first to evaluate the capability of the combination of first-pass perfusion and DE MR imaging in the detection and quantification of the extent of microinfarction caused by coronary microembolization.
Several clinical studies (1–7,26) showed the importance and the high incidence of microinfarction in patients undergoing coronary intervention. A recent study (36) showed that thrombus aspiration during percutaneous coronary intervention reduced microembolization and hence microinfarction. The rationale for performing imaging immediately after microembolization in our study was to examine the potential of first-pass perfusion and DE MR imaging in the detection of the early effects of coronary microembolization. The findings suggest that coronary microembolization observed after acute coronary syndrome, percutaneous coronary intervention, and coronary artery bypass graft surgery can be detected with the combined use of first-pass perfusion and DE MR imaging.
First-Pass Perfusion Imaging in Embolized Myocardium
Coronary catheterization and territory mapping have been previously addressed with an MR imaging–guided technique (37). In our study, we demonstrated the applicability of an x-ray and MR imaging system in mapping the spatial extent of LAD territory at baseline and after delivery of an embolic agent, as well as microinfarction size. Nuclear medicine has also been used in assessing myocardial perfusion after coronary intervention (38). Unlike detection with contrast-enhanced MR imaging, detection of myocardial perfusion by using a technetium 99m tracer requires both flow and cellular metabolic activity. Contrast-enhanced MR imaging does not require cellular uptake of contrast material and can help evaluate resting perfusion in occlusive and reperfused infarction (28).
The persistent decline in perfusion of the embolized territory was detected on first-pass MR images at 1 hour and at 1 week and was most likely related to microvascular obstruction by the embolic agent and interstitial edema. The improvement in perfusion at 1 week may be related to edema resorption associated with acute microinfarction. A study (35) in an open-chest dog model showed that microembolization causes immediate increase in coronary blood flow after delivery of embolic agents with particles less than 300 μm in diameter. This acute effect was probably due to the hyperemia of nonoccluded vessels in the adjacent area of ischemic foci caused by adenosine release from the ischemic myocardium (9,39). Other explanations for the difference in perfusion response could be related to the size and number of particles of the embolic agent and/or species variation (39–41). The decreased perfusion in our MR imaging study confirms previous acute electron-beam computed tomographic (CT) measurements after the delivery of an embolic agent with 100-μm-diameter particles in swine (40). Humans and pigs have poor collateral circulation compared with dogs (40,42), which may be crucial to the response to microembolic events.
DE MR Imaging of Microinfarction
Clinical studies (2,7,25,26) have previously involved DE MR imaging to help visualize discrete microinfarction in patients who exhibit elevation of myocardial ischemic markers after percutaneous coronary intervention. In our experimental study, the appearance of microinfarction on DE MR images was similar to that observed in these studies but differed from contiguous large infarction. Microinfarction was observed as patchy and striped hyperenhanced regions on DE MR images in beating and nonbeating hearts. It varied in size and was distributed throughout the transmural extent of the embolized territory. This patchy pattern was described with histopathologic findings after delivery of a 100-μm-particle embolic agent in swine (40). The striped microinfarction pattern is in line with the architecture of coronary arteries seen in humans (43) and dogs (44). Possible causes of the variability of the microinfarction sizes are (a) clustering of the injected embolic agent as seen with histopathologic results, (b) asymmetrical branching geometry of the coronary vessels, and (c) adjacent arterioles being occluded by the embolic agents.
The present study involved the comparison of DE MR imaging in beating hearts, high-spatial-resolution DE MR imaging in nonbeating hearts, and TTC staining for quantification of microinfarction at 1 week. Close correlation and low bias between the techniques were shown with regression analysis and the Bland-Altman test. These findings indicate that DE MR imaging can depict and reliably help quantify the extent of microinfarction at 1 week, but not at 1 hour, after coronary intervention. The patchy hyperenhanced microinfarction at 1 hour was smaller than that at 1 week on DE MR images, which suggests that injured myocytes maintained their integrity at 1 hour. Klein et al (45) found that ischemic cell death in swine starts in the jeopardized LV after about 30 minutes of ischemia. After 75 minutes of ischemia, most of the myocytes at risk were irreversibly injured. Infarctions reached their final extent after 90–120 minutes of ischemia. Interestingly, our study showed that first-pass perfusion MR imaging can depict the perfusion deficit caused by microembolization, even at this early stage. Our findings are also in line with those of a preliminary report (46), in which DE MR images did not show microinfarction 2 hours after microembolization. However, expansion of microinfarction cannot be excluded in our study (8).
Microinfarction was most likely the cause of the persistent decline in EF. However, there was no correlation between the EF and the extents of patchy hyperenhanced myocardium or hypoperfused territory. Other investigators (47) also found a lack of correlation between regional function, by using electron-beam CT in beating hearts, and microinfarction volume, by using micro-CT in the excised hearts. This mismatch was attributed to the presence of inflammation, mediated by tumor necrosis factor–α around the microinfarcted region (periinfarction zone) (9,10,48–50).
Analysis of Histopathologic Results
Histopathologic examination findings revealed that embolic agents caused microinfarction by mechanical occlusion of microvessels. The patchy and striped pattern of hyperenhancement seen on DE MR images was confirmed at histochemical and histopathologic staining. The combination of inflammatory cells and thrombi inside the blood vessels in subacute microinfarction may contribute to LV dysfunction (9,10,48–50). The pattern of microinfarction crossing the LV wall was similar to that observed at autopsy in patients with coronary microembolization (43,51). Therefore, this animal model may be suitable for assessing the effects of gene and stem cell therapy.
Study Limitations
Higher spatial resolution was needed to delineate individual microinfarction caused by obstruction of a single microvessel. The number of animals was relatively limited (n = 6), which may explain a lack of correlation between the extent of microinfarction and decrease in EF. The sizes of particles of the embolic agent were between 100 and 300 μm to obstruct medium-size blood vessels. Synthetic embolic agents, not biological particles, were used in this study, which may provide different inflammatory responses in the myocardium. The long-term effect of microinfarction on perfusion and LV function was not addressed and needs further investigation by using different particle sizes of embolic agents. Another limitation of this study was the use of blood pool contrast agent only for DE MR imaging and not for first-pass perfusion imaging.
Clinical Implications
The complementary use of perfusion and DE MR imaging may be helpful in early documentation of coronary microembolization in patients after acute coronary syndrome, percutaneous coronary intervention, and coronary artery bypass graft surgery. This noninvasive diagnostic method can also be used to evaluate newly developed stents and therapies designed to prevent the formation of microinfarction.
In conclusion, coronary microembolization caused persistent decline in myocardial perfusion measured on first-pass perfusion imaging. DE MR imaging has the potential to help reliably quantify subacute microinfarction. The magnitude of LV dysfunction was not related to the extents of microinfarction or hypoperfused territory.
ADVANCES IN KNOWLEDGE
Coronary microembolization causes acute and subacute hypoperfusion that is detectable on first-pass MR images.
Delayed-enhanced (DE) MR imaging can help visualize and reliably quantify subacute, but not acute, microinfarction.
The magnitude of left ventricular (LV) dysfunction after microembolization is not closely related to the extents of microinfarction or hypoperfused territory, which suggests other factors may play a part in the decline of LV function.
IMPLICATION FOR PATIENT CARE
The immediate effect of coronary microembolization on regional myocardial perfusion can be detected by using first-pass MR perfusion imaging, but the immediate effect of coronary microembolization on myocardial viability cannot be detected by using DE MR imaging.
Acknowledgments
We acknowledge Carol Stillson, BA, and Loi Do, BS, for helping with the experimentation.
Abbreviations
DE = delayed enhanced
EF = ejection fraction
LAD = left anterior descending coronary artery
LV = left ventricle
TTC = triphenyltetrazolium chloride
Author contributions: Guarantor of integrity of entire study, M.S.; study concepts/study design or data acquisition or data analysis/interpretation, all authors; manuscript drafting or manuscript revision for important intellectual content, all authors; manuscript final version approval, all authors; literature research, M.C., M.S.; experimental studies, all authors; statistical analysis, M.C.,
See also Science to Practice in this issue.
Authors stated no financial relationship to disclose.
Funding: This work supported by a National Institutes of Health grant (no. RO1HL072956).
References
- 1.Anderson JL, Adams CD, Antman EM, et al. ACC/AHA 2007 guidelines for the management of patients with unstable angina/non-ST-Elevation myocardial infarction: a report of the American College of Cardiology/American Heart Association Task Force on Practice Guidelines (Writing Committee to Revise the 2002 Guidelines for the Management of Patients With Unstable Angina/Non-ST-Elevation Myocardial Infarction) developed in collaboration with the American College of Emergency Physicians, the Society for Cardiovascular Angiography and Interventions, and the Society of Thoracic Surgeons endorsed by the American Association of Cardiovascular and Pulmonary Rehabilitation and the Society for Academic Emergency Medicine. J Am Coll Cardiol 2007;50:e1–e157. [DOI] [PubMed] [Google Scholar]
- 2.Porto I, Selvanayagam JB, Van Gaal WJ, et al. Plaque volume and occurrence and location of periprocedural myocardial necrosis after percutaneous coronary intervention: insights from delayed-enhancement magnetic resonance imaging, thrombolysis in myocardial infarction myocardial perfusion grade analysis, and intravascular ultrasound. Circulation 2006;114:662–669. [DOI] [PubMed] [Google Scholar]
- 3.Kotani J, Nanto S, Mintz GS, et al. Plaque gruel of atheromatous coronary lesion may contribute to the no-reflow phenomenon in patients with acute coronary syndrome. Circulation 2002;106:1672–1677. [DOI] [PubMed] [Google Scholar]
- 4.Topol EJ, Yadav JS. Recognition of the importance of embolization in atherosclerotic vascular disease. Circulation 2000;101:570–580. [DOI] [PubMed] [Google Scholar]
- 5.Henriques JP, Zijlstra F. Frequency and sequelae of ST elevation acute myocardial infarction caused by spontaneous distal embolization from unstable coronary lesions. Am J Cardiol 2003;91:708–711. [DOI] [PubMed] [Google Scholar]
- 6.Henriques JP, Zijlstra F, Ottervanger JP, et al. Incidence and clinical significance of distal embolization during primary angioplasty for acute myocardial infarction. Eur Heart J 2002;23:1112–1117. [DOI] [PubMed] [Google Scholar]
- 7.Selvanayagam JB, Cheng AS, Jerosch-Herold M, et al. Effect of distal embolization on myocardial perfusion reserve after percutaneous coronary intervention: a quantitative magnetic resonance perfusion study. Circulation 2007;116:1458–1464. [DOI] [PubMed] [Google Scholar]
- 8.Yellon DM, Hausenloy DJ. Myocardial reperfusion injury. N Engl J Med 2007;357:1121–1135. [DOI] [PubMed] [Google Scholar]
- 9.Dorge H, Neumann T, Behrends M, et al. Perfusion-contraction mismatch with coronary microvascular obstruction: role of inflammation. Am J Physiol Heart Circ Physiol 2000;279:H2587–H2592. [DOI] [PubMed] [Google Scholar]
- 10.Dorge H, Schulz R, Belosjorow S, et al. Coronary microembolization: the role of TNF-alpha in contractile dysfunction. J Mol Cell Cardiol 2002;34:51–62. [DOI] [PubMed] [Google Scholar]
- 11.Canton M, Skyschally A, Menabo R, et al. Oxidative modification of tropomyosin and myocardial dysfunction following coronary microembolization. Eur Heart J 2006;27:875–881. [DOI] [PubMed] [Google Scholar]
- 12.Skyschally A, Schulz R, Erbel R, Heusch G. Reduced coronary and inotropic reserves with coronary microembolization. Am J Physiol Heart Circ Physiol 2002;282:H611–H614. [DOI] [PubMed] [Google Scholar]
- 13.Jerosch-Herold M, Wilke N, Wang Y, et al. Direct comparison of an intravascular and an extracellular contrast agent for quantification of myocardial perfusion. Cardiac MRI Group. Int J Card Imaging 1999;15:453–464. [DOI] [PubMed] [Google Scholar]
- 14.Saeed M, Weber O, Lee R, et al. Discrimination of myocardial acute and chronic (scar) infarctions on delayed contrast enhanced magnetic resonance imaging with intravascular magnetic resonance contrast media. J Am Coll Cardiol 2006;48:1961–1968. [DOI] [PubMed] [Google Scholar]
- 15.Wilke N, Simm C, Zhang J, et al. Contrast-enhanced first pass myocardial perfusion imaging: correlation between myocardial blood flow in dogs at rest and during hyperemia. Magn Reson Med 1993;29:485–497. [DOI] [PubMed] [Google Scholar]
- 16.Wilke N, Jerosch-Herold M, Wang Y, et al. Myocardial perfusion reserve: assessment with multisection, quantitative, first-pass MR imaging. Radiology 1997;204:373–384. [DOI] [PubMed] [Google Scholar]
- 17.Saeed M, Wendland MF, Lauerma K, et al. First-pass contrast-enhanced inversion recovery and driven equilibrium fast GRE imaging studies: detection of acute myocardial ischemia. J Magn Reson Imaging 1995;5:515–523. [DOI] [PubMed] [Google Scholar]
- 18.Kim RJ, Fieno DS, Parrish TB, et al. Relationship of MRI delayed contrast enhancement to irreversible injury, infarct age, and contractile function. Circulation 1999;100:1992–2002. [DOI] [PubMed] [Google Scholar]
- 19.Saeed M, Bremerich J, Wendland MF, Wyttenbach R, Weinmann HJ, Higgins CB. Reperfused myocardial infarction as seen with use of necrosis-specific versus standard extracellular MR contrast media in rats. Radiology 1999;213:247–257. [DOI] [PubMed] [Google Scholar]
- 20.Simonetti OP, Kim RJ, Fieno DS, et al. An improved MR imaging technique for the visualization of myocardial infarction. Radiology 2001;218:215–223. [DOI] [PubMed] [Google Scholar]
- 21.Bloomgarden DC, Fayad ZA, Ferrari VA, Chin B, Sutton MG, Axel L. Global cardiac function using fast breath-hold MRI: validation of new acquisition and analysis techniques. Magn Reson Med 1997;37:683–692. [DOI] [PubMed] [Google Scholar]
- 22.Lorenz CH, Walker ES, Morgan VL, Klein SS, Graham TP Jr. Normal human right and left ventricular mass, systolic function, and gender differences by cine magnetic resonance imaging. J Cardiovasc Magn Reson 1999;1:7–21. [DOI] [PubMed] [Google Scholar]
- 23.Arheden H, Saeed M, Higgins CB, et al. Measurement of the distribution volume of gadopentetate dimeglumine at echo-planar MR imaging to quantify myocardial infarction: comparison with 99mTc-DTPA autoradiography in rats. Radiology 1999;211:698–708. [DOI] [PubMed] [Google Scholar]
- 24.Kim RJ, Chen EL, Lima JA, Judd RM. Myocardial Gd-DTPA kinetics determine MRI contrast enhancement and reflect the extent and severity of myocardial injury after acute reperfused infarction. Circulation 1996;94:3318–3326. [DOI] [PubMed] [Google Scholar]
- 25.Ricciardi MJ, Wu E, Davidson CJ, et al. Visualization of discrete microinfarction after percutaneous coronary intervention associated with mild creatine kinase-MB elevation. Circulation 2001;103:2780–2783. [DOI] [PubMed] [Google Scholar]
- 26.Selvanayagam JB, Porto I, Channon K, et al. Troponin elevation after percutaneous coronary intervention directly represents the extent of irreversible myocardial injury: insights from cardiovascular magnetic resonance imaging. Circulation 2005;111:1027–1032. [DOI] [PubMed] [Google Scholar]
- 27.Sato H, Iida H, Tanaka A, et al. The decrease of plaque volume during percutaneous coronary intervention has a negative impact on coronary flow in acute myocardial infarction: a major role of percutaneous coronary intervention-induced embolization. J Am Coll Cardiol 2004;44:300–304. [DOI] [PubMed] [Google Scholar]
- 28.Taylor AJ, Al-Saadi N, Abdel-Aty H, et al. Elective percutaneous coronary intervention immediately impairs resting microvascular perfusion assessed by cardiac magnetic resonance imaging. Am Heart J 2006;151:891.e1–891.e7. [DOI] [PubMed] [Google Scholar]
- 29.Herrmann J, Haude M, Lerman A, et al. Abnormal coronary flow velocity reserve after coronary intervention is associated with cardiac marker elevation. Circulation 2001;103:2339–2345. [DOI] [PubMed] [Google Scholar]
- 30.Krombach GA, Higgins CB, Chujo M, Saeed M. Gadomer-enhanced MR imaging in the detection of microvascular obstruction: alleviation with nicorandil therapy. Radiology 2005;236:510–518. [DOI] [PubMed] [Google Scholar]
- 31.National Research Council. Guide for the care and use of laboratory animals. 7th ed. Washington DC: National Academy Press, 1996.
- 32.Baumgart D, Liu F, Haude M, Gorge G, Ge J, Erbel R. Acute plaque rupture and myocardial stunning in patient with normal coronary arteriography. Lancet 1995;346:193–194. [PubMed] [Google Scholar]
- 33.Bahrmann P, Werner GS, Heusch G, et al. Detection of coronary microembolization by Doppler ultrasound in patients with stable angina pectoris undergoing elective percutaneous coronary interventions. Circulation 2007;115:600–608. [DOI] [PubMed] [Google Scholar]
- 34.Heiberg E, Wigström L, Carlsson M, Bolger AF, Karlsson M. Time resolved three-dimensional automated segmentation of the left ventricle. Proc IEEE Comput Cardiol 2005;32:599–602. [Google Scholar]
- 35.Lund GK, Stork A, Saeed M, et al. Acute myocardial infarction: evaluation with first-pass enhancement and delayed enhancement MR imaging compared with 201Tl SPECT imaging. Radiology 2004;232:49–57. [DOI] [PubMed] [Google Scholar]
- 36.Svilaas T, Vlaar PJ, van der Horst IC, et al. Thrombus aspiration during primary percutaneous coronary intervention. N Engl J Med 2008;358:557–567. [DOI] [PubMed] [Google Scholar]
- 37.Omary RA, Green JD, Schirf BE, Li Y, Finn JP, Li D. Real-time magnetic resonance imaging-guided coronary catheterization in swine. Circulation 2003;107:2656–2659. [DOI] [PubMed] [Google Scholar]
- 38.Fram DB, Azar RR, Ahlberg AW, et al. Duration of abnormal SPECT myocardial perfusion imaging following resolution of acute ischemia: an angioplasty model. J Am Coll Cardiol 2003;41:452–459. [DOI] [PubMed] [Google Scholar]
- 39.Hori M, Inoue M, Kitakaze M, et al. Role of adenosine in hyperemic response of coronary blood flow in microembolization. Am J Physiol 1986;250:H509–H518. [DOI] [PubMed] [Google Scholar]
- 40.Mohlenkamp S, Beighley PE, Pfeifer EA, Behrenbeck TR, Sheedy PF 2nd, Ritman EL. Intramyocardial blood volume, perfusion and transit time in response to embolization of different sized microvessels. Cardiovasc Res 2003;57:843–852. [DOI] [PubMed] [Google Scholar]
- 41.Herzberg RM, Rubio R, Berne RM. Coronary occlusion and embolization: effect on blood flow in adjacent arteries. Am J Physiol 1966;210:169–175. [DOI] [PubMed] [Google Scholar]
- 42.Schaper W. The collateral circulation of the heart. Amsterdam, the Netherlands: North Holland Publishing, 1971.
- 43.Falk E. Unstable angina with fatal outcome: dynamic coronary thrombosis leading to infarction and/or sudden death—autopsy evidence of recurrent mural thrombosis with peripheral embolization culminating in total vascular occlusion. Circulation 1985;71:699–708. [DOI] [PubMed] [Google Scholar]
- 44.Bassingthwaighte JB, Yipintsoi T, Harvey RB. Microvasculature of the dog left ventricular myocardium. Microvasc Res 1974;7:229–249. [DOI] [PMC free article] [PubMed] [Google Scholar]
- 45.Klein HH, Schubothe M, Nebendahl K, Kreuzer H. Temporal and spatial development of infarcts in porcine hearts. Basic Res Cardiol 1984;79:440–447. [DOI] [PubMed] [Google Scholar]
- 46.Nassenstein K, Breuckmann F, Konietzka I, et al. Cardiac magnetic resonance imaging permits visualization of coronary microembolization in swine [abstr]. In: Proceedings of the Fifteenth Meeting of the International Society for Magnetic Resonance in Medicine. Berkeley, Calif: International Society for Magnetic Resonance in Medicine, 2007; 2556.
- 47.Malyar NM, Lerman LO, Gossl M, Beighley PE, Ritman EL. Relation of nonperfused myocardial volume and surface area to left ventricular performance in coronary microembolization. Circulation 2004;110:1946–1952. [DOI] [PubMed] [Google Scholar]
- 48.Skyschally A, Gres P, Hoffmann S, et al. Bidirectional role of tumor necrosis factor-alpha in coronary microembolization: progressive contractile dysfunction versus delayed protection against infarction. Circ Res 2007;100:140–146. [DOI] [PubMed] [Google Scholar]
- 49.Skyschally A, Haude M, Dorge H, et al. Glucocorticoid treatment prevents progressive myocardial dysfunction resulting from experimental coronary microembolization. Circulation 2004;109:2337–2342. [DOI] [PubMed] [Google Scholar]
- 50.Thielmann M, Dorge H, Martin C, et al. Myocardial dysfunction with coronary microembolization: signal transduction through a sequence of nitric oxide, tumor necrosis factor-alpha, and sphingosine. Circ Res 2002;90:807–813. [DOI] [PubMed] [Google Scholar]
- 51.Davies MJ, Thomas AC, Knapman PA, Hangartner JR. Intramyocardial platelet aggregation in patients with unstable angina suffering sudden ischemic cardiac death. Circulation 1986;73:418–427. [DOI] [PubMed] [Google Scholar]


