

Abstract
Objective
To compare the distribution of lipid and glucose abnormalities and altered fat distribution among vertically HIV-infected subjects and controls.
Design
Cross-sectional multicenter study in HIV-infected (HIVpos) subjects 7-24 years, stratified by Tanner stage and protease inhibitor (PI) use (PI; N=161 and non-PI; N=79) and seronegative controls (HIVneg; N=146).
Methods
Measurements included fasting lipids, glucose, insulin, 2-h oral glucose tolerance test, dual-energy X-ray absorptiometry, anthropometry, and ART and medical histories. Multiple linear regression models were used to compare distributions between HIVpos and HIVneg.
Results
Both HIVpos groups had long exposures to ART. PI and non-PI had similar current CD4 count and HIV RNA, but PI had lower nadir CD4, higher peak HIV RNA, and more advanced CDC disease stage. In adjusted analyses, both HIVpos groups had significantly lower mean z-scores for height, weight, BMI, and total and limb fat, compared with HIVneg. Mean triglycerides were significantly higher and HDL cholesterol lower in both HIVpos groups relative to HIVneg. PI also had significantly higher mean total, LDL, and non-HDL cholesterol. Mean fasting insulin was higher in both HIVpos groups, and 2-h glucose and insulin were higher in the PI group. Ritonavir was associated with increasing dyslipidemia and altered glucose metabolism.
Conclusions
In a large group of vertically-infected children/youth with extensive ART exposure, height, weight, and total and limb fat were lower than in controls. There was a high prevalence of lipid abnormalities among those on PI and evidence of developing insulin resistance, factors that may accelerate lifetime risk for cardiovascular disease.
Background
The use of combination antiretroviral therapy (ART) drastically reduces the mortality and morbidity associated with HIV infection[1-5] but is often associated with metabolic alterations involving glucose and dyslipidemia, and abnormalities in body fat distribution, including subcutaneous fat loss and/or central fat accumulation [6]. These alterations are likely a result of complex interactions between HIV infection, specific antiretroviral agents, race, gender and age, as well as host genetic and lifestyle factors[7]. The resemblance of these alterations to metabolic syndrome further complicates the analysis, as rates of childhood obesity and type 2 diabetes mellitus increase[8-11].
For children facing the prospects of life-long treatment with ART, the development of these complications is of particular concern. There are limited pediatric data on the prevalence of these abnormalities. Estimates range from 1 to 68% in studies with small numbers of subjects or lacking appropriate comparison groups[12-28]. The inclusion of appropriate controls is important since many HIV- infected children belong to racial/ethnic groups with high background rates of obesity, cardiovascular disease (CVD) and diabetes. Body composition varies with age, gender and race, and pubertal development unmasks lipid and glucose abnormalities in both HIV negative and positive children[29-31]. HIV is associated with delayed puberty, and children are often smaller and shorter than their peers, further complicating direct comparison. The objective of this study was to compare the distribution of morphologic and metabolic outcomes in two groups of vertically HIV-infected (HIVpos) children and youth on ART (protease inhibitor [PI] users and non-PI users), with those in a group of HIV-uninfected (HIVneg) controls of similar gender, race, and Tanner stage.
Methods
Study design and selection of participants
This cross-sectional study used a stratified sampling design to select a representative sample of HIVpos children/youth aged 7–24 years across six strata defined by PI use (PI: currently on the same PI at least 12 months; non-PI: currently on ART but less than two weeks lifetime exposure to PIs) and Tanner stage (Tanner 1, 2-3, and 4-5). Participants were selected at 37 Pediatric AIDS Clinical Trials Group (PACTG) sites. Probabilities to determine if a child would be invited to enroll in the study were generated for each stratum based on the estimated number of eligible children/youth, a sample size of 50, and an expected 25% refusal/ineligibility rate.
The comparison population comprised 50 HIVneg children/youth enrolled into each of the three Tanner strata with gender and race/ethnicity distributions similar to those of the first 100 HIVpos subjects enrolled. This was a form of group-matching, rather than individual matching. The institutional review board at each clinical site approved the study and appropriate informed consent was obtained before enrollment.
Measurements
Anthropometry
Height, weight, and waist and hip circumferences were measured using standard techniques[32]. Study coordinators underwent standardized training and were required to show proficiency before performing measurements.
Dual energy X-ray Absorptiometry (DXA)
Whole body scans were performed to assess total lean body mass (LBM) and fat, and limb (arm+leg) and trunk fat. All scans were analyzed at Tufts University without knowledge of HIV status or PI use. A standard phantom was scanned on all DXA instruments used in the study.
Laboratory
Subjects fasted ≥8 hours before collection of samples for measurement of triglycerides, total, LDL, HDL, and non-HDL cholesterol (LDL-C, HDL-C, non-HDL-C) high sensitivity C-reactive protein (hsCRP), and lactate. A 2-hour oral glucose tolerance test (OGTT) was administered according to WHO guidelines-[33]. Glucose, insulin, proinsulin, and C-peptide were measured at baseline and 2 hours. The homeostasis model assessment of insulin resistance (HOMA-IR) was calculated using fasting glucose and insulin [34] .
All specimens were stored at -70°C, batched, and analyzed centrally (Quest Diagnostics, Baltimore, MD or Quest Diagnostics Nichols Institute, Chantilly, VA) at the end of the study. Plasma HIV-1 RNA levels (Monitor UltraSensitive Assay, Roche Molecular Diagnostics, Branchberg, NJ) and CD4 T cell counts were measured locally.
Disease history and other clinical data
Disease and ART history were collected by chart abstraction and interview. Dietary intake was evaluated using the Block Food Frequency Questionnaire (NutritionQuest, Berkeley, CA). Exercise data were collected by questionnaire in which subjects were asked if they exercised regularly, with ‘regularly’ defined as more than once a week.
Statistical methods
Standardization of measures
To account for the effects of age and gender, measurements were standardized using the HIVneg group as the reference population. For each body composition measure, local regression (LOESS) lines[35] were fit across age for HIVneg with a smoothing parameter of 90%. Lines were fit separately by gender up to18 years of age only, because few subjects over 18. Using the predicted mean outcome at a given age, a Z-score could then be calculated. A Z-score of “0” on this scale corresponds to the mean of the P1045 HIVneg participants for a given age and gender. To check if results were sensitive to the analytic scale, model-fitting was repeated using Z-scores calculated from available NHANES IV outcomes[36]. Conclusions were similar so results are presented using the LOESS-generated Z-scores based on our HIVneg. Laboratory outcomes were log10 transformed when used in multivariate analyses.
Unadjusted analyses
Unadjusted pairwise comparisons were done across strata using Fisher’s exact test for categorical outcomes and Wilcoxon rank sum tests for continuous outcomes. Median age at initiation of puberty (moving from Tanner stage 1 to 2), was estimated using Turnbull’s algorithm[37] and compared using an exponential survival model.
Adjusted analyses
Multiple linear regression models were used to test for differences in each HIVpos group compared to HIVneg adjusted for potential confounders including race/ethnicity, Tanner stage, CDC disease category (HIVneg set to N/A), gender and CDC BMI z-scores[38] (for laboratory outcomes) and height Z-scores (for circumferences and body fat), excluding Z-scores < -3 or > 3 and laboratory outcomes <2nd or >98th percentile. Predicted mean Z-scores were calculated for each HIV/PI group at selected levels of each determinant in the model.
Association of ART with outcomes in HIVpos
We used multivariate linear regression models to evaluate the effect of time on specific nucleoside reverse transcriptase inhibitors (NRTIs), non-nucleoside reverse transcriptase inhibitors (NNRTIs) and PIs on each outcome in the HIV-pos subjects, adjusted for the confounders listed above. Medication exposure was modeled as years on each of the following medications in the participant’s current regimen: ZDV, ddI, d4T, 3TC, nevirapine, lopinavir, ritonavir, nelfinavir, saquinavir. There were too few participants on other ARVs, so these were grouped into an ‘other’ category by class. Within each class, the medication with the longest duration of use defined the exposure time. Backwards selection was used to find the most parsimonious set of ART predictors for each outcome. As each individual drug was dropped from the model, the ‘other’ category was updated to the maximum time of that drug or any other drug in that class. If no individual ARVs were significant predictors, the simplest possible model would include a covariate for longest time on each drug class.
We report Wald p-values for the regression models using p<0.05 to highlight specific comparisons, but it should be recognized that with the large number of outcomes and comparisons, some statistically significant results would be expected by chance. All analyses were conducted using Statistical Analysis Software (SAS Institute, Version 9.0, Cary, NC).
Results
Subject Characteristics
396 children/youth enrolled from January 2004 to July 2005. Only 55% of the targeted enrollment was achieved in the non-PI group. Five individuals were ineligible and five either withdrew consent or did not complete any study requirements, leaving 386 evaluable participants (161 PI, 79 non-PI, 146 HIVneg).
Distributions for most demographic, lifestyle and nutritional characteristics were similar across groups (Table 1). Median age of non-PI was greater than HIVneg (p=0.033). Both HIVpos groups tended to have an older estimated median age at initiation of puberty, but the differences were significant only for males on PI (p=0.047). Groups were similar in the proportion of participants exercising regularly, hours spent watching television and with family histories diabetes, coronary heart disease and lipid disorders. Median levels of energy or macronutrient intake were also similar.
Table 1.
Demographic and selected nutrition and lifestyle characteristics by HIV status and PI use
| HIV-uninfected | HIV-infected | p-value 1 | ||||||
|---|---|---|---|---|---|---|---|---|
| Characteristic | Level | HIVneg (n=146) |
HIVpos (n=240) |
PI (n=161) |
Non PI (n=79) |
HIVpos vs HIVneg |
PI vs HIVneg |
Non PI vs HIVneg |
| Gender (N, %) 2 | Male | 84 (57.5) | 127 (52.9) | 90 (55.9) | 37 (46.8) | 0.400 | 0.818 | 0.161 |
| Race/ethnicity (N, %) | White non-Hisp. | 17 (11.6) | 27 (11.3) | 16 (9.9) | 11 (13.9) | 0.955 | 0.729 | 0.775 |
| Black non-Hisp. | 80 (54.8) | 131 (54.6) | 87 (54.0) | 44 (55.7) | ||||
| Hispanic | 46 (31.5) | 78 (32.5) | 56 (34.8) | 22 (27.8) | ||||
| Other | 3 (2.1) | 4 (1.7) | 2 (1.2) | 2 (2.5) | ||||
| Tanner stage (N, %) | 1 | 47 (32.2) | 70 (29.2) | 52 (32.3) | 18 (22.8) | 0.734 | 0.928 | 0.293 |
| 2-3 | 50 (34.2) | 91 (37.9) | 58 (36.0) | 33 (41.8) | ||||
| 4-5 | 49 (33.6) | 79 (32.9) | 51 (31.7) | 28 (35.4) | ||||
| Age (median) | 11.9 | 12.6 | 12.4 | 12.9 | 0.053 | 0.170 | 0.033 | |
| Estimated median age (yrs) at initiation of puberty |
Male | 10.3 | 11.1 | 10.9 | 11.1 | 0.041 | 0.047 | 0.361 |
| Female | 9.5 | 9.8 | 10.1 | 9.7 | 0.721 | 0.639 | 0.925 | |
| Exercise regularly3 (N, %) |
Yes | 80 (57.6) | 138 (58.0) | 90 (56.3) | 48 (61.5) | 1.000 | 0.907 | 0.666 |
| Hours TV/wk (N, %) | 1-6 hrs/wk | 15 (10.5) | 24 (10.3) | 17 (10.9) | 7 (9.0) | 0.858 | 0.741 | 0.956 |
| 1 -3 hrs/day | 78 (54.6) | 134 (57.3) | 91 (58.3) | 43 (55.1) | ||||
| ≥ 3 hrs/day | 50 (35.0) | 76 (32.5) | 48 (30.8) | 28 (35.9) | ||||
| Smoking (N, %) | Yes | 2 (1.4) | 7 (3.0) | 5 (3.2) | 2 (2.6) | 0.492 | 0.450 | 0.614 |
| Calories (Kcal/kg) (median) | 57.8 | 59.4 | 58.5 | 64.1 | 0.211 | 0.330 | 0.223 | |
| Protein (g/kg) (median) | 1.9 | 2.0 | 2.0 | 2.2 | 0.223 | 0.376 | 0.197 | |
| Fat (g/kg) (median) | 2.2 | 2.5 | 2.5 | 2.7 | 0.187 | 0.358 | 0.143 | |
| Carbohydrate (g/kg) (median) | 7.2 | 7.5 | 7.4 | 7.7 | 0.374 | 0.461 | 0.431 | |
| Family history (%) | Type I diabetes | 13.1 | 10.3 | 11.2 | 8.3 | 0.475 | 0.704 | 0.466 |
| Type II diabetes | 44.2 | 37.4 | 33.1 | 46.7 | 0.245 | 0.074 | 0.756 | |
| Coronary heart disease | 39.2 | 36.3 | 32.8 | 43.3 | 0.636 | 0.297 | 0.635 | |
| Lipid disorders | 28.9 | 26.1 | 26.5 | 25.4 | 0.604 | 0.775 | 0.726 | |
Fisher’s exact test for categorical and Wilcoxon rank sum test for continuous comparisons. Wald test based on exponential model for time to initiation of puberty
Percentages exclude subjects with missing data
Exercise regularly defined as more than once a week.
CD4 count and HIV-1 RNA levels were similar in PI and non-PI (Table 2). However, there was evidence of differences in past disease severity, with the PI group having lower median nadir CD4 counts (p<0.001), higher median peak HIV-1 RNA (p<0.001) and a higher proportion of participants in CDC disease category C than non-PI (p<0.001).
Table 2.
HIV disease status and current antiretroviral treatment exposure for HIVpos subjects
| Characteristic | Level | PI (n=161) |
Non PI (n=79) |
p-value 1 |
|---|---|---|---|---|
| Disease severity | ||||
| Current CD4 count (cells/mm3) (N, %) 2 | <200 | 5 (3.2) | 1 (1.3) | |
| 200-<500 | 38 (24.1) | 23 (29.9) | ||
| ≥500 | 115 (72.8) | 53 (68.8) | ||
| Median (10th, 90th %le) | 668 (305, 1149) | 640 (364, 1022) | 0.325 | |
| Current HIV-1 RNA (copies/ml) (N, %) | ≤400 | 89 (57.4) | 39 (50.0) | |
| >400 | 66 (42.6) | 39 (50.0) | ||
| Median (10th, 90th %le) | <400 (<400, 14236) | 410 (<400, 9650) | 0.336 | |
| Lowest CD4 count (cells/mm3) Median (10th, 90th %le) |
290 (38, 640) | 387 (147, 801) | <0.001 | |
| Highest HIV-1 RNA (copies/ml) Median (10th, 90th %le) |
156,000 (16836, >750000) | 34,972 (2600, 252522) | <0.001 | |
| CDC disease stage (N, %) | N/A | 52 (32.3) | 46 (58.2) | <0.001 |
| B | 68 (42.2) | 26 (32.9) | ||
| C | 41 (25.5) | 7 (8.9) |
| Current Antiretroviral Medication: | % | Median (yrs) |
% | Median (yrs) |
||
|---|---|---|---|---|---|---|
| Any NRTI | 97.5 | 8.0 | 100.0 | 8.1 | ||
| Stavudine (d4T) | 54.0 | 5.8 | 36.7 | 5.9 | ||
| Didanosine (ddI) | 32.9 | 5.0 | 31.6 | 7.6 | ||
| Lamivudine (3TC) | 43.5 | 5.1 | 68.4 | 6.0 | ||
| Zidovudine (ZDV) | 26.1 | 5.5 | 45.6 | 6.9 | ||
| Other NRTI3 | 18.6 | 2.1 | 20.3 | 2.9 | ||
| Any NNRTI | 32.3 | 5.0 | 45.6 | 3.1 | ||
| Nevirapine (NVP) | 16.8 | 5.7 | 10.1 | 5.2 | ||
| Efavirenz (EFZ) | 15.5 | 4.3 | 35.4 | 2.6 | ||
| Any PI | 100.0 | 5.9 | ||||
| Kaletra (KAL) | 31.1 | 2.4 | ||||
| Nelfinavir (NFV) | 39.8 | 5.8 | ||||
| Ritonavir (RTV) | 27.3 | 5.8 | ||||
| Saquinavir (SQV) | 9.9 | 4.5 | ||||
| Other PI4 | 12.4 | 2.4 | ||||
Wilcoxon rank sum test
Percentages exclude subjects with missing data
Includes Abacavir (15), Zalcitibine (1), Tenofovir (12), and others (<5)
Includes Indinavir (5), Amprenavir (7) and others (<8)
Both HIVpos groups had long histories of exposure to ART, with a median time since starting any ARVs of 9.9 and 9.0 years in PI and non-PI, respectively (p=0.050, data not shown). Participants in PI had a longer median exposure to NNRTIs in their current regimen (p=0.004), but exposure to NRTIs did not differ between the groups (p=0.973, Table 2). In PI, 109 (68%) participants were on NRTI/PI combinations, and 48 (30%) were on NRTI/NNRTI/PI combinations. Use of ritonavir in the current regimen, either as part of Kaletra® or in other regimens, was reported by 58% of subjects in PI. Forty-six percent of non-PI were on NRTI/NNRTI combination therapy and the rest were only on NRTIs.
Growth and body composition
Both HIVpos groups had lower mean Z-scores for height, weight and BMI, relative to HIVneg after adjusting for race/ethnicity, Tanner stage and CDC disease category (Fig. 1). Total and limb fat were lower in both HIVpos groups vs. HIVneg in adjusted models. Trunk fat tended to be lower, especially in non-PI, but the differences vs. HIVneg did not achieve statistical significance. The ratios of trunk-to-limb fat and waist-to-hip circumference were significantly greater in PI vs. HIVneg. LBM did not differ between groups.
Figure 1.
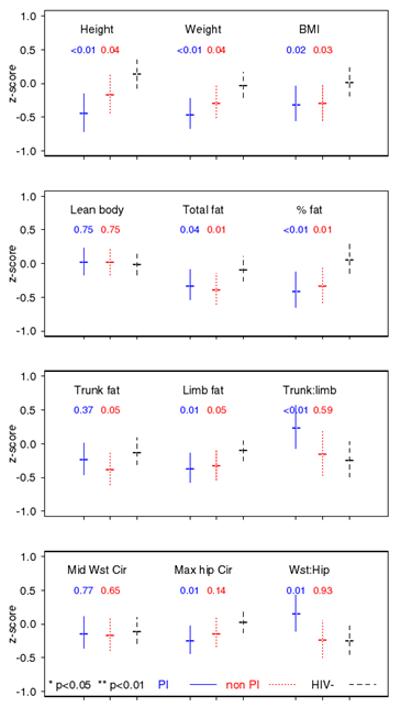
Anthropometric outcomes: predicted mean z-scores and 95% confidence intervals for a Black, CDC disease category A, Tanner 2-3, height z-score of 0 child in PI, nonPI and HIVneg groups. Statistical significance (p) shown for comparisons of PI and nonPI groups relative to HIVneg.
Serum lipids
PI differed significantly from HIVneg in models adjusted for race/ethnicity, Tanner stage, CDC disease category, gender and BMI z-scores, with higher mean levels of triglycerides, total, LDL, and non-HDL, and total to HDL-C ratio, and lower HDL-C (Table 3). In non-PI, mean triglycerides were higher and HDL-C lower, relative to HIVneg. When laboratory values were classified as normal/abnormal, using levels previously published in studies of children[39-41], the PI group had a higher prevalence of abnormal lipid values than HIVneg (total cholesterol >200 mg/dL: 29% vs. 10%, LDL-C >130 mg/dL: 19% vs. 6%, HDL-C <35 mg/dL: 10% vs. 4%, non HDL-C >160 mg/dL: 24% vs. 3% and triglycerides >130 mg/dL: 52% vs. 13%). Except for HDL-C, similar rates of abnormal lipid values were seen in nonPI and HIVneg.
Table 3.
Laboratory outcomes: Medians and adjusted comparisons between PI, non PI and HIVneg groups
| Median 1 | Adjusted p-value 2 | ||||
|---|---|---|---|---|---|
| OUTCOME | HIVneg | PI | Non PI | PI vs. HIVneg |
Non PI vs. HIVneg |
| Lipids | |||||
| Cholesterol (mg/dL) | 152.5 | 174.0 | 153.0 | 0.001 | 0.530 |
| LDL cholesterol (mg/dL) | 89.0 | 99.0 | 89.0 | 0.007 | 0.603 |
| HDL cholesterol (mg/dL) | 49.0 | 44.0 | 46.0 | <0.001 | 0.010 |
| non HDL cholesterol (mg/dL) | 104.5 | 130.0 | 109.0 | <0.001 | 0.756 |
| Triglycerides (mg/dL) | 66.5 | 134.0 | 82.0 | <0.001 | 0.002 |
| Cholesterol:HDL ratio | 3.1 | 4.0 | 3.3 | <0.001 | 0.122 |
| Glucose metabolism | |||||
| Fasting glucose (mg/dL) | 89.0 | 87.5 | 89.0 | 0.372 | 0.034 |
| Fasting Insulin (uU/mL) | 7.0 | 10.0 | 10.5 | 0.001 | 0.001 |
| Fasting C-peptide (ng/mL) | 2.0 | 2.3 | 2.2 | 0.067 | 0.110 |
| Fasting Proinsulin (pm/L) | 11.3 | 11.4 | 11.8 | 0.395 | 0.184 |
| HOMA-IR | 1.5 | 2.0 | 2.3 | 0.005 | 0.004 |
| 2-h glucose (mg/dL) | 95.5 | 104.0 | 96.0 | 0.006 | 0.639 |
| 2-h Insulin (uU/mL) | 39.0 | 40.0 | 34.5 | 0.020 | 0.884 |
| 2-h C-peptide (ng/mL) | 5.7 | 5.9 | 5.5 | 0.067 | 0.591 |
| 2-h Proinsulin (pm/L) | 39.7 | 43.8 | 38.2 | 0.604 | 0.848 |
| Other | |||||
| hs CRP (mg/L) | 0.5 | 0.6 | 0.6 | 0.354 | 0.490 |
| Plasma lactate (mg/dL) | 8.5 | 9.7 | 9.3 | 0.058 | 0.407 |
Median of raw untransformed values
p-values from linear regression on each laboratory value (log10-transformed) adjusted for gender, race/ethnicity, Tanner stratum, BMI z-score and CDC disease category. Values <2nd or >98th percentile excluded from models.
Glucose metabolism
Although median levels of fasting glucose did not differ, in adjusted analyses (Table 3), mean fasting glucose was marginally higher in non-PI relative to HIVneg. Fasting insulin and HOMA-IR had significantly higher adjusted means in both PI and non-PI compared to the HIVneg. Two-hour glucose and insulin levels were higher in PI, but not non-PI, compared to HIVneg. Values for other measures were similar across groups, although both fasting and 2-h C-peptide and lactate levels were marginally higher in the PI group relative to HIVneg. Rates of impaired fasting (100-125 mg/dL; 5% and 7%) and 2-hour glucose levels (140-199 mg/dL; 4% and 4%) in PI and non-PI were low and similar to HIVneg (7% and 1%). In the PI group, only 0.7% of fasting glucose values and 1.4% of 2-h glucose values met criteria[33] for diabetes. Rates of elevated lactate levels were low in all groups (HIVneg: 1%; non-PI: 3%; PI:1%). Although there were no differences in median hsCRP levels, twice as many subjects in PI had elevated hsCRP (>3 mg/L), compared with controls (HIVneg: 11%; non-PI: 14%; PI: 20%)
Relationship between current time on ART and outcomes
Use of ritonavir (in either therapeutic or boosting doses) and nelfinavir were significantly associated with most lipid measures (Table 4). For each year of ritonavir use, there were predicted increases of 2.5% in total cholesterol, 2.4% in LDL-C, 3.7% in non-HDL-C, and 7.7% in triglycerides. For each year of nelfinavir use, there were predicted increases of 1.5, 2.5, 2.3, and 3.3% in total cholesterol, LDL-C, non-HDL-C, and triglycerides, respectively. Nevirapine and efavirenz were associated with annual increases of 1.7% and 1.9% in HDL-C.
Table 4.
Predicted Change in Laboratory Outcomes Per Year of Current ARV Use
| OUTCOMES | PI | NRTI | NNRTI | ||||
|---|---|---|---|---|---|---|---|
| Lipids | |||||||
| Cholesterol | |||||||
| Total | Ritonavir 3 2.5 (1.3, 3.6 ) p<0.001 4 |
Nelfinavir 1.5 (0.4, 2.6 ) p=0.008 |
Other PI 2 0.5 (-1.5, 2.5 ) p=0.651 |
NRTI -0.3 (-1.3, 0.6) p=0.480 |
NNRTI 0.1 (-1.0, 1.2 ) p=0.829 |
||
| LDL | Ritonavir 3 2.4 (0.8, 4.2) p=0.004 |
Nelfinavir 2.5 (0.9, 4.1 ) p= 0.002 |
Other PI 2 -0.2 (-3.0, 2.7 ) p=0.895 |
NRTI -0.3 (-1.6, 1.0 ) p=0.652 |
NNRTI -0.9 (-2.4, 0.7 ) p=0.288 |
||
| HDL | Nelfinavir -1.4 (-2.7,-0.0 ) p= 0.046 |
PI -1.0 (-2.4, 0.4 ) p=0.159 |
ZDV -1.2 (-2.1, -0.2 ) p=0.016 |
Other NRTI 1 0.4 (-0.9, 1.7 ) p=0.525 |
Nevirapine 1.7 (0.1, 3.3) p=0.043 |
Efavirenz 1.9 (-0.1, 3.9) p=0.060 |
|
| Non-HDL | Ritonavir 3 3.7 (2.1, 5.3 ) p<0.001 |
Nelfinavir 2.3 (0.8, 3.9 ) p=0.003 |
Other PI 2 1.8 (-0.8, 4.4 ) p=0.184 |
NRTI -0.3 (-1.5, 1.0 ) p=0.636 |
NNRTI 0.2 ( -1.3, 1.7) p=0.830 |
||
| Triglycerides | Ritonavir 3 7.7 (4.7, 10.7 ) p<0.001 |
Nelfinavir 3.3 (0.5, 6.1 ) p=0.021 |
Other PI 2 2.9 (-1.9, 8.0) p=0.242 |
ddI -2.8 (-4.9, -0.7 ) p=0.009 |
Other NRTI 1 -1.2 (-3.4, 0.9) p=0.264 |
NNRTI 0.0 ( -2.7, 2.8) p=0.989 |
|
|
Glucose Metabolism |
|||||||
| Fasting glucose | Nelfinavir -0.4 (-0.8, -0.1 ) p=0.014 |
Other PI 2 -0.2 (-0.6, 0.1 ) p=0.243 |
NRTI -0.1 (-0.4, 0.1 ) p=0.334 |
NNRTI 0.3 (-0.0, 0.7 ) p=0.065 |
|||
| 2-hour glucose | Ritonavir 3 1.2 (0.2, 2.2 ) p=0.018 |
Other PI 2 0.5 (-0.4, 1.5 ) p=0.281 |
NRTI -0.3 (-1.2, 0.6 ) p=0.476 |
NNRTI 0.1 (-0.9, 1.1 ) p=0.866 |
|||
| Fasting insulin | PI -0.3 (-3.2, 2.8 ) p=0.852 |
NRTI 0.1 (-2.6, 3.0 ) p=0.922 |
NNRTI 1.6 (-1.8, 5.1 ) p=0.355 |
||||
| 2-hour insulin | Ritonavir 3 8.0 (3.3, 12.8 ) p<0.001 |
PI 2.4 (-1.8, 6.7 ) p=0.270 |
Other NRTI 2.8 (-1.0, 6.8 ) p=0.154 |
NNRTI -0.3 (-4.7, 4.3 ) p=0.901 |
|||
| HOMA-IR | PI -0.3 (-3.3, 2.9 ) p=0.859 |
NRTI -0.5 ( -3.4, 2.4) p=0.718 |
NNRTI 2.1 (-1.4, 5.7 ) p=0.251 |
||||
| Fasting C-peptide | PI -0.5 (-2.4, 1.5 ) p=0.641 |
ddI -1.8 (-3.4, -0.1 ) p=0.044 |
Other NRTI 1 0.1 (-1.7, 1.8 ) p=0.940 |
NNRTI 0.7 (-1.5, 2.8 ) p=0.540 |
|||
| 2-hour C-peptide | Ritonavir 3 4.2 (1.5, 6.9 ) p=0.002 |
Other PI 2 0.1 (-2.4, 2.6 ) p=0.951 |
NRTI 1.4 (-0.8, 3.7 ) p=0.208 |
NNRTI -1.1 (-3.7, 1.6 ) p=0.437 |
|||
| Lactate | PI 0.9 (-0.7, 2.5 ) p=0.276 |
NRTI -1.0 (-2.4, 0.5 ) p=0.194 |
NNRTI -0.5 ( -2.2, 1.3) p=0.582 |
||||
Includes all other NRTI that are not in model
Includes all other PI that are not in the model
Includes ritonavir and ritonavir-boosted regimens
p-values from linear regression on each laboratory value (log10-transformed) adjusted for gender, race/ethnicity, Tanner stratum , BMI z-score, CDC disease category and years on each ARV drug shown in Table. Values <2nd or >98th percentile excluded
Ritonavir was also associated with predicted annual increases in 2-h values for glucose, insulin, and C-peptide. In contrast, each year of nelfinavir use was associated with a slight decrease in fasting glucose.
Discussion
To evaluate morphologic and metabolic abnormalities among vertically HIV infected children/youth, we performed a cross-sectional study within the PACTG. To our knowledge, this is the largest survey in HIV-infected children/youth that uses objective measurements of both metabolic and morphologic outcomes and features a carefully selected control group.
We observed a high prevalence of dyslipidemia in those with HIV infection, particularly those on PI-containing regimens, consistent with other studies in HIV-infected children/youth[16, 20, 23, 42]. Using a cutpoint of 130 mg/dL, fasting levels of triglyceride were elevated in 52% and 20% of HIV infected children in the PI and non-PI groups, respectively. Abnormalities in total (29%), non-HDL (24%), LDL (19%) and HDL (10%) cholesterol were also frequently observed in the PI group. Differences between the HIVpos and HIVneg subjects remained significant after adjusting for race/ethnicity, Tanner stage, gender, BMI z-score and CDC classification. In models that also included ART exposure history, longer exposure to PIs in the current regimen was associated with dyslipidemia (higher total, LDL, non-HDL cholesterol and triglycerides and lower HDL-C) as well as glucose abnormalities (2-hour insulin and glucose). When the effects of nelfinavir and ritonavir were included in these models, ritonavir exposure had greater effects on total, non-HDL and triglycerides than nelfinavir.
Dyslipidemia, particularly LDL-C >130 mg/dL, has been associated with an elevated risk of CVD in adults[43], and dyslipidemic children are more likely than their normolipidemic counterparts to be dyslipidemic as adults[39]. In addition, elevations in total and LDL-C and reduced levels of HDL-C are associated with the presence of early atherosclerotic lesions in adolescents and children[39]. Indeed, carotid intima media thickness was found to be higher in HIV-infected children, who also had higher levels of total and non-HDL-C and triglycerides, relative to seronegative controls matched for age, gender, race, and BMI[12]. The risk of CVD is further elevated in certain racial/ethnic groups and in those with a family history[44-46]. In the United States, HIV infection disproportionately affects African-American and Hispanic children/youth[47], who may bear increased risk for CVD. Over a third of our HIV-infected subjects had a family history of CVD, 26% had family members with hyperlipidemia, and 37% with type 2 diabetes. Although not significantly different from the controls, elevated hsCRP levels were observed almost twice as frequently in HIV-infected children/youth. In addition, almost half of our subjects reported exercising less than once a week and approximately one-third watched television for more than 3 hours daily. Inactivity and television viewing have been associated with increased risk of obesity in HIVneg children[48]. This combination of factors suggests that these children are at high risk of developing CVD and should be closely monitored. Until specific guidelines are developed for monitoring metabolic and morphologic changes in HIV infected children, published guidelines for adults can be followed[7, 49]. Increased emphasis should be also placed on identifying effective ways to not just improve eating and exercise habits but also prevent children/youth from beginning to smoke cigarettes.
In contrast to the high prevalence of dyslipidemia, abnormal fasting or 2-h glucose values were relatively uncommon in all groups. Although impaired fasting glucose or glucose intolerance are observed frequently in obese children and adolescents[50], these abnormalities occur rarely, if at all, in nonobese children and adolescents[51, 52], a group that would be more comparable to those in this study. It should be noted that although we saw no clinically relevant differences in fasting glucose, insulin levels were approximately 40% higher in both HIV-infected groups, consistent with other studies in which fasting insulin, but not glucose, was higher in HIV-pos children[14, 53]. We also found that ritonavir use was significantly associated with increasing 2-hour (but not fasting) values for glucose, insulin, and C-peptide. Thus, this dynamic test revealed an association that was not evident in fasting measurements. Overall, our results and those of others provide evidence of developing insulin resistance and, potentially, increasing risk of diabetes, which could contribute to overall risk for CVD as exposure to ART lengthens.
Although ritonavir has long been recognized as a major factor in PI-associated dyslipidemia[54, 55], our results and other recent studies point to an emerging role in insulin resistance as well. For example, in the Multicenter AIDS Cohort Study, ritonavir was the only PI associated with increased incidence of diabetes or hyperglycemia[48]. In addition, a study in healthy HIV-uninfected volunteers demonstrated that 4 weeks of exposure to ritonavir, in either a therapeutic or boosting dose combined with lopinavir, decreased insulin sensitivity[56, 57]. The significant relationships of exposure to didanosine with fasting C-peptide and triglycerides are consistent with the recent observation that didanosine was associated with increased risk of diabetes in a large cohort study of HIV-infected adults[58].
Our DXA results demonstrated that both groups of HIV-infected subjects had significantly lower mean Z-scores for limb fat, which is consistent with observations from other cross-sectional studies that employed an objective measure of fat distribution[59] or clinical criteria to define lipoatrophy[20, 23, 42]. The extent to which this is due to impaired growth trajectories in vertically infected youth[31], or specific effects of ART on fat distribution cannot be discerned. The cross-sectional study design also prevents us from stating whether the difference is a result of specific fat loss or failure to accrue fat at the expected rates. Given the concerns about disfigurement and forced disclosure of HIV status among adults with lipoatrophy, low levels of extremity fat among HIV-infected children/youth may become an important factor in adherence to ART and may warrant interventions. Notably, a recent study demonstrated that substitution of tenofovir for d4T and an NNRTI for a PI in HIV-infected children with lipoatrophy normalized the rate of fat accrual in HIV-infected children[60].
Predicted mean Z-scores for trunk fat were, if anything, lower than those in HIVneg controls, which is consistent with studies that did not match for BMI[60-62]. A limitation is that DXA cannot distinguish between visceral and subcutaneous fat. Use of computed tomography in one study revealed no difference between PI-treated and PI-naïve HIV-pos children in either visceral or subcutaneous fat[17]. Other studies using magnetic resonance imaging have identified subgroups of HIV-infected children and adolescents with higher-than-normal volumes of visceral fat[59, 63]. Given evidence of reduced levels of limb fat in the HIV-infected groups in this study, it is possible there may have been concomitant reduction in or impaired accrual of subcutaneous fat in the central region with relative sparing or even accumulation of visceral fat in these groups. The implications of conserved visceral fat on long-term cardiovascular risk are unknown.
We cannot account for the effects of delayed puberty or impeded growth trajectories in this analysis, but it is notable that Z-scores for LBM in both HIV-pos groups were not different from HIVneg. Thus, it appears that the lower weight and BMI in the HIV-infected groups was entirely attributable to differences in fat, primarily in the extremities. This pattern is strikingly different from that seen in vertically HIV-infected children studied before the HAART era, who were reported to have significantly lower levels of LBM with relative sparing of fat[64].
A strength of our study is that it featured a recruitment strategy that was designed to balance the groups with regard to gender, race, and Tanner stage. However, like all cross-sectional studies, our study has several important limitations. Although the two HIV-infected groups were similar with regard to current CD4 count or viral load, the PI group showed evidence of more extensive disease history and had longer exposure to NNRTIs. In addition, although our HIVneg and HIVpos subjects were chosen from similar backgrounds, we cannot exclude differences in important potential confounders. Our random selection procedures were designed to provide a representative sample of HIV-infected children/youth from sites and minimize selection bias, but about 40% of these candidates declined to participate. The reasons for refusal are unknown but if related to outcome measures, our sample may be biased. Although the LOESS Z-scores calculated relative to the study HIVneg yielded similar results to those from NHANES IV data when available, our Z-scores were based on a comparatively small number of subjects. As stated earlier, with the large number of outcomes reported, some statistically significant results may occur by chance. Finally, the fact that only 55% of the targeted enrollment was achieved in the non-PI group may have impaired our ability to detect associations between metabolic alterations among subjects on non-PI containing regimens and the potential role of individual NNRTIs in these alterations. The greater reliance on PI-based regimens in this population may reflect the challenges of managing the disease in this population with a long history of exposure to ART.
In summary, the current study included a randomized sampling design and comprehensive assessment of metabolic and morphologic alterations using objective techniques in a large group of vertically HIV-infected children and youth and seronegative controls. It revealed a high prevalence of dyslipidemia and evidence of reduced peripheral fat among the HIV—infected children. Ritonavir was associated with increased risk of dyslipidemia and altered glucose metabolism. These factors may combine to increase risk of CVD in children who are likely to be facing a lifetime of exposure to ART. Our data underscore the need for promoting lifestyles (diet, exercise, reduced television watching, smoking cessation) that decrease cardiovascular risk[65-70]. Further, they provide a rationale for continuing efforts to untangle the role of HIV infection and its treatment from genetic, developmental and lifestyle factors, which is essential to understanding basic pathophysiologic mechanisms and for the design of appropriate interventions to reverse or minimize progression of these complications.
Acknowledgments
The authors would like to thank the children who participated in this study, their families and the entire protocol 1045 team for their contributions and support. We would also like to thank Barb Heckman for outstanding support. This study was supported in part by the Pediatric AIDS Clinical Trials Group of the National Institute of Allergy and Infectious Diseases and the Pediatric/Perinatal HIV Clinical Trials Network of the Eunice Kennedy Shiver National Institute of Child Health and Human Development, National Institutes of Health, Bethesda MD.
The following sites and individuals have contributed to this study: Children’s Hospital of Chicago; Tulane University School of Medicine, Charity Hospital of New Orleans: M. Silio, T. Alchediak, C. Borne, S. Bradford; SUNY Health Science Center, Stony Brook: S. Nachman, D. Ferraro, J. Perillo, S. Muniz; University of Puerto Rico; Harlem Hospital; NYU Medical Center/Bellevue; City Hospital at San Juan; New Jersey Medical School; Jacobi Medical Center; St. Jude Children’s Hospital: M. Donohoe, N. Patel, S. Kaste, J. Utech; Boston Children’s Hospital; University of North Carolina at Chapel Hill; University of South Florida Physicians Group; The Children’s Hospital, University of Colorado, Denver: E. Barr, J. Maes, B. McFarland, S. Paul, Grant Number MO1 RR00069, GCRC Program, National Center for Research Resources, NIH; Medical College of Georgia; Duke University Medical Center: J. Hurwitz, J. Simonetti, M. Donnelly, C. Mathison; Texas Children’s Hospital/Baylor; UCSF Medical Center; Yale University School of Medicine: W. Andiman, L. Hurst, S. Romano; Los Angeles County Medical/University of Southern California; Lincoln Medical and Mental Health; University of Rochester: G. Weinberg, B. Murante, S. Laverty; Metropolitan Hospital Center; Long Beach Memorial Medical Center; Johns Hopkins University Hospital; UCSD Medical Center; Children’s Hospital at SUNY Downstate; Bronx-Lebanon Hospital; Harbor General — UCLA Medical Center; Children’s National Medical Center — D.C.: D. Dobbins, T. Peron, D. Wimbley, H. Spiegel; Children’s Diagnostic and Treatment Center of South Florida; Robert Wood Johnson University Hospital; Howard University Hospital; University of Florida at Gainesville; Mt. Sinai Hospital Medical Center, Women’s and Children’s HIV Program; SUNY Health Science Center, Syracuse; University of Alabama, Birmingham School of Medicine: R. Pass, M. Crain, N. Beatty, H. Charlton; University of California, San Francisco PCRC (RR-001271).
Overall support for the Pediatric AIDS Clinical Trials Group (PACTG) was provided by the National Institute of Allergy and Infectious Diseases [U01 AI068632] and by the Eunice Kennedy Shriver National Institute of Child Health and Human Development. The content is solely the responsibility of the authors and does not necessarily represent the official views of the National Institute of Allergy and Infectious Diseases or the National Institutes of Health. This work was supported by the Statistical and Data Analysis Center at Harvard School of Public Health, under the National Institute of Allergy and Infectious Diseases cooperative agreement #5 U01 AI41110 with the Pediatric AIDS Clinical Trials Group. Dr. Aldrovandi is an Elizabeth Glaser Scientist and her efforts were supported by grants from U01 AI41089, RO1 HD 40777).
Footnotes
Preliminary results of this study were presented at the 9th International Workshop on Lipodystrophy and Adverse Drug Reactions in Sydney, Australia, July 2007.
References
- 1.Gortmaker SL, Hughes M, Cervia J, Brady M, Johnson GM, Seage GR, 3rd, et al. Effect of combination therapy including protease inhibitors on mortality among children and adolescents infected with HIV-1. N Engl J Med. 2001;345:1522–1528. doi: 10.1056/NEJMoa011157. [DOI] [PubMed] [Google Scholar]
- 2.Palella FJ, Jr., Delaney KM, Moorman AC, Loveless MO, Fuhrer J, Satten GA, et al. Declining morbidity and mortality among patients with advanced human immunodeficiency virus infection. HIV Outpatient Study Investigators. N Engl J Med. 1998;338:853–860. doi: 10.1056/NEJM199803263381301. [DOI] [PubMed] [Google Scholar]
- 3.Resino S, Bellon JM, Resino R, Navarro ML, Ramos J Tomas, de Jose MI, et al. Extensive implementation of highly active antiretroviral therapy shows great effect on survival and surrogate markers in vertically HIV-infected children. Clin Infect Dis. 2004;38:1605–1612. doi: 10.1086/420738. [DOI] [PubMed] [Google Scholar]
- 4.Gibb DM, Duong T, Tookey PA, Sharland M, Tudor-Williams G, Novelli V, et al. Decline in mortality, AIDS, and hospital admissions in perinatally HIV-1 infected children in the United Kingdom and Ireland. Bmj. 2003;327:1019. doi: 10.1136/bmj.327.7422.1019. [DOI] [PMC free article] [PubMed] [Google Scholar]
- 5.de Martino M, Tovo PA, Balducci M, Galli L, Gabiano C, Rezza G, Pezzotti P. Reduction in mortality with availability of antiretroviral therapy for children with perinatal HIV-1 infection. Italian Register for HIV Infection in Children and the Italian National AIDS Registry. Jama. 2000;284:190–197. doi: 10.1001/jama.284.2.190. [DOI] [PubMed] [Google Scholar]
- 6.Grinspoon S, Carr A. Cardiovascular risk and body-fat abnormalities in HIV-infected adults. N Engl J Med. 2005;352:48–62. doi: 10.1056/NEJMra041811. [DOI] [PubMed] [Google Scholar]
- 7.Wohl DA, McComsey G, Tebas P, Brown TT, Glesby MJ, Reeds D, et al. Current concepts in the diagnosis and management of metabolic complications of HIV infection and its therapy. Clin Infect Dis. 2006;43:645–653. doi: 10.1086/507333. [DOI] [PubMed] [Google Scholar]
- 8.Kaufman FR. Type 2 diabetes in children and youth. Endocrinol Metab Clin North Am. 2005;34:659–676. ix–x. doi: 10.1016/j.ecl.2005.04.010. [DOI] [PubMed] [Google Scholar]
- 9.Shaw J. Epidemiology of childhood type 2 diabetes and obesity. Pediatr Diabetes. 2007;8(Suppl 9):7–15. doi: 10.1111/j.1399-5448.2007.00329.x. [DOI] [PubMed] [Google Scholar]
- 10.Cara JF, Chaiken RL. Type 2 diabetes and the metabolic syndrome in children and adolescents. Curr Diab Rep. 2006;6:241–250. doi: 10.1007/s11892-006-0041-8. [DOI] [PubMed] [Google Scholar]
- 11.Ebbeling CB, Pawlak DB, Ludwig DS. Childhood obesity: public-health crisis, common sense cure. Lancet. 2002;360:473–482. doi: 10.1016/S0140-6736(02)09678-2. [DOI] [PubMed] [Google Scholar]
- 12.McComsey GA, O’Riordan M, Hazen SL, El-Bejjani D, Bhatt S, Brennan ML, et al. Increased carotid intima media thickness and cardiac biomarkers in HIV infected children. Aids. 2007;21:921–927. doi: 10.1097/QAD.0b013e328133f29c. [DOI] [PubMed] [Google Scholar]
- 13.Ene L, Goetghebuer T, Hainaut M, Peltier A, Toppet V, Levy J. Prevalence of lipodystrophy in HIV-infected children: a cross-sectional study. Eur J Pediatr. 2007;166:13–21. doi: 10.1007/s00431-006-0193-1. [DOI] [PubMed] [Google Scholar]
- 14.Ergun-Longmire B, Lin-Su K, Dunn AM, Chan L, Ham K, Sison C, et al. Effects of protease inhibitors on glucose tolerance, lipid metabolism, and body composition in children and adolescents infected with human immunodeficiency virus. Endocr Pract. 2006;12:514–521. doi: 10.4158/EP.12.5.514. [DOI] [PubMed] [Google Scholar]
- 15.Torres AM Sanchez, Muniz R Munoz, Madero R, Borque C, Garcia-Miguel MJ, De Jose Gomez MI. Prevalence of fat redistribution and metabolic disorders in human immunodeficiency virus-infected children. Eur J Pediatr. 2005;164:271–276. doi: 10.1007/s00431-004-1610-y. [DOI] [PubMed] [Google Scholar]
- 16.Farley J, Gona P, Crain M, Cervia J, Oleske J, Seage G, Lindsey J. Prevalence of elevated cholesterol and associated risk factors among perinatally HIV-infected children (4-19 years old) in Pediatric AIDS Clinical Trials Group 219C. J Acquir Immune Defic Syndr. 2005;38:480–487. doi: 10.1097/01.qai.0000139397.30612.96. [DOI] [PubMed] [Google Scholar]
- 17.Bitnun A, Sochett E, Dick PT, To T, Jefferies C, Babyn P, et al. Insulin sensitivity and beta-cell function in protease inhibitor-treated and -naive human immunodeficiency virus-infected children. J Clin Endocrinol Metab. 2005;90:168–174. doi: 10.1210/jc.2004-0125. [DOI] [PubMed] [Google Scholar]
- 18.Beregszaszi M, Dollfus C, Levine M, Faye A, Deghmoun S, Bellal N, et al. Longitudinal evaluation and risk factors of lipodystrophy and associated metabolic changes in HIV-infected children. J Acquir Immune Defic Syndr. 2005;40:161–168. doi: 10.1097/01.qai.0000178930.93033.f2. [DOI] [PubMed] [Google Scholar]
- 19.Aldamiz-Echevarria L, Pocheville I, Sanjurjo P, Elorz J, Prieto JA, Rodriguez-Soriano J. Abnormalities in plasma fatty acid composition in human immunodeficiency virus-infected children treated with protease inhibitors. Acta Paediatr. 2005;94:672–677. doi: 10.1111/j.1651-2227.2005.tb01963.x. [DOI] [PubMed] [Google Scholar]
- 20.Taylor P, Worrell C, Steinberg SM, Hazra R, Jankelevich S, Wood LV, et al. Natural History of Lipid Abnormalities and Fat Redistribution Among Human Immunodeficiency Virus-Infected Children Receiving Long-Term, Protease Inhibitor-Containing, Highly Active Antiretroviral Therapy Regimens. Pediatrics. 2004;114:e235–242. doi: 10.1542/peds.114.2.e235. [DOI] [PubMed] [Google Scholar]
- 21.Rondanelli M, Caselli D, Trotti R, Solerte SB, Maghnie M, Maccabruni A, et al. Endocrine pancreatic dysfunction in HIV-infected children: association with growth alterations. J Infect Dis. 2004;190:908–912. doi: 10.1086/422255. [DOI] [PubMed] [Google Scholar]
- 22.Mora S, Zamproni I, Beccio S, Bianchi R, Giacomet V, Vigano A. Longitudinal changes of bone mineral density and metabolism in antiretroviral-treated human immunodeficiency virus-infected children. J Clin Endocrinol Metab. 2004;89:24–28. doi: 10.1210/jc.2003-030767. [DOI] [PubMed] [Google Scholar]
- 23.Antiretroviral therapy, fat redistribution and hyperlipidaemia in HIV-infected children in Europe. Aids. 2004;18:1443–1451. doi: 10.1097/01.aids.0000131334.38172.01. [DOI] [PubMed] [Google Scholar]
- 24.Leonard EG, McComsey GA. Metabolic complications of antiretroviral therapy in children. Pediatr Infect Dis J. 2003;22:77–84. doi: 10.1097/00006454-200301000-00018. [DOI] [PubMed] [Google Scholar]
- 25.Amaya RA, Kozinetz CA, McMeans A, Schwarzwald H, Kline MW. Lipodystrophy syndrome in human immunodeficiency virus-infected children. Pediatr Infect Dis J. 2002;21:405–410. doi: 10.1097/00006454-200205000-00011. [DOI] [PubMed] [Google Scholar]
- 26.Wedekind CA, Pugatch D. Lipodystrophy syndrome in children infected with human immunodeficiency virus. Pharmacotherapy. 2001;21:861–866. doi: 10.1592/phco.21.9.861.34555. [DOI] [PubMed] [Google Scholar]
- 27.Melvin AJ, Lennon S, Mohan KM, Purnell JQ. Metabolic abnormalities in HIV type 1-infected children treated and not treated with protease inhibitors. AIDS Res Hum Retroviruses. 2001;17:1117–1123. doi: 10.1089/088922201316912727. [DOI] [PubMed] [Google Scholar]
- 28.Babl FE, Regan AM, Pelton SI. Abnormal body-fat distribution in HIV-1-infected children on antiretrovirals. Lancet. 1999;353:1243–1244. doi: 10.1016/S0140-6736(98)05754-7. [DOI] [PubMed] [Google Scholar]
- 29.Goran MI, Gower BA. Longitudinal study on pubertal insulin resistance. Diabetes. 2001;50:2444–2450. doi: 10.2337/diabetes.50.11.2444. [DOI] [PubMed] [Google Scholar]
- 30.Amiel SA, Sherwin RS, Simonson DC, Lauritano AA, Tamborlane WV. Impaired insulin action in puberty. A contributing factor to poor glycemic control in adolescents with diabetes. N Engl J Med. 1986;315:215–219. doi: 10.1056/NEJM198607243150402. [DOI] [PubMed] [Google Scholar]
- 31.Hirschfeld S. Dysregulation of growth and development in HIV-infected children. J Nutr. 1996;126:2641S–2650S. doi: 10.1093/jn/126.suppl_10.2641S. [DOI] [PubMed] [Google Scholar]
- 32.Gibson R. Principles of Nutritional Assessment. Oxford University Press; New York: 2005. [Google Scholar]
- 33.World Health Organization . Definition, Diagnosis and Classification of Diabetes Mellitus and its Complications: Report of a WHO Consultation. Part : Diagnosis and Classification of Diabetes Mellitus. World Health Organization; Geneva: 1999. [Google Scholar]
- 34.Matthews DR, Hosker JP, Rudenski AS, Naylor BA, Treacher DF, Turner RC. Homeostasis model assessment: insulin resistance and beta-cell function from fasting plasma glucose and insulin concentrations in man. Diabetologia. 1985;28:412–419. doi: 10.1007/BF00280883. [DOI] [PubMed] [Google Scholar]
- 35.Loader C. Local regression and likelihood (statistics and computing) Springer; New York: 1999. [Google Scholar]
- 36.The National Health and Nutrition Examination Survey (NHANES): Analytic and Reporting Guidelines. Hyattsville, MD: 2006. [Google Scholar]
- 37.Turnbull B. The empirical distribution with arbitrarily grouped, censored and truncated data. J R Stat Soc Ser B. 1976;38:290–295. [Google Scholar]
- 38.Kuczmarski RJ, Ogden CL, Grummer-Strawn LM, Flegal KM, Guo SS, Wei R, et al. CDC growth charts: United States. Adv Data. 2000:1–27. [PubMed] [Google Scholar]
- 39.National Cholesterol Education Program (NCEP): highlights of the report of the Expert Panel on Blood Cholesterol Levels in Children and Adolescents. Pediatrics. 1992;89:495–501. [PubMed] [Google Scholar]
- 40.Botton J, Heude B, Kettaneh A, Borys JM, Lommez A, Bresson JL, et al. Cardiovascular risk factor levels and their relationships with overweight and fat distribution in children: the Fleurbaix Laventie Ville Sante II study. Metabolism. 2007;56:614–622. doi: 10.1016/j.metabol.2006.12.006. [DOI] [PMC free article] [PubMed] [Google Scholar]
- 41.Type 2 diabetes in children and adolescents. American Diabetes Association. Diabetes Care. 2000;23:381–389. doi: 10.2337/diacare.23.3.381. [DOI] [PubMed] [Google Scholar]
- 42.Carter RJ, Wiener J, Abrams EJ, Farley J, Nesheim S, Palumbo P, Bulterys M. Dyslipidemia among perinatally HIV-infected children enrolled in the PACTS-HOPE cohort, 1999-2004: a longitudinal analysis. J Acquir Immune Defic Syndr. 2006;41:453–460. doi: 10.1097/01.qai.0000218344.88304.db. [DOI] [PubMed] [Google Scholar]
- 43.McCrindle BW, Urbina EM, Dennison BA, Jacobson MS, Steinberger J, Rocchini AP, et al. Drug therapy of high-risk lipid abnormalities in children and adolescents: a scientific statement from the American Heart Association Atherosclerosis, Hypertension, and Obesity in Youth Committee, Council of Cardiovascular Disease in the Young, with the Council on Cardiovascular Nursing. Circulation. 2007;115:1948–1967. doi: 10.1161/CIRCULATIONAHA.107.181946. [DOI] [PubMed] [Google Scholar]
- 44.Webber LS, Harsha DW, Phillips GT, Srinivasan SR, Simpson JW, Berenson GS. Cardiovascular risk factors in Hispanic, white, and black children: the Brooks County and Bogalusa Heart studies. Am J Epidemiol. 1991;133:704–714. doi: 10.1093/oxfordjournals.aje.a115945. [DOI] [PubMed] [Google Scholar]
- 45.Webber LS, Osganian V, Luepker RV, Feldman HA, Stone EJ, Elder JP, et al. Cardiovascular risk factors among third grade children in four regions of the United States. The CATCH Study. Child and Adolescent Trial for Cardiovascular Health. Am J Epidemiol. 1995;141:428–439. doi: 10.1093/oxfordjournals.aje.a117445. [DOI] [PubMed] [Google Scholar]
- 46.Daniels SR, Greer FR. Lipid screening and cardiovascular health in childhood. Pediatrics. 2008;122:198–208. doi: 10.1542/peds.2008-1349. [DOI] [PubMed] [Google Scholar]
- 47.CDC Trends in HIV- and STD-Related Risk Behaviors Among High School Students --- United States, 1991-2007. MMWR. 2008;57:817–822. [PubMed] [Google Scholar]
- 48.Laurson KR, Eisenmann JC, Welk GJ, Wickel EE, Gentile DA, Walsh DA. Combined influence of physical activity and screen time recommendations on childhood overweight. J Pediatr. 2008;153:209–214. doi: 10.1016/j.jpeds.2008.02.042. [DOI] [PubMed] [Google Scholar]
- 49.Schambelan M, Benson CA, Carr A, Currier JS, Dube MP, Gerber JG, et al. Management of metabolic complications associated with antiretroviral therapy for HIV-1 infection: recommendations of an International AIDS Society-USA panel. J Acquir Immune Defic Syndr. 2002;31:257–275. doi: 10.1097/00126334-200211010-00001. [DOI] [PubMed] [Google Scholar]
- 50.Sinha R, Fisch G, Teague B, Tamborlane WV, Banyas B, Allen K, et al. Prevalence of impaired glucose tolerance among children and adolescents with marked obesity. N Engl J Med. 2002;346:802–810. doi: 10.1056/NEJMoa012578. [DOI] [PubMed] [Google Scholar]
- 51.Uwaifo GI, Elberg J, Yanovski JA. Impaired glucose tolerance in obese children and adolescents. N Engl J Med. 2002;347:290–292. author reply 290-292. [PubMed] [Google Scholar]
- 52.Weiss R, Dziura J, Burgert TS, Tamborlane WV, Taksali SE, Yeckel CW, et al. Obesity and the metabolic syndrome in children and adolescents. N Engl J Med. 2004;350:2362–2374. doi: 10.1056/NEJMoa031049. [DOI] [PubMed] [Google Scholar]
- 53.Rosso R, Parodi A, d’Annunzio G, Ginocchio F, Nicolini L, Torrisi C, et al. Evaluation of insulin resistance in a cohort of HIV-infected youth. Eur J Endocrinol. 2007;157:655–659. doi: 10.1530/EJE-07-0414. [DOI] [PubMed] [Google Scholar]
- 54.Periard D, Telenti A, Sudre P, Cheseaux JJ, Halfon P, Reymond MJ, et al. Atherogenic dyslipidemia in HIV-infected individuals treated with protease inhibitors. The Swiss HIV Cohort Study. Circulation. 1999;100:700–705. doi: 10.1161/01.cir.100.7.700. [DOI] [PubMed] [Google Scholar]
- 55.Purnell JQ, Zambon A, Knopp RH, Pizzuti DJ, Achari R, Leonard JM, et al. Effect of ritonavir on lipids and post-heparin lipase activities in normal subjects. Aids. 2000;14:51–57. doi: 10.1097/00002030-200001070-00006. [DOI] [PubMed] [Google Scholar]
- 56.Lee GA, Lo JC, Aweeka F, Schwarz JM, Mulligan K, Schambelan M, Grunfeld C. Single-dose lopinavir-ritonavir acutely inhibits insulin-mediated glucose disposal in healthy volunteers. Clin Infect Dis. 2006;43:658–660. doi: 10.1086/505974. [DOI] [PMC free article] [PubMed] [Google Scholar]
- 57.Lee GA, Rao M, Mulligan K, Lo JC, Aweeka F, Schwarz JM, et al. Effects of ritonavir and amprenavir on insulin sensitivity in healthy volunteers. Aids. 2007;21:2183–2190. doi: 10.1097/QAD.0b013e32826fbc54. [DOI] [PMC free article] [PubMed] [Google Scholar]
- 58.De Wit S, Sabin CA, Weber R, Worm SW, Reiss P, Cazanave C, et al. Incidence and risk factors for new-onset diabetes in HIV-infected patients: the Data Collection on Adverse Events of Anti-HIV Drugs (D:A:D) study. Diabetes Care. 2008;31:1224–1229. doi: 10.2337/dc07-2013. [DOI] [PMC free article] [PubMed] [Google Scholar]
- 59.Brambilla P, Bricalli D, Sala N, Renzetti F, Manzoni P, Vanzulli A, et al. Highly active antiretroviral-treated HIV-infected children show fat distribution changes even in absence of lipodystrophy. Aids. 2001;15:2415–2422. doi: 10.1097/00002030-200112070-00009. [DOI] [PubMed] [Google Scholar]
- 60.Vigano A, Brambilla P, Cafarelli L, Giacomet V, Borgonovo S, Zamproni I, et al. Normalization of fat accrual in lipoatrophic, HIV-infected children switched from stavudine to tenofovir and from protease inhibitor to efavirenz. Antivir Ther. 2007;12:297–302. [PubMed] [Google Scholar]
- 61.Mulligan K, Anastos K, Justman J, Freeman R, Wichienkuer P, Robison E, Hessol NA. Fat distribution in HIV-infected women in the United States: DEXA substudy in the Women’s Interagency HIV Study. J Acquir Immune Defic Syndr. 2005;38:18–22. doi: 10.1097/00126334-200501010-00004. [DOI] [PubMed] [Google Scholar]
- 62.Bacchetti P, Gripshover B, Grunfeld C, Heymsfield S, McCreath H, Osmond D, et al. Fat distribution in men with HIV infection. J Acquir Immune Defic Syndr. 2005;40:121–131. doi: 10.1097/01.qai.0000182230.47819.aa. [DOI] [PMC free article] [PubMed] [Google Scholar]
- 63.Vigano A, Mora S, Brambilla P, Schneider L, Merlo M, Monti LD, Manzoni P. Impaired growth hormone secretion correlates with visceral adiposity in highly active antiretroviral treated HIV-infected adolescents. Aids. 2003;17:1435–1441. doi: 10.1097/00002030-200307040-00003. [DOI] [PubMed] [Google Scholar]
- 64.Arpadi SM, Horlick MN, Wang J, Cuff P, Bamji M, Kotler DP. Body composition in prepubertal children with human immunodeficiency virus type 1 infection. Arch Pediatr Adolesc Med. 1998;152:688–693. doi: 10.1001/archpedi.152.7.688. [DOI] [PubMed] [Google Scholar]
- 65.Stewart KJ, Goldberg AP. Exercise, lipids, and obesity in adolescents with parental history of coronary disease. Am J Health Promot. 1992;6:430–436. doi: 10.4278/0890-1171-6.6.430. [DOI] [PubMed] [Google Scholar]
- 66.Stewart KJ. Exercise training and the cardiovascular consequences of type 2 diabetes and hypertension: plausible mechanisms for improving cardiovascular health. Jama. 2002;288:1622–1631. doi: 10.1001/jama.288.13.1622. [DOI] [PubMed] [Google Scholar]
- 67.Sung RY, Yu CW, Chang SK, Mo SW, Woo KS, Lam CW. Effects of dietary intervention and strength training on blood lipid level in obese children. Arch Dis Child. 2002;86:407–410. doi: 10.1136/adc.86.6.407. [DOI] [PMC free article] [PubMed] [Google Scholar]
- 68.Kelly AS, Wetzsteon RJ, Kaiser DR, Steinberger J, Bank AJ, Dengel DR. Inflammation, insulin, and endothelial function in overweight children and adolescents: the role of exercise. J Pediatr. 2004;145:731–736. doi: 10.1016/j.jpeds.2004.08.004. [DOI] [PubMed] [Google Scholar]
- 69.Sigal RJ, Kenny GP, Wasserman DH, Castaneda-Sceppa C, White RD. Physical activity/exercise and type 2 diabetes: a consensus statement from the American Diabetes Association. Diabetes Care. 2006;29:1433–1438. doi: 10.2337/dc06-9910. [DOI] [PubMed] [Google Scholar]
- 70.Roberts CK, Chen AK, Barnard RJ. Effect of a short-term diet and exercise intervention in youth on atherosclerotic risk factors. Atherosclerosis. 2007;191:98–106. doi: 10.1016/j.atherosclerosis.2006.09.011. [DOI] [PubMed] [Google Scholar]