Abstract
Objective
To determine the feasibility of delayed enhancement µCT imaging to quantify myocardial infarct size in experimental mouse models.
Methods and Results
A total of 20 mice were imaged 5 or 35 days after surgical ligation of the left coronary artery, or sham surgery (n=6–7 per group). We utilized a prototype εCT which covers a 3D volume with an isotropic spatial resolution of 100 µm. A series of image acquisitions were started after a 200 µL bolus of a high molecular weight blood pool CT agent to outline the ventricles. CT imaging was continuously performed over 60 minutes, while an intravenous constant infusion with iopamidol 370 was started at a dosage of 1 mL/h. Thirty minutes after the initiation of this infusion, signal intensity in Hounsfild Units was significantly higher in the infarct than in the remote, uninjured myocardium. Cardiac morphology and motion was visualized with excellent contrast and in fine detail. In vivo CT determination of infarct extension and transmurality was in good agreement with ex vivo staining with triphenyltetrazolium chloride (5 days post MI: r2= 0.86, p < 0.01; 35 days post MI r2=0.92, p < 0.01). In addition, we detected significant left ventricular remodeling consisting of left ventricular dilation and decreased ejection fraction.
Conclusion
3D cine µCT reliably and rapidly quantifies infarct size and assesses murine anatomy and physiology after coronary ligation, despite the small size and the fast movement of the mouse heart. This efficient imaging tool is a valuable addition to the current phenotyping armamentarium and will allow rapid testing of novel drugs and cell based interventions in murine models.
Keywords: imaging, myocardial infarction, remodeling, CT
Introduction
Small animal models of cardiac disease, and in particular mouse models, play a central role in cardiovascular research and have proven their value and clinical translatability. For instance, ACE inhibitors, which where initially developed for the treatment of hypertension, where first assessed in rats with coronary ligation1 and subsequently in mice.2 In addition, transgenic mouse models have shed light on infarct healing and left ventricular (LV) remodeling, and are often the primary and first line animal model for stem cell research for myocardial repair.3, 4 Left ventricular dilation and hypertrophy are often assessed ex vivo; however, the value of non-invasive imaging is being increasingly appreciated, since it allows serial imaging at high sensitivity. The assessment of myocardial function in mice is challenging due to the small size of their hearts (~5mm in cross diameter) and the rapid rates at which they beat (~600 beats per minute). To date, the most frequently applied imaging modalities in murine models are echocardiography and magnetic resonance imaging (MRI). The advantages of cardiac MRI include its tomographic nature, high spatial and temporal resolution and excellent soft tissue contrast. In addition, delayed enhancement imaging after the administration of gadolinium allows myocardial viability and infarct size to be determined, which are both powerful predictors of LV remodeling and heart failure.5–7 Dedicated small animal cardiac MRI however, is expensive and still not widely available. Many studies have therefore utilized echocardiography, at the expense of sensitivity. Grothues et al. estimated that the number of patients to be examined for detecting a 10% change in left ventricular mass is 10 times higher for echocardiography compared to MRI.8 This data likely also applies to cardiac imaging in small animals.
The development of cardiac µCT imaging in mice could thus provide the investigator with a second tomographic technique with which to investigate cardiac pathophysiology. Recently, Badea et al. described the use of cine 3D µCT,9 and contrast enhanced CT has been used to predict myocardial viability in porcine and canine models of MI.10,11 However, there is a general lack of information on how well µCT can visualize infarcted myocardium in mice. We therefore hypothesized that µCT can quantify infarct size by delayed enhancement in living mice similarly as in large animal models and in patients.11 Furthermore, we tested the ability of cine 3D µCT to follow the evolution of heart failure in these mice.
Materials and Methods
Mouse model of myocardial infarction
A total of twenty C57BL6 mice were used in this study. Myocardial infarction was induced by coronary ligation at the CMIR surgery core. Mice were anesthetized for surgery by inhalation anesthesia (isoflurane 1–2% v/v + 2L O2). After recovery, mice were transferred to the Center for In Vivo Microscopy, Duke Medical Center, for CT imaging. The institutional subcommittee on research animal care at the Massachusetts General Hospital and the Duke University Institutional Animal Care and Use Committee approved all animal surgery and imaging studies.
Animal preparation for CT imaging
Mice were anesthetized with ketamine (115 mg/kg) and diazepam (27 mg/kg) and intubated for mechanical ventilation, at a rate of 90 breaths/min with a tidal volume of 0.4 mL. A pressure transducer (Blue Sensor, Medicotest, UK) on the breathing valve measured airway pressure and electrodes taped to the animal footpads acquired the ECG signal. Both signals were processed with Coulbourn modules (Coulbourn Instruments, Allentown, PA) and displayed on a computer monitor using a custom-written LabVIEW application (National Instruments, Austin, TX). Body temperature was recorded and maintained at 36.5°C by an infrared lamp and feedback controller system (Digi-Sense, Cole Parmer, Chicago, IL). A catheter was inserted in the tail vein and used for the delivery of contrast agents. Animals were placed in a cradle and scanned in a vertical position. During imaging we maintained anesthesia with 1–2% isoflurane (Halocarbon, River Edge, NJ).
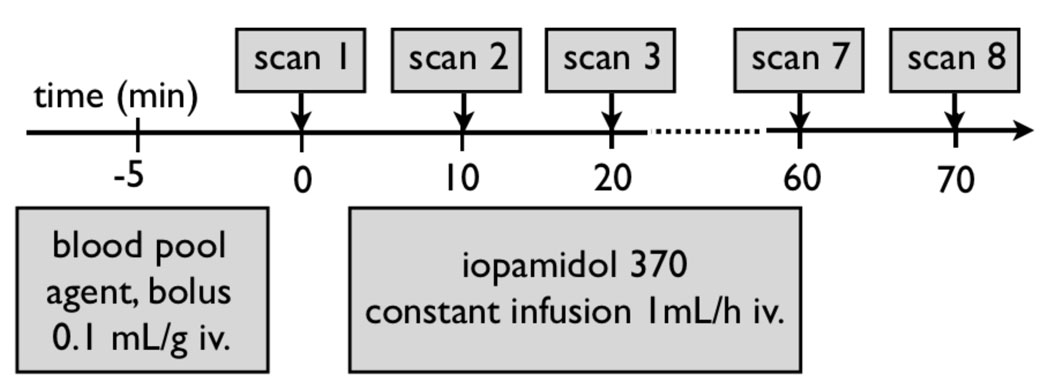
We chose a dual contrast agent strategy that involved a macromolecular blood pool agent to initially visualize cardiac morphology, and in a second step a small molecular contrast agent which extravasates and enhances the infarct. The imaging protocol in Fig. 1 summarizes the timing of the contrast agent application: 1) the blood pool contrast agent Fenestra VC (ART Advanced Research Technologies, Saint-Laurent, Quebec, Canada) and 2) the conventional contrast agent iopamidol-370, (Isovue, Bracco Diagnostics Inc. Princeton, NJ). A single bolus of Fenestra (0.1 mL/g) was applied prior to imaging to ensure an initial contrast between the blood and the myocardium, which allowed us to place exact region of interests in the left ventricular wall and the cavity. After a first set of image acquisitions, the conventional contrast agent iopamidol was delivered intravenously with a rate of 1 mL/h using an infusion pump (Pegasus, Instech Solomon, Plymouth Meeting, PA) through a constant infusion to hyperenhance the infarcted myocardium. In preliminary experiments, we tested this infusion rate and found that this volume is well tolerated even by mice compromised with heart failure due to extensive myocardial infarction.
Figure 1. Experimental Protocol.
Prior to imaging, a 200 µL bolus of intravascular contrast agent was injected to achieve sufficient blood-myocardial contrast. Thereafter, a constant intravenous infusion of iopamidol was started for 60 minutes, while CT acquisition was performed every 10 minutes.
CT Image Acquisition
We used a prototype cone beam µCT system with a design that overcomes two significant barriers to µCT in small-animals:9 the reduced signal-to-noise imposed by the smaller voxels and the rapid murine heart motion at a rate of ~600 per minute. Acquisition parameters were 80 kVp, 200 mA, and 9 ms exposures per projection. Typically, a full image dataset covered 189° ( i.e. 180° plus fan angle) in 0.75° steps for a total of 252 projections. We covered the heart cycle with eight scans using prospective cardio-respiratory gating, yielding a temporal resolution of approximately 15 ms. Total acquisition time for a single dataset was 7–8 minutes. This high resolution 3D dataset from different time points of the cardiac cycle is then displayed as a cine movie (3D cine µCT) and allows to quantify heart function. Dosimetric measurements were performed using a Wireless Dosimetry System Mobile MOSFET TN-RD-16, SN 63 B (Thomson/Nielsen, Ottawa, ON, Ca). Five MOSFET dosimeter silicon chips (active area 0.2mm × 0.2mm) were positioned at the surface and the center of a acrylic rodentlike phantom. During image acquisition, the measured dose for a single time point 3D dataset was 15.4 cGy and 1.23 Gy for 8 time points. Projections were used to reconstruct tomograms with a Feldkamp algorithm using Parker weighting12 with a Cobra EXXIM software package (EXXIM Computing Corp, Livermore, CA). Data sets were reconstructed as isotropic 5123 arrays with effective digital sampling in the image plane of 100 microns.
Image Analysis
The enhancement over time was measured using ImageJ (National Institute of Mental Health, Bethesda, Maryland, USA). Regions of interest of approximately 40 pixels were selected in the left ventricular cavity, remote, viable myocardium, infarcted lateral wall, and skeletal muscle to calculate mean signal intensities in Hounsfield units. Visualization of the infarct zone and quantitative analysis of LV volumetric measurements was performed using a novel volumetric analysis method integrated into the Pittsburgh Supercomputing Center Volume Browser (PSC-VB) (http://www.psc.edu/biomed/research/VB). The semi-automated analysis recovers the mean signal intensity of both the blood and myocardium. To accomplish this, the composite histogram is processed by a Gaussian mixture modeling approach.13 In addition to the direct measurement of LV cavity volume the process also produces a signal intensity that best reproduces the measured LV volume through a threshold segmentation of the ROI voxels. Diastole and systole were selected as the heart phases that provided the maximum and minimum LV volume. Stroke volume (SV) and ejection fraction (EF) are calculated with the end-diastolic (EDV) and end systolic (ESV) volumes ( SV= EDV- ESV; EF=SV/EDV).
Histopathological analysis
Directly after sacrifice, hearts were excised and rinsed in PBS and cut into myocardial rings of 1 mm thickness. Thereafter, sections were stained with TTC (triphenyltetrazolium chloride) for 20 minutes, and digital pictures were acquired for quantification of infarct size. Infarct size in the digital images and in the corresponding slice of the 3D CT dataset were determined with OsiriX shareware.
Statistics
Results are expressed as mean ± SD. Statistical comparisons among two groups were evaluated by Students t-test. P < 0.05 was considered to indicate statistical significance.
RESULTS
Constant infusion of iopamidol leads to infarct hyperenhancement
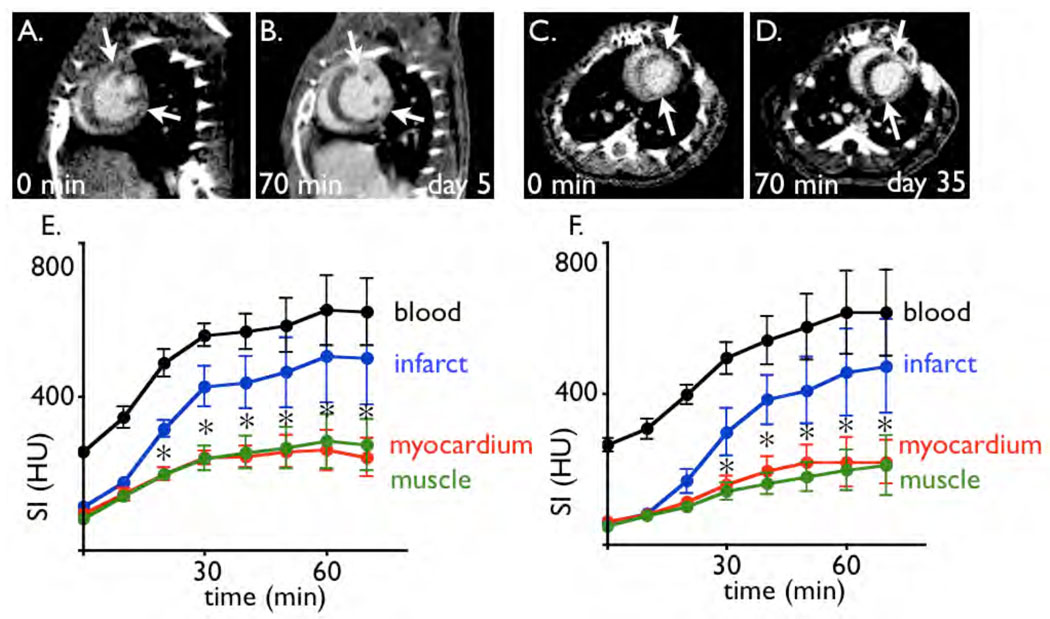
Cine 3D µCT produced high resolution time resolved images that facilitated detailed assessment of the murine cardiac anatomy and function. Application of a 200 µL bolus of the intravascular contrast agent established blood-myocardial contrast to unambiguously distinguish cardiac anatomy, however no hyperenhancement of the infarct was detected (Fig. 2). Conversely, 20 and 30 min after the start of iopamidol infusion the signal intensity in the infarct area was significantly higher than in the remote myocardium (Fig. 2), and the difference steadily increased up to one hour. This finding applied to both, the subacute state on day 5 after MI, and the chronic infarct after 35 days.
Figure 2. Contrast enhancement over time.
2A: Short axis image of a mouse 5 days after coronary ligation. The acquisition was performed at time point 0, before the infusion of iopamidol was started.
2B: Same imaging slice as 2A, after infusion of iopamidol. The arrows mark the borders of the MI.
2C–D: Short axis slices acquired 35 days after myocardial infarction, before (C) and after infusion of iopamidol.
2E–F: Signal intensity (SI) in respective tissue over time in 6 mice with MI per time point (E at 5 days, F at 35 days after coronary ligation). HU: Hounsfield units. * p < 0.05 for myocardium vs. infarct.
µCT accurately assesses infarct size
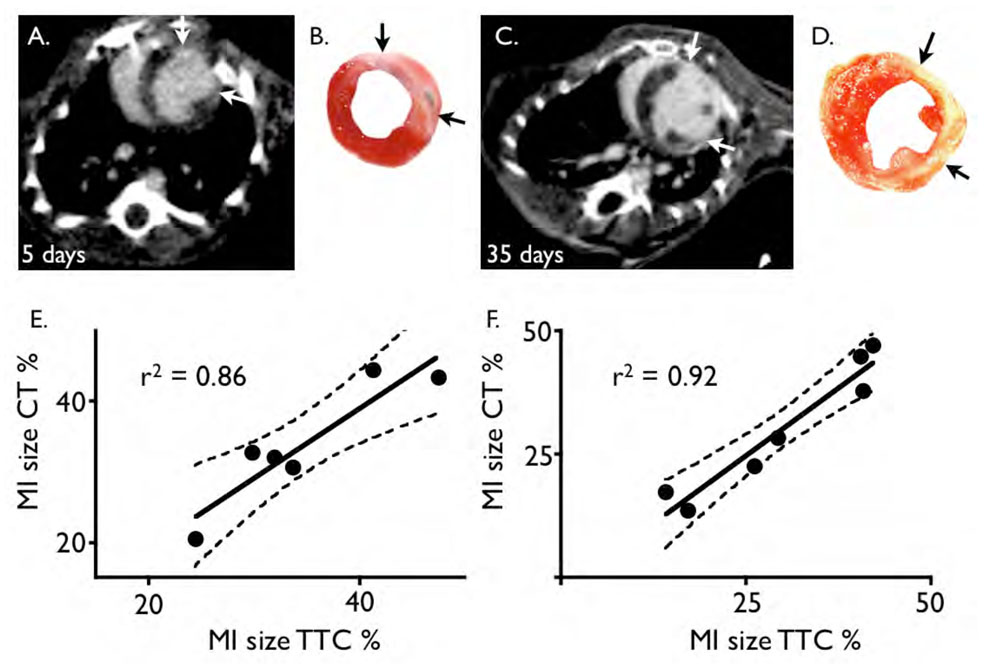
A good correlation was found between infarct size measured by CT, which was defined by hyperenhancement, and the ex vivo gold standard, TTC stained sections (Fig. 3). The unstained, pale infarct area in the viability stain correlated closely to the hyperenhanced area on CT, both on day 5 (r2=0.86, p<0.01) and day 35 after MI (r2=0.92, p<0.01). On day 5, infarct size measured by CT was 33.9±8.9% and by TTC 34.8±8.3% (p = ns), and on day 35 30.1±11.6% vs. 30.2±13.2% (p = ns), respectively.
Figure 3. CT infarct size correlates to TTC staining.
3A and B: Short axis image of a mouse 5 days after coronary ligation with respective TTC stain. The arrows depict the extension of the infarct scar.
3C and D: Same as A–B, but in a mouse 35 days after coronary ligation.
3E and F: correlation of infarct size to TTC stain for day 5 (E) and day 35 (F) after MI.
Automatic segmentation detects hyperenhanced infarct
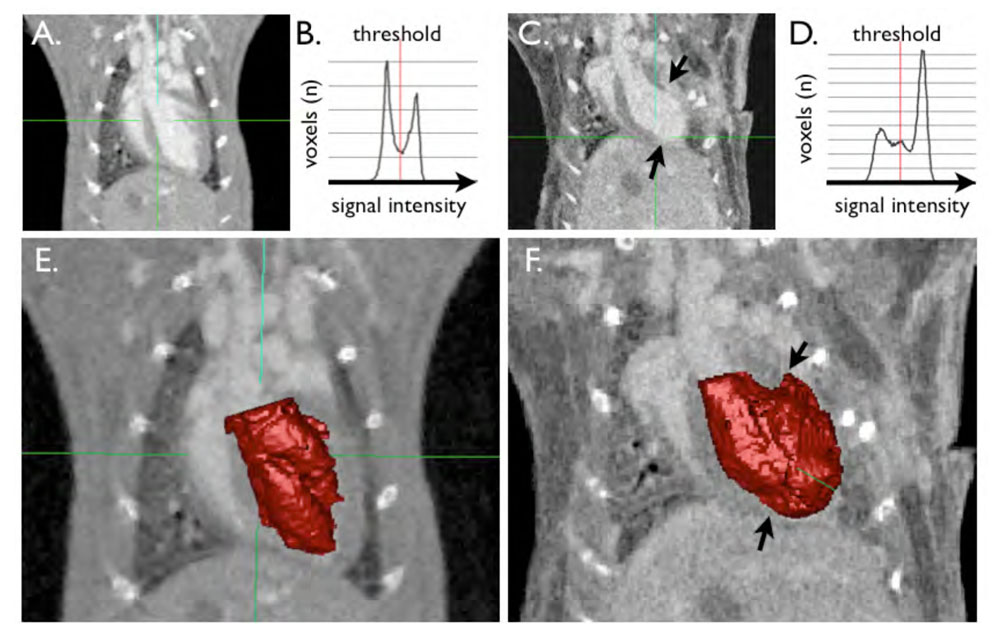
We analyzed left ventricular volumes with a semi-automated approach that relies on detection of differences in pixel signal intensities. An example of a segmented LV is shown in Fig.4. and in the online data supplement. After placement of an initial volume of interest around the LV, the software supplies a histogram of signal intensities in this region (Fig. 4B and D). Within this histogram, the threshold between compartments can now be defined interactively, while the segmentation result of the 3D slab is visualized (Fig. 4E and 4F). In healthy hearts, the histogram shows two peaks of voxel numbers; one at the blood signal intensity, and one at myocardial signal intensity (Fig. 4B). In hearts with MI, we observed a third peak, and this middle peak with intensity values between the blood and the myocardium was caused by the enhanced infarct (Fig. 4C, D, and F). The optimum threshold automatically found by a Gaussian mixture modeling approach classified the infarct voxels as blood (volume A, see the arrows in Fig. 4B,D). This confirms the hyperenhancement and allows 3D visualization of the infarct zone. For quantification of the LV cavity volume the threshold can be manually corrected to only include the blood pool (volume B). This feature also allows to rapidly quantify the 3D volume of the hyperenhanced MI by calculation of the difference between volume A and B.
Figure 4. illustrates the semi-automated segmentation technique.
A and C show long axis images of a mouse without (A) and with MI (C, between arrows). B and D show the histogram which is automatically derived from signal intensities. The first peak at lower signal intensities correlates to the myocardium, the second peak is the blood pool signal intensity. In the heart with MI (D), there is a third peak in between, which can be attributed to the hyperenhancing infarct scar. E and F demonstrate the result of the segmentation procedure. The blood pool segment is shown in red. In F, the infarct area was automatically included into the blood pool, however the threshold can be manually adjusted to exclude the scar (arrows).
Cine 3D µCT detects left ventricular remodeling after MI
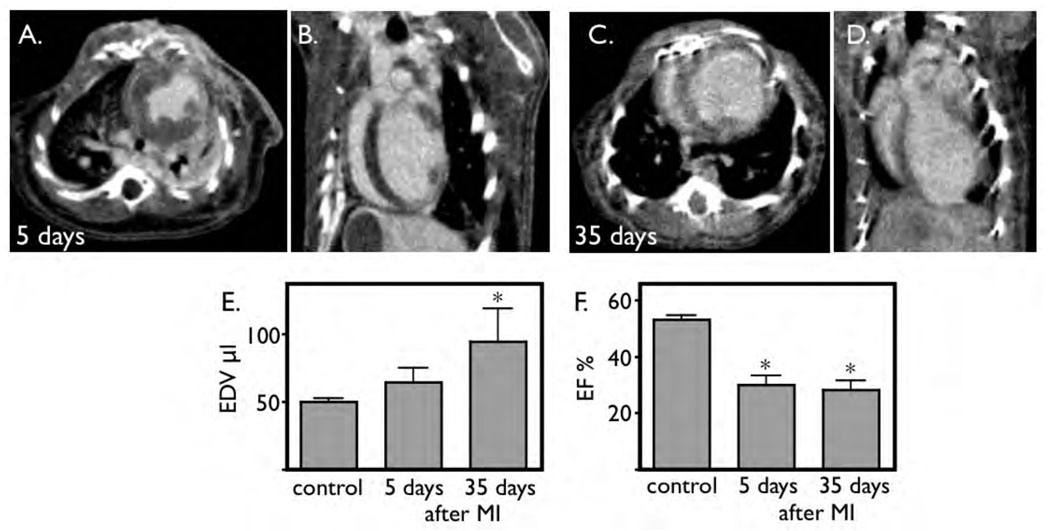
We compared left ventricular morphology and function in sham operated mice without MI to mice 5 and 35 days after coronary ligation. On day 5, some acute dilation of the left ventricle was detected, however this did not yet reach significance (Fig. 5E). As early as 5 days after infarction, the ejection fraction was severely diminished (Fig. 5F). Thirty five days after coronary ligation, the left ventricle dilated further. In the mouse with the largest infarct, the end-diastolic volume increased to 150 µL, three times the normal value. The ejection fraction remained severely impaired (28±7%, Fig. 5G).
Figure 5. Micro-CT detects LV remodeling.
A and B: short and long axis view 5 days after coronary ligation, acquired after infusion of iopamidol. C and D: Imaging on day 35 after coronary ligation. The ventricle is severely dilated.
E: The left ventricular end-diastolic volume increases progressively over time, which reaches level of significance at 35 days.
F: Induction of infarction decreases ejection fraction. This functional parameter is already significantly reduced 5 days after MI.
DISCUSSION
The mouse model of myocardial infarction has been exceedingly valuable in heart failure research14–16 and has been used in numerous studies investigating stem cells for cardiac repair.3,4, 17 Here we describe a novel approach to phenotype murine cardiac anatomy and physiology by cine 3D µCT and the application of late hyperenhancement CT infarct imaging. The technique accurately reports 3D infarct size and provides all desired anatomical and functional cardiac data of the mouse heart. Therefore, the technique is an attractive addition to the current mouse phenotyping armamentarium.
The small size and rapid movement of the mouse heart poses significant difficulties for imaging. Since the thickness of the LV wall is less than 1 mm, very high image resolution is mandatory and results in microscopic voxel sizes. At the same time, the rapid heart movement requires fast image acquisition. Acquisition of CT images of the mouse heart with an accuracy in scale to human cardiac CT18–20 necessitates a 10-fold increase in temporal resolution and a 3000-fold increase in spatial resolution. As the size of the voxel decreases, the dose must increase simultaneously to maintain sufficient signal-to-noise ratios (SNR).21 We employed a prototype cone beam µCT system with high x-ray photon fluence tubes which are 250 times brighter than the tubes on commercial micro-CT systems.22–24 This approach directly increases the SNR by an increase of the total fluence rate and resulted in high image quality despite microcopic voxel dimensions.
In line with recent reports describing late enhancement CT in large animal models10 and patients11, we found good agreement of hyperenhanced infarct scars and the ex vivo TTC stain (Fig. 3). The hyperenhanced areas accurately reported morphology and transmurality of the infarcts. Thirty minutes after the start of the infusion of the contrast agent, sufficient differences in signal intensities were detected between the infarct and uninjured myocardium. After 60 minutes, the contrast to noise ratio between infarct and uninjured myocardium reached a mean of 7.2±4.2.
As seen in patients with acute heart failure, mice are very succeptible to volume overload after large myocardial infarction. If a large volume contrast agent bolus is injected, mice may die due to acute cardiac decompensation. Therefore, we developed the described, less invasive strategy, which involves a constant slow infusion of iopamidol rather than one large volume bolus injection. Prior to imaging, we injected a small bolus of a blood pool CT contrast agent to facilitate excact placement of regions of interest for assessment of signal intensities in the blood and the myocardium. The protocol can be simplified for future phenotyping experiments. Thirty minutes after the start of the infusion of iopamidol, one cine 3D µCT dataset may be acquired, which will comprehensively and non-invasively depict the murine cardiac phenotype including infarct size and ejection fraction within an 8 minute scan. This approach ensures that all mice, including mice with extensive infarctions, survive the diagnostic procedure.
The mechanism of hyperenhancement is similar to delayed infarct hyperenhancement observed in MR imaging after injection of Gd-DPTA, which is based on an increased extracellular space and a therefore less restricted disribution of the small molecular weight contrast agent.25 In acute MI, the sarcomere membranes rupture due to ischemia, which enlarges the extracellular space. In the chronic state, the extracellular space is also relatively enlarged due to rarefication of cells. In the mature infarct, extracellular matrix such as collagen contributes extensively to the scar, and even the initially redundand fibroblasts rarify.26
Late enhancement MR imaging of infarcts has been successfully performed in mice.27 The proposed CT techique may not reach the soft image contrast and the versality of MR imaging,28 however it offers several considerable advantages. First, µCT scanners are less expensive than high field MRI systems used for murine studies. Furthermore, the spacial resolution in our CT imaging study is at least as good as the common resolution used in murine cardiac MRI,14–16,27 and even better than MRI in the z direction. Murine cardiac MRI often utilizes 2D gradient echo sequences, and the slice thickness is usually 1 mm.14–16,27 The µCT set up allowed us to acquire a time resolved 3D slab with a true isotropic resolution of 100 µm, which is ten times higher than comparable MRI techniques in the z direction. However, this advantage in spatial resolution needs to be weighted against the lower temporal resolution possible with cine CT. Another advantage may be the relative ease of integration of the CT modality into hybrid imaging systems such as SPECT-CT and PET-CT. These hybrid systems are utilized to overcome the inherent low resolution (1–2mm) of the very sensitive nuclear imaging modalities and provide the source of a given molecular imaging agent in greater anatomic detail. While these systems are commercially available, they still lack the sophistication of the prototype µCT employed in this study. Nevertheless, hybrid nuclear imaging systems are increasingly used to assess myocardial healing.29 Late enhancement imaging can enhance the utility of the CT modality further, since it distingiushes between the infarct and the uninjured remote myocardium. This information is of importance, since molecular targets and biologicial processes differ greatly between the infarct and the remote myocardium. For instance, if stem cell migration was to be assessed with reporter gene imaging techiques,17 it is of interest if the cells home in on the infarct, which could be accurately outlined by late enhancement CT. Furthermore, we believe that cine 3D µCT may evolve into a cost effective and very sensitive diagnostic tool for the in-vivo assessment of novel candidate drugs and for mouse phenotyping. In addition to rapidly delivering precise data, the non-invasive character facilitates serial studies of murine cardiac morphology, thereby greatly enhancing the sensitivity to detect remodeling of the left ventricle.
In conclusion, we propose a novel imaging technique applicable to the mouse model of myocardial infarction. Cine 3D late enhancement µCT enables accurate measurement of murine cardiac morphology and exactly identifies the infarct region, and may be a valuable tool for murine cardiac phenotyping.
ACKNOWLEDGEMENTS
The authors would like to acknowledge Peter Waterman for assistance with animal transfers.
Support Sources: RO1 HL078641 (RW), UO1 HL080731 (RW), R24 CA92782 (RW), Donald W. Reynolds Foundation (RW, MN). Imaging was performed at the Duke Center for In Vivo Microscopy, an NIH/NCRR National Biomedical Technology Resource (NCRR P41 RR005959), with additional support from NCI R24 CA 092656, and NHLBI 5R01-HL055348.
Footnotes
Conflicts of Interest: none
REFERENCES
- 1.Pfeffer JM, Pfeffer MA, Braunwald E. Hemodynamic benefits and prolonged survival with long-term captopril therapy in rats with myocardial infarction and heart failure. Circulation. 1987 Jan;75(1 Pt 2):1149–1155. [PubMed] [Google Scholar]
- 2.Yang XP, Liu YH, Mehta D, Cavasin MA, Shesely E, Xu J, Liu F, Carretero OA. Diminished cardioprotective response to inhibition of angiotensin-converting enzyme and angiotensin II type 1 receptor in B(2) kinin receptor gene knockout mice. Circ Res. 2001 May 25;88(10):1072–1079. doi: 10.1161/hh1001.090759. [DOI] [PubMed] [Google Scholar]
- 3.Anversa P, Nadal-Ginard B. Myocyte renewal and ventricular remodelling. Nature. 2002 Jan 10;415(6868):240–243. doi: 10.1038/415240a. [DOI] [PubMed] [Google Scholar]
- 4.Chien KR. Stem cells: lost in translation. Nature. 2004 Apr 8;428(6983):607–608. doi: 10.1038/nature02500. [DOI] [PubMed] [Google Scholar]
- 5.Nahrendorf M, Wiesmann F, Hiller KH, Hu K, Waller C, Ruff J, Lanz TE, Neubauer S, Haase A, Ertl G, Bauer WR. Serial cine-magnetic resonance imaging of left ventricular remodeling after myocardial infarction in rats. J Magn Reson Imaging. 2001 Nov;14(5):547–555. doi: 10.1002/jmri.1218. [DOI] [PubMed] [Google Scholar]
- 6.Gaudron P, Eilles C, Kugler I, Ertl G. Progressive left ventricular dysfunction and remodeling after myocardial infarction. Potential mechanisms and early predictors. Circulation. 1993 Mar;87(3):755–763. doi: 10.1161/01.cir.87.3.755. [DOI] [PubMed] [Google Scholar]
- 7.Vogel-Claussen J, Rochitte CE, Wu KC, Kamel IR, Foo TK, Lima JA, Bluemke DA. Delayed enhancement MR imaging: utility in myocardial assessment. Radiographics. 2006 May–Jun;26(3):795–810. doi: 10.1148/rg.263055047. [DOI] [PubMed] [Google Scholar]
- 8.Grothues F, Smith GC, Moon JC, Bellenger NG, Collins P, Klein HU, Pennell DJ. Comparison of interstudy reproducibility of cardiovascular magnetic resonance with two-dimensional echocardiography in normal subjects and in patients with heart failure or left ventricular hypertrophy. Am J Cardiol. 2002 Jul 1;90(1):29–34. doi: 10.1016/s0002-9149(02)02381-0. [DOI] [PubMed] [Google Scholar]
- 9.Badea CT, Fubara B, Hedlund LW, Johnson GA. 4-D micro-CT of the mouse heart. Mol Imaging. 2005 Apr–Jun;4(2):110–116. doi: 10.1162/15353500200504187. [DOI] [PubMed] [Google Scholar]
- 10.Lardo AC, Cordeiro MA, Silva C, Amado LC, George RT, Saliaris AP, Schuleri KH, Fernandes VR, Zviman M, Nazarian S, Halperin HR, Wu KC, Hare JM, Lima JA. Contrast-enhanced multidetector computed tomography viability imaging after myocardial infarction: characterization of myocyte death, microvascular obstruction, and chronic scar. Circulation. 2006 Jan 24;113(3):394–404. doi: 10.1161/CIRCULATIONAHA.105.521450. [DOI] [PMC free article] [PubMed] [Google Scholar]
- 11.Gerber BL, Belge B, Legros GJ, Lim P, Poncelet A, Pasquet A, Gisellu G, Coche E, Vanoverschelde JL. Characterization of acute and chronic myocardial infarcts by multidetector computed tomography: comparison with contrast-enhanced magnetic resonance. Circulation. 2006 Feb 14;113(6):823–833. doi: 10.1161/CIRCULATIONAHA.104.529511. [DOI] [PubMed] [Google Scholar]
- 12.Feldkamp LADL, Kress JW. Practical cone-beam algorithm. J. Opt. Soc. Am. 1984;1(6):612–619. [Google Scholar]
- 13.Arora SKR. Learning Mixtures of Arbitrary Gaussians. Paper presented at: ACM Symposium on Theory of Computing; Hersonissos, Greece. 2001. [Google Scholar]
- 14.Sosnovik DE, Schellenberger EA, Nahrendorf M, Novikov MS, Matsui T, Dai G, Reynolds F, Grazette L, Rosenzweig A, Weissleder R, Josephson L. Magnetic resonance imaging of cardiomyocyte apoptosis with a novel magneto-optical nanoparticle. Magn Reson Med. 2005 Sep;54(3):718–724. doi: 10.1002/mrm.20617. [DOI] [PubMed] [Google Scholar]
- 15.Nahrendorf M, Streif JU, Hiller KH, Hu K, Nordbeck P, Ritter O, Sosnovik D, Bauer L, Neubauer S, Jakob PM, Ertl G, Spindler M, Bauer WR. Multimodal functional cardiac MRI in creatine kinase-deficient mice reveals subtle abnormalities in myocardial perfusion and mechanics. Am J Physiol Heart Circ Physiol. 2006 Jun;290(6):H2516–H2521. doi: 10.1152/ajpheart.01038.2005. [DOI] [PubMed] [Google Scholar]
- 16.Nahrendorf M, Hu K, Frantz S, Jaffer FA, Tung CH, Hiller KH, Voll S, Nordbeck P, Sosnovik D, Gattenlohner S, Novikov M, Dickneite G, Reed GL, Jakob P, Rosenzweig A, Bauer WR, Weissleder R, Ertl G. Factor XIII deficiency causes cardiac rupture, impairs wound healing, and aggravates cardiac remodeling in mice with myocardial infarction. Circulation. 2006 Mar 7;113(9):1196–1202. doi: 10.1161/CIRCULATIONAHA.105.602094. [DOI] [PMC free article] [PubMed] [Google Scholar]
- 17.Cao F, Lin S, Xie X, Ray P, Patel M, Zhang X, Drukker M, Dylla SJ, Connolly AJ, Chen X, Weissman IL, Gambhir SS, Wu JC. In vivo visualization of embryonic stem cell survival, proliferation, and migration after cardiac delivery. Circulation. 2006 Feb 21;113(7):1005–1014. doi: 10.1161/CIRCULATIONAHA.105.588954. [DOI] [PMC free article] [PubMed] [Google Scholar]
- 18.Nieman K, Cury RC, Ferencik M, Nomura CH, Abbara S, Hoffmann U, Gold HK, Jang IK, Brady TJ. Differentiation of recent and chronic myocardial infarction by cardiac computed tomography. Am J Cardiol. 2006 Aug 1;98(3):303–308. doi: 10.1016/j.amjcard.2006.01.101. [DOI] [PubMed] [Google Scholar]
- 19.Fayad ZA, Sirol M, Nikolaou K, Choudhury RP, Fuster V. Magnetic resonance imaging and computed tomography in assessment of atherosclerotic plaque. Curr Atheroscler Rep. 2004 May;6(3):232–242. doi: 10.1007/s11883-004-0037-2. [DOI] [PubMed] [Google Scholar]
- 20.Ravenel JG, Savino G, Schoepf UJ. Novel developments in cardiac computed tomography. Am Heart Hosp J. 2005 Summer;3(3):167–174. doi: 10.1111/j.1541-9215.2005.04547.x. [DOI] [PubMed] [Google Scholar]
- 21.Ford NLTM, Holdsworth DW. Fundamental image quality limits for microcomputed tomography in small animals. Med Phys. 2003;30:2869–2877. doi: 10.1118/1.1617353. [DOI] [PubMed] [Google Scholar]
- 22.Badea CTHL, Johnson GA. Micro-CT with respiratory and cardiac gating. Med Phys. 2004;31:3324–3329. doi: 10.1118/1.1812604. [DOI] [PMC free article] [PubMed] [Google Scholar]
- 23.Badea C, Hedlund LW, Wheeler C, Mai W, Johnson GA. Volumetric micro-CT system for in vivo microscopy. Paper presented at: IEEE International Symposium on Biomedical Imaging: From Nano to Macro; Arlington, VT. 2004. [Google Scholar]
- 24.Paulus MJ, Gleason SS, Easterly ME, Foltz CJ. A review of high-resolution X-ray computed tomography and other imaging modalities for small animal research. Lab Anim (NY) 2001 Mar;30(3):36–45. [PubMed] [Google Scholar]
- 25.Kim RJ, Chen EL, Lima JA, Judd RM. Myocardial Gd-DTPA kinetics determine MRI contrast enhancement and reflect the extent and severity of myocardial injury after acute reperfused infarction. Circulation. 1996 Dec 15;94(12):3318–3326. doi: 10.1161/01.cir.94.12.3318. [DOI] [PubMed] [Google Scholar]
- 26.Cleutjens JP, Blankesteijn WM, Daemen MJ, Smits JF. The infarcted myocardium: simply dead tissue, or a lively target for therapeutic interventions. Cardiovasc Res. 1999 Nov;44(2):232–241. doi: 10.1016/s0008-6363(99)00212-6. [DOI] [PubMed] [Google Scholar]
- 27.Yang Z, Berr SS, Gilson WD, Toufektsian MC, French BA. Simultaneous evaluation of infarct size and cardiac function in intact mice by contrast-enhanced cardiac magnetic resonance imaging reveals contractile dysfunction in noninfarcted regions early after myocardial infarction. Circulation. 2004 Mar 9;109(9):1161–1167. doi: 10.1161/01.CIR.0000118495.88442.32. [DOI] [PubMed] [Google Scholar]
- 28.Simonetti OP, Kim RJ, Fieno DS, Hillenbrand HB, Wu E, Bundy JM, Finn JP, Judd RM. An improved MR imaging technique for the visualization of myocardial infarction. Radiology. 2001 Jan;218(1):215–223. doi: 10.1148/radiology.218.1.r01ja50215. [DOI] [PubMed] [Google Scholar]
- 29.Su H, Spinale FG, Dobrucki LW, Song J, Hua J, Sweterlitsch S, Dione DP, Cavaliere P, Chow C, Bourke BN, Hu XY, Azure M, Yalamanchili P, Liu R, Cheesman EH, Robinson S, Edwards DS, Sinusas AJ. Noninvasive targeted imaging of matrix metalloproteinase activation in a murine model of postinfarction remodeling. Circulation. 2005 Nov 15;112(20):3157–3167. doi: 10.1161/CIRCULATIONAHA.105.583021. [DOI] [PubMed] [Google Scholar]


