

Abstract
Changes in DNA methylation patterns are a common characteristic of cancer cells. Recent studies suggest that DNA methylation affects not only discrete genes, but it can also affect large chromosomal regions, potentially leading to long range epigenetic silencing. It is unclear whether such long-range epigenetic events are relatively rare or frequent occurrences in cancer. Here we use a high-resolution promoter tiling array approach to analyze DNA methylation in breast cancer specimens and normal breast tissue to address this question. We identified 3506 cancer specific differentially methylated regions (DMR) in human breast cancer with 2033 being hypermethylation events and 1473 hypomethylation events. Most of these DMRs are recurrent in breast cancer; 90% of the identified DMRs occurred in at least 33% of the samples. Interestingly, we found a non-random spatial distribution of aberrantly methylated regions across the genome that showed a tendency to concentrate in relatively small genomic regions. Such agglomerates of hyper- and hypomethylated DMRs spanned up to several hundred kilobases and were frequently found at gene family clusters. The hypermethylation events usually occurred in the proximity of the transcription start site in CpG island promoters while hypomethylation events were frequently found in regions of segmental duplication. One example of a newly discovered agglomerate of hypermethylated DMRs associated with gene silencing in breast cancer that we examined in greater detail involved the protocadherin gene family clusters on chromosome 5 (PCDHA, PCDHB, and PCDHG). Taken together, our results suggest that agglomerative epigenetic aberrations are frequent events in human breast cancer.
Keywords: DNA methylation, epigenetic, breast cancer, CpG island, silencing
Introduction
Aberrant levels and patterns of cytosine methylation are ubiquitous events in human cancer (1). DNA hypomethylation generally occurs often in repetitive elements, pericentromeric regions, and within the body of genes (2–4). In contrast, DNA hypermethylation is largely limited to CpG island regions (5–7). Some gene targets of DNA hypermethylation are found in a broad spectrum of different tumor types, while others occur in a tumor type specific fashion (8). Studies into the biological consequences of hypo- and hypermethylation suggest that each plays a participative role in carcinogenesis. Earlier studies suggested that hypermethylation events were focal in nature, usually associated with the transcriptional silencing of one gene. Recent studies show that DNA hypermethylation can extend over regions of the genome from 100 to >1000kb in size and is linked to long range epigenetic silencing (LRES) (9–11).
These LRES events have practical parallels to genetic lesions, such as deletions and microdeletions, in that in both cases long contiguous stretches of DNA have become functionally inactivated. With respect to the epigenetic events, the long range silencing is associated with an epigenetic terrain consisting of landmarks linked to a repressed chromatin state, such as aberrant DNA methylation and/or histone modification state (9–12). Considering the gross genetic and epigenetic changes that occur in a cancer cell, it is likely that diverse inappropriate combinations of epigenetic landmarks will partner together to produce aberrant gene silencing. This long range epigenetic silencing is metastable and reversible with drugs that target epigenetic control mechanisms (9, 10).
We set out to better determine the scope and the spatial organization of aberrant DNA methylation and its relationship to LRES in human breast cancer. Using epigenomic scanning approaches, we analyzed a set of normal and cancerous breast specimens, a limited lifespan human mammary epithelial cell strain, and breast cancer cell lines to identify differentially methylated regions (DMRs) between normal and malignant breast tissue. Locations of DMRs revealed that aberrant DNA methylation is not randomly distributed across the cancer genome, and agglomerates of DMRs can be identified, consisting of agglomerates of both hypermethylated and hypomethylated DMRs that ranged from approximately 30kbp to almost 600kbp in size. These aberrant agglomerative methylation events can occur multiple times within an individual tumor and are associated with long range epigenetic silencing events. The types of promoters and the regions affected by DNA hypomethylation were distinct from those targeted by hypermethylation; however, a feature common to both types was their apparent concentration in gene family clusters.
Materials and Methods
Cell culture
All cell lines were maintained as previously described (9). The MDA-MB-231 and BT549 breast cancer cells were obtained from the American Type Culture Collection (Rockville, MD). Cell line identity was assured by genotypic analysis by DNA fingerprinting using STRs. Normal human mammary epithelial cells (HMEC) were obtained from Clonetics (San Diego, CA), and were grown according to supplier’s instructions.
Breast Tumor specimens
Flash frozen specimens derived from normal or cancerous breast tissue were obtained from patients who underwent surgery for breast cancer, either lumpectomy or mastectomy, at the University Medical Center in Tucson, AZ., from 2003–2005. All patients signed surgical and clinical research consents for tissue collection in accordance with the University of Arizona IRB and HIPAA regulations. At the time of surgery, a 1–3 cm section of the tumor was immediately snap frozen in liquid nitrogen and stored in our prospective breast tissue bank at −80 degree Celsius. From each tissue block, a series of 5 micron sections were cut and stained with hematoxylin and eosin (H&E) for pathological evaluation. All H&E slides were reviewed by two independent pathologists to determine the integrity of the tumor specimen. A partial molecular characterization of these samples have been reported on previously (9). Supplemental Table 1 provides the pathological assessment of each specimen.
Nucleic Acid Isolation
RNA and DNA were isolated as previously described (9).
Bisulfite Sequencing and DNA sequence analysis
Genomic DNA was analyzed by bisulfite sequencing as described (13). The protocadherin CpG islands were amplified from the bisulfite-modified DNA by two rounds of PCR using nested primers. Primer sequences are available upon request.
DNA Methylation Analysis by MassARRAY
Sodium bisulfite (NaBS) treated genomic DNA was prepared according to manufacturer’s instructions (Zymo Research, Orange, CA). NaBS treated DNA (5ng) was seeded into a region specific PCR reaction incorporating a T7 RNA polymerase sequence as described by the manufacturer (Sequenom, San Diego, CA). Resultant PCR product was then subjected to in-vitro transcription and RNase A cleavage using the MassCLEAVE T-only kit, spotted onto a Spectro CHIP array, and analyzed using the MassARRAY Compact System MALDI-TOF mass spectrometer (Sequenom, San Diego, CA). Each NaBS treated DNA sample was processed in two independent experiments. Data were analyzed using EpiTyper software (Sequenom, San Diego, CA) and the R-script “Analyze Sequenom Function” using methods described previously (14). Primer sequences were designed using EpiDesigner (www.epidesigner.com). Primer sequences are available upon request.
Real-Time RT-PCR
Total RNA was converted to cDNA and then amplified in a real time PCR format using gene-specific primers and fluorescent probes using Roche UniversalProbe technology and the ABI 7500 Real-Time Detection System (Applied Biosystems). Results were calculated using the Delta Ct method normalizing to GAPDH expression. Primer sequences are available upon request.
Methyl DNA Immunoprecipitation (MeDIP) Microarrays and Data Analysis
Methylated fraction of DNA was obtained by immunoprecipitation as described (15). 200 ng of enriched fraction and corresponding input DNA were hybridized on Affymetrix GeneChip® Human Promoter 1.0R Array according to manufacturer’s protocol.
Tiling Analysis Software (Affymetrix) was used to extract signal intensities and map them to corresponding genomic position based on NCBI human genome assembly (Build 34). Subsequent data processing and data analysis was done using R programming environment (16). Signal intensities were loess normalized, then input intensities were subtracted from corresponding MeDIP intensities. Resulting MeDIP/Input ratios were again loess normalized. For each probe, a quality weight was calculated as previously described (17). To find differentially methylated regions in normal and cancerous samples, t statistics was calculated for each probe. To combine information from neighboring probes and, a weighted moving average (window 1000 bp) was computed as final summary statistics for each probe. The same procedure was done with probe positions randomly permutated to find the appropriate cutoff for false discovery rate 5%. The positions of all positive regions can be found in supplemental data as an annotation track that can be visualized in UCSC Genome Browser. Multiple occurrences of DMR sequences were analysed using BLAT alignment tool (18). The raw data from these microarray studies have been deposited in the Array Express database, accession E-MEXP-1481 (www.ebi.ac.uk/arrayexpress).
For data presented in Figure 2A, the expected (theoretical) distances of randomly distributed DMRs were calculated by taking the number of DMRs detected in the sample set and randomly distributing this number through the regions covered by the promoter array. Distances between DMRs from these simulations were then calculated; the average results of 50 simulations are shown. The random distribution simulation was performed separately for hypermethylated and hypomethylated DMRs.
Figure 2.
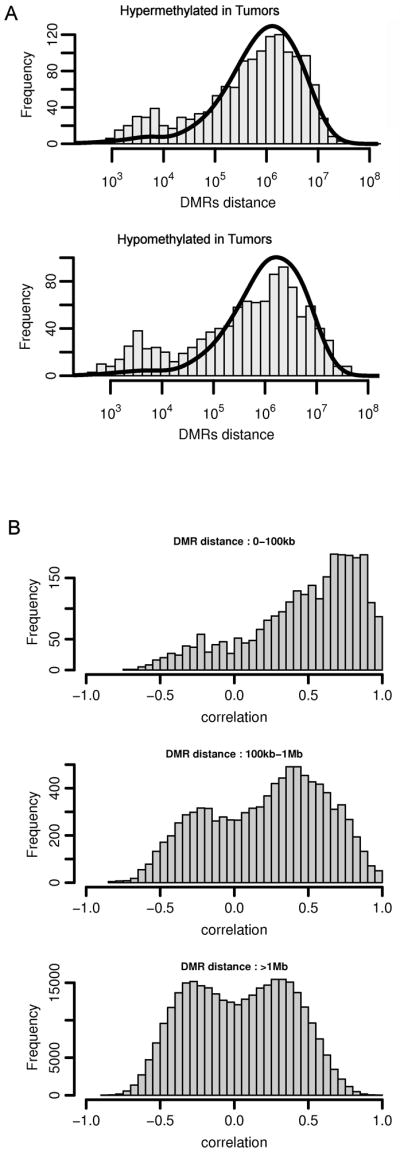
Cancer-specific DMRs are non-randomly distributed across the genome. (A) Non-random distribution of hypermethylation and hypomethylation DMRs in breast tumors. The histogram shows the distribution of distances between neighboring DMRs. The solid line shows the theoretical distances between neighboring DMRs based on simulated data sets of random spatial distributions. The increased frequency of DMRs closer than 105 bp suggests that tumor specific DMRs are non-randomly distributed across the genome. (B) Correlation between pairs of DMRs is dependent on their physical distance. Pearson correlation coefficients were calculated for each pair of DMRs based on microarray data. Correlation coefficients were then divided into three groups according to the distance between DMRs in each DMR pair. Note the strong positive correlation coefficients among proximate DMRs that decreases to no correlation as more distant DMRs are considered. The positive correlation coefficients among nearby DMRs that are closer than 100kb suggests that aberrant DNA methylation events in these proximate regions are not independent processes.
Chromatin Immunoprecipitations
Chromatin immunoprecipitations (ChIPs) were performed as previously described (19). The antibodies directed toward histone H3 lysine-9 dimethylation (DiMeK9) and H3 lysine-27 trimethylation (TriMeK27) were purchased from Upstate/Millipore (Billerica, MA). Primer sequences are available upon request.
Results
In this study, we sought to examine the nature and spatial organization of aberrant DNA methylation in invasive human breast cancers and corresponding cell line models. The DNA methylation-state of 16 invasive breast tumors, 5 histologically normal breast specimens and 4 pure cell line/strain populations derived from cancerous and normal mammary tissue was analyzed using the Affymetrix Human gene promoter array 1.0R, a more comprehensive approach that provided greater and more focused genomic coverage than our previous studies (9, 20). Labeled targets from each of the samples for microarray hybridizations were generated from the 5-methylcytosine-specific antibody enriched fraction of the DNA, as well as the total the genomic DNA (Input). Input DNA was used as a reference control ensuring that each sample analyzed for DNA methylation was compared to its own unique genome. This reference approach served to minimize false discovery due to other genomic aberrations, such as gene amplification.
We identified 3506 cancer specific differentially methylated regions (DMRs) which were either aberrantly hypermethylated (2033) or hypomethylated (1473) in cancerous tissue. A DMR was defined as any region covered by a group of consecutive probes on the tiling array that exhibited statistically significant differences in normalized signal (i.e. MeDIP/Input ratio) between the group of normal and the group of cancerous specimens. A vast majority (99%) of these DMRs covered 8 to 115 tiling array probes and therefore ranged in size from 280 to 4000 bp; 1000bp was the most frequent DMR size. The methylation status of each of these DMRs was analyzed in each individual cancer specimen relative to the normal specimens, which enabled us to determine the number of aberrantly methylated DMRs in each individual tumor as well as the frequency of aberrant methylation for each DMR within the sample population as whole. This analysis revealed that each cancerous specimen exhibits hypomethylation and hypermethylation in approximately 25 to 75% of the 3506 DMRs identified (Figure 1A). Finally, most of the DMRs that we detected are recurrent in the breast cancer. Approximately 90% of these DMRs are aberrantly methylated in at least 33% of our sample set (Figure 1B). Overall, these results indicate that there are thousands of recurrent DMRs in a substantial fraction of human breast cancers.
Figure 1.

Analysis of the spatial distribution of breast tumor specific DMRs across the genome. (A) The number of aberrantly methylated DMRs found in individual tumors. Red and green bars represent the number of sites which were hypermethylated or hypomethylated, respectively. (B) Most of individual DMRs are recurrent and can be found in multiple tumors. For each DMR, the number of tumors in which a specific DMR is aberrantly methylated was counted (x axis) and total amount of DMRs in each frequency group is shown on y axis. The arrow delimits 90% of all DMRs. Red and green bars represent the number of sites which were hypermethylated or hypomethylated, respectively. (C) Distribution of 2033 regions hypermethylated in breast tumor specimens and 1473 hypomethylated regions along chromosomes is shown. The DMR frequency is plotted along chromosome, positive peaks correspond to hypermethylated regions, negative peaks to hypomethylated regions. The locations of the HOXA, GAGE, DEF and PCDH DMRs are labeled. Window size is 100 kb. (D) A heat map that shows chromosome 5 DMRs ordered by their physical position. Red and green represents regions of hypermethylation and hypomethylation, respectively. Samples were sorted using hierarchical clustering; cancer specimens are labeled blue, normal specimens in red. Note the high density of DMR around position 140 Mbp corresponding to PCDH cluster. Heatmaps for other chromosomes can be found as Supplemental Figure 1.
In order to identify potential long-range events, we analyzed the spatial distribution of the DMRs across all 23 chromosomes (Figure 1C). Positive peaks indicate hypermethylated regions whereas negative peaks indicate hypomethylated regions. The amplitude of each peak is proportional to the number of DMRs found within a 100kb window, and therefore the largest peaks in Figure 1C reveal agglomerates of DMRs - regions with the highest density of aberrant DNA methylation. The agglomerates containing hypermethylated DMRs then represent regions with the potential for DNA methylation-associated LRES.
Examination of the DNA methylation chromosomal plot in Figure 1C shows that we could detect multiple regions of agglomerative DNA methylation. One such region is the HOXA gene family cluster, which we previously identified in breast cancer (9), thereby providing empirical support for the analytical approach used to detect aberrant DNA methylation related to LRES. One novel region of agglomerative DNA hypermethylation discovered is located on chromosome 5 and is associated with the three protocadherin gene clusters (PCDHA, PCDHB, and PCDHG). A heat map of the DNA methylation state of all DMRs ordered by physical position along chromosome 5 is shown in Figure 1D. The patient samples were ordered by hierarchical clustering and the heat map allows visualization of the hypermethylated DMRs associated with the PCDH gene clusters. We also detected agglomerative hypomethylation events specific to cancer; one of which was localized to the GAGE gene family cluster on the X chromosome. The GAGE genes are tumor-specific antigens not expressed in adult somatic tissues, but undergo a transcriptional activation during carcinogenesis that has been associated with DNA hypomethylation (21, 22).
We evaluated whether the agglomeration of DMRs in apparent hotspots was simply due to chance or if DMRs clustered in a cancer-driven fashion. One way in which this was assessed was through an analysis of the distributions of genomic distances between neighboring hyper- and hypomethylated DMRs. Figure 2A shows the frequency of distances between DMRs in the data obtained (histogram) compared to the frequency of theoretical distances based on a simulated random spatial distribution of DMRs (overlaid solid line). Overall, the results were quite similar for both hyper- and hypomethylated DMRs. In both cases, the observed and expected (theoretical) distribution shows the majority of DMRs occur approximately 106 bp apart; however, when the observed data is further compared to the expected data, there is an increased frequency of hypermethylated as well as hypomethylated DMRs that have a spacing of less than 104 bp. Thus, the divergence of the observed DMR distributions from the expected DMR distributions suggests that aberrant DNA methylation is non-randomly distributed across the breast cancer genome.
We explored the distribution of DMRs further and found that the location of individual DMRs are positively correlated with methylation changes of proximate DMR sites (less than 100 kb apart). This effect is practically null for distant sites (more than 1Mb, Figure 2B). In other words, there is a higher probability that proximate DMR sites will exhibit the same aberrant methylation status in a particular sample. Examples of such correlated regions can be seen on Figure 1D around positions 20 Mbp and 140 Mbp. This phenomenon suggests that there is a common factor affecting methylation status of such aberrant methylation prone regions, and provides further support for the idea that cancer-specific aberrant methylation is distributed across the genome in a non-random fashion.
Further examination of the genomic characteristics of the promoter-associated DMRs revealed other features that distinguished hypermethylation from hypomethylation events in the invasive breast cancers. Results in Figure 3A show that the aberrant hypermethylation events in breast cancer were linked to CpG-rich regions, with 38% of hypermethylated DMRs coincident with CpG islands, whereas only 6% of hypomethylation DMRs were linked to CpG islands. The locations of these DMRs within the 10kb promoter regions assayed on the gene promoter array were also determined (Figure 3B). DMRs associated with aberrant hypermethylation were concentrated in the region near transcription start, whereas hypomethylated DMRs were more evenly distributed throughout the promoter region.
Figure 3.

Characteristics of DMRs. (A) Hypermethylated and hypomethylated tumor specific DMRs differ in CpG content. Regions targeted for hypermethylation in tumor specimens have a higher CpG content than regions of hypomethylation, with 38% of the hypermethylated regions overlap with known CpG islands while only 6% of hypomethylated sequences overlap with CpG islands. (B) Localization of tumor specific DMRs relative to transcription start sites (TSS). Positions of the detected DMRs were compared with the positions of TSS taken from the UCSC genome browser (SwitchGear TSS Track). Overall frequency does not reach 100% since not all DMR detected on the promoter microarray mapped to the known TSS; 32 % of hypermethylated and 54% hypomethylated sites were out of the range that was analyzed (−7kb to +3 kb).
The types of promoter regions targeted by DNA hypermethylation and hypomethylation differed further. Cancer-specific DNA hypomethylation events occurred at a higher frequency in regions of segmental duplications, while DNA hypermethylation events were heavily biased towards single copy sequences (Table 1). Taken together, these results suggest that both long-range DNA hyper- and hypomethylation events occur in human breast cancer, and that the occurrence of these events show regional selectivity both within promoter regions and throughout the genome.
Table 1.
Hyper- and Hypomethylated DMRs occurrences in single copy and duplicate copy genomic sequences.
| Hypermethylation | Hypomethylation | |
|---|---|---|
| DMRs total | 2033 | 1473 |
| Single copy DMRs | 1835(90.3%) | 1016(69%) |
| Duplicated DMRs | 198 (9.7%) | 457(31%) |
| Average copy number of duplicated DMRs | 4.5 | 8.8 |
Table 2 shows the chromosomal regions associated with the highest density of DMRs within the breast cancer samples when compared to normal tissue. The HOXA genes are present and representative of hypermethylation events, while GAGE genes are present and representative of hypomethylation events. Table 2 also shows a range of 22 to 89% for the frequency of occurrence of the 15 agglomerative DNA methylation events detected in the breast cancer samples. In general, these results show that DNA agglomerative events occur at frequencies that are comparable to and exceed the frequency of common genetic mutations in breast cancer, such as p53 (23). Interestingly, there was a prevalence of gene family clusters in the list of agglomerates of DMRs including the protocadherin gene family clusters (PCDHA, PCDHB, and PCDHG), the HOXA gene cluster, the HOXD gene cluster, and a histone gene cluster.
Table 2.
Genomic regions of agglomerative epigenetic aberrations in breast cancer. DMRs were grouped together when the distance between them was smaller than 100kb. Regions with clusters of ≥ 8 consecutive DMRs are shown.
| Hypermethylated in tumors | |||||||
|---|---|---|---|---|---|---|---|
| Chromosome | From [bp] | To [bp] | Size[kbp] | Number of DMRs | Frequency* [% of patients] | Genes within region | |
| chr1 | 16567504 | 16838375 | 271 | 8 | 33 | BC006312, AK123337 | |
| chr2 | 176771543 | 176880741 | 109 | 13 | 44 | HOXD13, HOXD11, HOXD10, HOXD9, AK092134, HOXD8, HOXD4, HOXD3 | |
| chr5 | 140145947 | 140287745 | 142 | 11 | 50 | AK091409, PCDHA1, PCDHA10, PCDHA11, PCDHA12, PCDHA13, PCDHA2, PCDHA3, PCDHA4, PCDHA5, PCDHA6, PCDHA7, PCDHA8, PCDHA9, PCDHAC1 | |
| chr5 | 140455538 | 140838940 | 383 | 32 | 67 | BC031837, BC051788, PCDHB10, PCDHB11, PCDHB12, PCDHB13, PCDHB14, PCDHB15, PCDHB16, PCDHB17, PCDHB18, PCDHB2, PCDHB3, PCDHB4, PCDHB5, PCDHB6, PCDHB7, PCDHB8, PCDHGA1, PCDHGA10, PCDHGA11, PCDHGA12, PCDHGA2, PCDHGA3, PCDHGA4, PCDHGA5, PCDHGA6, PCDHGA7, PCDHGA8, PCDHGA9, PCDHGB1, PCDHGB2, PCDHGB3, PCDHGB4, PCDHGB5, PCDHGB6, PCDHGB7, PCDHGC3, SLC25A2, TAF7 | |
| chr6 | 26290824 | 26381754 | 91 | 8 | 28 | HIST1H2BE, HIST1H4D, HIST1H3D, HIST1H2AD, BC056264, HIST1H2BF, HIST1H4E, BC082232, HIST1H2BG, HIST1H2AE, HIST1H3E, HIST1H1D, HIST1H4F, HIST1H4G, HIST1H3F, HIST1H2BH, HIST1H3G, HIST1H2BI | |
| chr6 | 33273119 | 33532803 | 260 | 9 | 22 | RXRB, X66424, SLC39A7, HSD17B8, RING1, VPS52, BC040114, AK093057, AK001725, RPS18, AY536376, B3GALT4, C6orf11, HKE2, RGL2, AB012295, BC064966, BC080574, TAPBP, ZNF297, DAXX, AF090423, KIFC1, PHF1, C6orf82, SYNGAP1, AB067525, ZBTB9 | |
| chr7 | 26909767 | 27055875 | 146 | 13 | 44 | HOXA3, AK056230, HOXA4, HOXA5, HOXA6, HOXA7, HOXA9, HOXA10, BC007600, HOXA11, HOXA13 | |
| Hypomethylated in tumors | |||||||
| Chromosome | From[bp] | To[bp] | Size [kbp] | Number of DMRs | Frequency* [% of patients] | Genes within region | |
| chr1 | 244610973 | 245171804 | 561 | 23 | 39 | OR2M2, OR2M3, OR2M4, OR2T33, OR2T12, OR2M7, OR5BF1, OR2T4, OR2T1, OR2T2, OR2T3, OR2T5, OR2G6, OR2T29, OR2T34, OR2T10, OR2T11, OR2T35 | |
| chr4 | 9019357 | 9047147 | 28 | 12 | 89 | DUB3, AY533200 | |
| chr5 | 17551068 | 17642039 | 91 | 9 | 67 | no genes | |
| chr8 | 6826023 | 6934557 | 109 | 12 | 22 | DEFA1, DEFA3, DEFA5 | |
| chr8 | 7061201 | 7315981 | 255 | 18 | 56 | DEFB4, DEFB103A, SPAG11, DEFB104A | |
| chr8 | 7729174 | 7935902 | 207 | 8 | 39 | DEFB4, DEFB103A, SPAG11, DEFB104A | |
| chr19 | 59862651 | 60076000 | 213 | 26 | 39 | KIR2DL1, KIR2DL3, KIR2DL4, KIR2DS2, KIR2DS4, KIR3DL1, KIR3DL2, KIR3DL3, KIR3DP1, L76664, L76668, LILRB4, U33328, X93596, X99481, AF002256, AF276292, AF283988, AY102623, AY366253, AY601812, BC028206, BC069344, CR609786 | |
| chrX | 48930476 | 49163928 | 233 | 18 | 28 | GAGE1, GAGE2, GAGE4, GAGE5, GAGE6, BC036094, BC081536 | |
Frequency represents the percentage of tumors in which aberrant methylation occurs in at least 75% of all DMRs within the analyzed region.
The PCDH gene family clusters showed a strong hypermethylation signal in the DNA methylation chromosomal plot (Figure 1C). Considering their unique genomic organization and the potential for these clusters to be a novel target for epigenetic silencing in human breast cancer, we analyzed this region in greater detail. This family of PCDH genes (alpha, beta, and gamma) resides in 3 clusters on chromosome 5, and the genes are expressed in normal human breast tissue and down regulated in breast cancer (Figure 4B). The alpha and gamma gene clusters share similar characteristics. The genes within each cluster share the same last three 3′ exons and differ only in their unique 5′ exons. In contrast, each gene in the beta cluster is distinct, ordered along the chromosome, and consists of only one exon (24). Each PCDH gene in these three gene family clusters also has a CpG island promoter.
Figure 4.

Aberrant DNA methylation and transcriptional repression of the PCDH cluster. (A) Map of PCDH cluster taken from UCSC Genome Browser (http://genome.ucsc.edu). Individual tracks, from the top to the bottom, show positions of CpG islands, the regions detected as hypermethylated by microarray, and then the regions analyzed by bisulfite sequencing. Below these tracks are the bisulfite sequencing results showing the methylation status of selected DMRs across the PCDH cluster in breast specimens and cell lines. The methylation data obtained by bisulfite sequencing of the samples analyzed are shown. Sample with a suffix “N” is derived from normal tissue and sample with a suffix “T” is derived from tumor tissue. The cell lines shown are the normal cell strain HMEC and the breast cancer cell lines MDA-MB-231 and BT549. In these diagrams, each row represents an individual cloned and sequenced PCR product, whereas the columns contain the data for each of the CpG sites analyzed (■, methylated sites; □, unmethylated sites; ■, poor sequence data). Clones were sorted from least to most methylated for presentation purposes. Results from the three regions analyzed by bisulfite sequencing for each of the gene clusters, PCDHA, PCDHB and PCDHG are shown. The numbers below each bisulfite sequence plots are the percentage of methylated CpG sites for that sample in the region analyzed. (B) Gene expression of the PCDH cluster in normal and breast tumor specimens. mRNA levels of PCDH genes that were bisulfite sequenced were measured using real time RT-PCR. The expression was analyzed in 15 normal and 23 cancerous specimens. For visualization purposes, expression values were converted to ranks. Wilcoxon rank-sum test was used to test whether expression of PCDH genes is higher in normal than in tumor specimens. Significance of change is indicated by each gene name: ** p value <0.05; * p value <0.1. Box plots display 50% of data points and show median, upper, and lower quartiles
To confirm and extend the PCDH differential methylation results detected on the gene promoter microarrays, the methylation states of nine 5′ CpG island promoters (three each from the PCDHA, PCDHB, and PCDHG clusters) were analyzed by bisulfite sequencing in a selected set of samples. The genomic organization of the CpG island regions analyzed as well as the results of the bisulfite sequencing are shown in Figure 4A. The bisulfite sequencing analysis of normal mammary tissue and the non-tumorigenic, mortal cell strain HMEC revealed surprisingly high and widespread methylation of the PCDH CpG island promoters. The overall levels of methylation between the normal tissue and the HMEC cell strain were comparable and, based on the RT-PCR data, not at a level sufficient to repress transcription. The results further show that DNA hypermethylation of PCDH CpG island promoters occurs in human breast cancer. Importantly, the breast cancer sample 2845T, which shows LRES of the PCDH gene cluster, also contains an LRES event at the HOXA cluster (9). Thus, this tumor is a clear example showing the occurrence of multiple LRES events within a single cancer genome. Overall, the results from this high-resolution analysis confirm that aberrant DNA hypermethylation of multiple PCDH CpG islands is a common event in human breast cancer.
In addition to these agglomerative DNA methylation events, analysis of the microarray results also allowed for the detection of focal events previously determined to be aberrantly methylated in human breast cancer specimens. For example, similar to earlier reports we detected aberrant DNA methylation in the promoters of p16, WT-1, RASSF1A, DSC3, SIM1, PCDH10, and FOXA2 (25–29). Furthermore, it is worthwhile to note that some focal events previously associated with breast tumorigenesis are contained within agglomerative DNA methylation events such as HOXA5, HOXA9, HOXD11, and PCDHGB6 (12, 28, 30). Taken together, these results indicate that the human promoter microarrays are able to detect common focal methylation changes as well as agglomerates of aberrantly methylated DMRs in human breast cancer specimens even using relatively small sample populations.
The prevalence of hypomethylated DMRs in the breast cancer samples detected by differential methylation microarray led us to validate these results. We analyzed 4 hypomethylated DMRs which are part of agglomerative epigenetic aberration located within a segmental duplication on chromosome 8. This region was also chosen because it was recently found to be hypomethylated in lung cancer (31). Quantitative analysis of DNA methylation patterns was determined using the MassArray pipeline of bisulfite PCR, in vitro transcription, base-specific cleavage of the RNA products, and mass spectrometry (32). Results from the analysis of three non-cancer and three cancer samples are presented in Supplemental Figure 2 and confirm the microarray data. Overall, these results show that both agglomerative DNA hypomethylation and hypermethylation events occur in breast cancer and represent a facet of long range epigenetic aberrations linked to human carcinogenesis.
Discussion
Using the Affymetrix Human gene promoter array 1.0R, we took a genome wide approach to profile the DNA methylation state of gene promoter regions in normal and cancerous human breast specimens and cell line models. We extended earlier observations that showed LRES in cancer and now find multiple agglomerative DNA hypermethylation events and, in the case of the PCDH gene family cluster we confirmed that this event led to LRES. We also found agglomerative events characterized by DNA hypomethylation. The regions of hypermethylation and hypomethylation were distinct from one another. DNA hypermethylation events concentrated in CpG islands near transcription start sites, while hypomethylation events were found typically in CpG-poor regions and were not concentrated near transcription start, but rather the hypomethylated DMRs were more evenly spread across the 10kb promoter regions analyzed by the array. Interestingly, the hypomethylation events also were disproportionately found in regions of segmental duplication, and it appears that a region we identified on chromosome 8 as hypomethylated in breast cancer also maps to a region of hypomethylation recently described in lung cancer (31).
A feature common to both the long-range DNA hyper- and hypomethylation events was their frequent occurrence in gene family clusters. The functional significance of the agglomerative DNA hypermethylation events, as opposed to the hypomethylation events, is more evident and is clearly linked to gene repression. One gene family cluster we identified as a new target of aberrant hypermethylation in breast cancer was the protocadherin cluster (PCDHA, PCDHB, PCDHG) on chromosome 5. Further analysis showed that an overall decrease in the expression of the gene family cluster in breast cancer was correlated with the increased methylation of the PCDH cluster’s CpG islands.
One mechanism that may be involved in the aberrant hypermethylation of entire gene family clusters is by disrupting the function of transcription factors and gene regulators that participate in the control of their expression. With respect to the protocadherin cluster, a mechanism involving this possibility exists. Recent studies indicate that binding sites for the insulator protein, CTCF, preferentially concentrate to the PCDH cluster (33, 34). Since CTCF DNA binding activity is reported to be attenuated in breast cancer (35–37) and loss of its DNA binding activity has been linked to the spreading of aberrant DNA methylation into regions once protected by CTCF (38–40), the aberrant DNA methylation of the PCDH gene cluster may be a result of compromised CTCF function. An alternative possibility is that aberrant DNA methylation appears first in the PCDH regions, and the increased levels of DNA methylation in CTCF recognition sites directly block CTCF interaction with the DNA, since CTCF binding is inhibited by DNA methylation and therefore its functional role in regulating gene transcription (33, 34, 41, 42).
In another scenario, aberrant methylation may occur because of an altered chromatin structure that is secondary to changes in the protein composition of the chromatin interactions. We have previously observed DNA methylation-linked LRES in the HOXA gene cluster (9). This situation represents a potential case where changes in DNA-protein interactions may play a role in changes in DNA methylation. The histone methyltransferases EZH2 and MLL1 play important and opposing roles in HOXA gene regulation and their dysregulation has been linked to cancer etiology (43–46). Considering their role in the maintenance of epigenetic control, their disruption may allow for or participate in the appearance of regional aberrant methylation. Another factor that may ultimately participate in the LRES seen in the HOXA cluster in breast cancer is retinoid receptors, since retinoids are important participants in HOXA transcriptional control and important regulators of breast carcinogenesis (47, 48).
Additional mechanisms may participate in the establishment of the agglomerative DNA hypermethylation and likely act in concert with one another to produce stable LRES. It has been proposed that the low level of stochastic DNA methylation found in many CpG islands may serve as seeds or nucleation sites that trigger de novo methylation of the surrounding area leading to a more stable epigenetic silencing event (49). This model would be consistent with the results seen in the PCDH and HOXA gene clusters, since there is a surprisingly high level of DNA methylation in some of their CpG islands in normal tissue and finite lifespan mammary epithelial cells. Indeed, it is further possible that these sequences themselves are more prone to DNA methylation (50).
In summary, recent epigenome-wide scanning approaches have allowed for the identification of new types of epigenetic lesions in the cancer genome (9–12). One of these epigenetic lesions, LRES, is characterized by epigenetic mechanisms that work together to functionally inactivate long contiguous stretches of the genome; however, it appears that the combination of epigenetic landmarks associated with the long range silencing may arise from different epigenetic partnering schemes. For instance, Frigola et al. and Hitchins et al. found aberrant increases in DNA methylation and histone H3 K9 dimethylation that were linked to long range silencing (10, 11), and pharmacologic reactivation studies implicated histone acetylation state, as well. Stransky et al. found long range silencing associated with H3 K9 dimethylation in the absence of aberrant DNA hypermethylation (12). In contrast, in our previous studies (9), as well as the ones reported here, we found long range silencing associated with aberrant increases in DNA methylation and loss of the histone acetylation modifications linked to a permissive or active chromatin state, but we found no consistent increases in the repressive histone modification marks, K9 or K27 methylation (Supplemental Figure 3).
The differences in epigenetic landmarks associated with long-range gene silencing observed between the separate studies could be technical in nature where the ability to detect long-range epigenetic aberrations currently is unrefined and limited in power. It is likely that increases in the sensitivity and precision of epigenomic research tools and analytical schemes will help identify and more precisely define long-range epigenetic aberrations in human disease. Alternatively, these differences may reflect unique tumor-specific mechanisms, since the studies by Frigola et al. and Hitchins et al. analyzed colon tumors, while Starnsky et al. analyzed bladder tumors, and our studies focused on breast cancer. We speculate that different external stimuli (e.g. carcinogens, environmental agents) may disturb different nodes of epigenetic control that then combine to create aberrant epigenetic terrains that are cancer- or disease-specific and not seen in normal, non-diseased cells.
Acknowledgments
Grants R01CA65662 and R33CA091351 to B.W.F. Center Grants P30ES06694 and P30CA023074, and the BIO5 interdisciplinary biotechnology center at the UA supported the Genomics Shared Service. Training grants ES007091 and CA09213 helped support T.J. We thank Jose Munoz-Rodrigues for outstanding technical support.
Abbreviations
- LRES
long range epigenetic silencing
- DMR
differentially methylated region
- MeDIP
methylated DNA immunoprecipitation
References
- 1.Jones PA, Baylin SB. The epigenomics of cancer. Cell. 2007;128:683–92. doi: 10.1016/j.cell.2007.01.029. [DOI] [PMC free article] [PubMed] [Google Scholar]
- 2.Narayan A, Ji W, Zhang XY, et al. Hypomethylation of pericentromeric DNA in breast adenocarcinomas. Int J Cancer. 1998;77:833–8. doi: 10.1002/(sici)1097-0215(19980911)77:6<833::aid-ijc6>3.0.co;2-v. [DOI] [PubMed] [Google Scholar]
- 3.Feinberg AP, Vogelstein B. Hypomethylation distinguishes genes of some human cancers from their normal counterparts. Nature. 1983;301:89–92. doi: 10.1038/301089a0. [DOI] [PubMed] [Google Scholar]
- 4.Jackson K, Yu MC, Arakawa K, et al. DNA hypomethylation is prevalent even in low-grade breast cancers. Cancer Biol Ther. 2004;3:1225–31. doi: 10.4161/cbt.3.12.1222. [DOI] [PubMed] [Google Scholar]
- 5.Vertino PM, Spillare EA, Harris CC, Baylin SB. Altered Chromosomal Methylation Patterns Accompany Oncogene-induced Transformation of Human Bronchial Epithelial Cells. Cancer Res. 1993;53:1684–9. [PubMed] [Google Scholar]
- 6.Baylin SB. Abnormal regional hypermethylation in cancer cells. AIDS Res Hum Retroviruses. 1992;8:811–20. [PubMed] [Google Scholar]
- 7.Greger V, Passarge E, Hopping W, Messmer E, Horsthemke B. Epigenetic changes may contribute to the formation and spontaneous regression of retinoblastoma. Hum Genet. 1989;83:155–8. doi: 10.1007/BF00286709. [DOI] [PubMed] [Google Scholar]
- 8.Costello JF, Fruhwald MC, Smiraglia DJ, et al. Aberrant CpG-island methylation has non-random and tumour-type-specific patterns. Nat Genet. 2000;24:132–8. doi: 10.1038/72785. [DOI] [PubMed] [Google Scholar]
- 9.Novak P, Jensen T, Oshiro MM, et al. Epigenetic inactivation of the HOXA gene cluster in breast cancer. Cancer Res. 2006;66:10664–70. doi: 10.1158/0008-5472.CAN-06-2761. [DOI] [PubMed] [Google Scholar]
- 10.Frigola J, Song J, Stirzaker C, Hinshelwood RA, Peinado MA, Clark SJ. Epigenetic remodeling in colorectal cancer results in coordinate gene suppression across an entire chromosome band. Nat Genet. 2006;38:540–9. doi: 10.1038/ng1781. [DOI] [PubMed] [Google Scholar]
- 11.Hitchins MP, Lin VA, Buckle A, et al. Epigenetic inactivation of a cluster of genes flanking MLH1 in microsatellite-unstable colorectal cancer. Cancer Res. 2007;67:9107–16. doi: 10.1158/0008-5472.CAN-07-0869. [DOI] [PubMed] [Google Scholar]
- 12.Stransky N, Vallot C, Reyal F, et al. Regional copy number-independent deregulation of transcription in cancer. Nat Genet. 2006;38:1386–96. doi: 10.1038/ng1923. [DOI] [PubMed] [Google Scholar]
- 13.Clark SJ, Harrison J, Paul CL, Frommer M. High sensitivity mapping of methylated cytosines. Nucleic Acids Res. 1994;22:2990–7. doi: 10.1093/nar/22.15.2990. [DOI] [PMC free article] [PubMed] [Google Scholar]
- 14.Coolen MW, Statham AL, Gardiner-Garden M, Clark SJ. Genomic profiling of CpG methylation and allelic specificity using quantitative high-throughput mass spectrometry: critical evaluation and improvements. Nucleic Acids Res. 2007;35:e119. doi: 10.1093/nar/gkm662. [DOI] [PMC free article] [PubMed] [Google Scholar]
- 15.Weber M, Davies JJ, Wittig D, et al. Chromosome-wide and promoter-specific analyses identify sites of differential DNA methylation in normal and transformed human cells. Nat Genet. 2005;37:853–62. doi: 10.1038/ng1598. [DOI] [PubMed] [Google Scholar]
- 16.Gentleman RC, Carey VJ, Bates DM, et al. Bioconductor: open software development for computational biology and bioinformatics. Genome Biol. 2004;5:R80. doi: 10.1186/gb-2004-5-10-r80. [DOI] [PMC free article] [PubMed] [Google Scholar]
- 17.Chen Z, McGee M, Liu Q, Scheuermann RH. A distribution free summarization method for Affymetrix GeneChip(R) arrays. Bioinformatics. 2007;23:321–7. doi: 10.1093/bioinformatics/btl609. [DOI] [PubMed] [Google Scholar]
- 18.Kent WJ. BLAT--the BLAST-like alignment tool. Genome Res. 2002;12:656–64. doi: 10.1101/gr.229202. [DOI] [PMC free article] [PubMed] [Google Scholar]
- 19.Jensen TJ, Novak P, Eblin KE, Gandolfi AJ, Futscher BW. Epigenetic Remodeling During Arsenical-Induced Malignant Transformation. Carcinogenesis. 2008 doi: 10.1093/carcin/bgn102. [DOI] [PMC free article] [PubMed] [Google Scholar]
- 20.Nouzova M, Holtan N, Oshiro MM, et al. Epigenomic changes during leukemia cell differentiation: analysis of histone acetylation and cytosine methylation using CpG island microarrays. J Pharmacol Exp Ther. 2004;311:968–81. doi: 10.1124/jpet.104.072488. [DOI] [PubMed] [Google Scholar]
- 21.Li J, Yang Y, Fujie T, et al. Expression of BAGE, GAGE, and MAGE genes in human gastric carcinoma. Clin Cancer Res. 1996;2:1619–25. [PubMed] [Google Scholar]
- 22.De Backer O, Arden KC, Boretti M, et al. Characterization of the GAGE Genes That Are Expressed in Various Human Cancers and in Normal Testis. Cancer Res. 1999;59:3157–65. [PubMed] [Google Scholar]
- 23.Coles C, Condie A, Chetty U, Steel CM, Evans HJ, Prosser J. p53 mutations in breast cancer. Cancer Res. 1992;52:5291–8. [PubMed] [Google Scholar]
- 24.Wu Q, Maniatis T. A striking organization of a large family of human neural cadherin-like cell adhesion genes. Cell. 1999;97:779–90. doi: 10.1016/s0092-8674(00)80789-8. [DOI] [PubMed] [Google Scholar]
- 25.Dammann R, Yang G, Pfeifer GP. Hypermethylation of the CpG Island of Ras Association Domain Family 1A (RASSF1A), a Putative Tumor Suppressor Gene from the 3p21.3 Locus, Occurs in a Large Percentage of Human Breast Cancers. Cancer Res. 2001;61:3105–9. [PubMed] [Google Scholar]
- 26.Herman JG, Merlo A, Mao L, et al. Inactivation of the CDKN2/p16/MTS1 Gene Is Frequently Associated with Aberrant DNA Methylation in All Common Human Cancers. Cancer Res. 1995;55:4525–30. [PubMed] [Google Scholar]
- 27.Huang TH-M, Laux DE, Hamlin BC, Tran P, Tran H, Lubahn DB. Identification of DNA Methylation Markers for Human Breast Carcinomas Using the Methylation-sensitive Restriction Fingerprinting Technique. Cancer Res. 1997;57:1030–4. [PubMed] [Google Scholar]
- 28.Miyamoto K, Fukutomi T, Akashi-Tanaka S, et al. Identification of 20 genes aberrantly methylated in human breast cancers. Int J Cancer. 2005;116:407–14. doi: 10.1002/ijc.21054. [DOI] [PubMed] [Google Scholar]
- 29.Oshiro MM, Kim CJ, Wozniak RJ, et al. Epigenetic silencing of DSC3 is a common event in human breast cancer. Breast Cancer Res. 2005;7:R669–80. doi: 10.1186/bcr1273. [DOI] [PMC free article] [PubMed] [Google Scholar]
- 30.Raman V, Martensen SA, Reisman D, et al. Compromised HOXA5 function can limit p53 expression in human breast tumours. Nature. 2000;405:974–8. doi: 10.1038/35016125. [DOI] [PubMed] [Google Scholar]
- 31.Rauch TA, Zhong X, Wu X, et al. High-resolution mapping of DNA hypermethylation and hypomethylation in lung cancer. Proc Natl Acad Sci U S A. 2008;105:252–7. doi: 10.1073/pnas.0710735105. [DOI] [PMC free article] [PubMed] [Google Scholar]
- 32.Ehrich M, Nelson MR, Stanssens P, et al. Quantitative high-throughput analysis of DNA methylation patterns by base-specific cleavage and mass spectrometry. Proc Natl Acad Sci U S A. 2005;102:15785–90. doi: 10.1073/pnas.0507816102. [DOI] [PMC free article] [PubMed] [Google Scholar]
- 33.Xie X, Mikkelsen TS, Gnirke A, Lindblad-Toh K, Kellis M, Lander ES. Systematic discovery of regulatory motifs in conserved regions of the human genome, including thousands of CTCF insulator sites. Proc Natl Acad Sci U S A. 2007;104:7145–50. doi: 10.1073/pnas.0701811104. [DOI] [PMC free article] [PubMed] [Google Scholar]
- 34.Kim TH, Abdullaev ZK, Smith AD, et al. Analysis of the vertebrate insulator protein CTCF-binding sites in the human genome. Cell. 2007;128:1231–45. doi: 10.1016/j.cell.2006.12.048. [DOI] [PMC free article] [PubMed] [Google Scholar]
- 35.Filippova GN, Lindblom A, Meincke LJ, et al. A widely expressed transcription factor with multiple DNA sequence specificity, CTCF, is localized at chromosome segment 16q22.1 within one of the smallest regions of overlap for common deletions in breast and prostate cancers. Genes Chromosomes Cancer. 1998;22:26–36. [PubMed] [Google Scholar]
- 36.Filippova GN, Qi CF, Ulmer JE, et al. Tumor-associated zinc finger mutations in the CTCF transcription factor selectively alter tts DNA-binding specificity. Cancer Res. 2002;62:48–52. [PubMed] [Google Scholar]
- 37.Butcher DT, Rodenhiser DI. Epigenetic inactivation of BRCA1 is associated with aberrant expression of CTCF and DNA methyltransferase (DNMT3B) in some sporadic breast tumours. Eur J Cancer. 2007;43:210–9. doi: 10.1016/j.ejca.2006.09.002. [DOI] [PubMed] [Google Scholar]
- 38.Filippova GN, Cheng MK, Moore JM, et al. Boundaries between chromosomal domains of X inactivation and escape bind CTCF and lack CpG methylation during early development. Dev Cell. 2005;8:31–42. doi: 10.1016/j.devcel.2004.10.018. [DOI] [PubMed] [Google Scholar]
- 39.Butcher DT, Mancini-DiNardo DN, Archer TK, Rodenhiser DI. DNA binding sites for putative methylation boundaries in the unmethylated region of the BRCA1 promoter. Int J Cancer. 2004;111:669–78. doi: 10.1002/ijc.20324. [DOI] [PubMed] [Google Scholar]
- 40.De La Rosa-Velazquez IA, Rincon-Arano H, Benitez-Bribiesca L, Recillas-Targa F. Epigenetic Regulation of the Human Retinoblastoma Tumor Suppressor Gene Promoter by CTCF. Cancer Res. 2007;67:2577–85. doi: 10.1158/0008-5472.CAN-06-2024. [DOI] [PubMed] [Google Scholar]
- 41.Hark AT, Schoenherr CJ, Katz DJ, Ingram RS, Levorse JM, Tilghman SM. CTCF mediates methylation-sensitive enhancer-blocking activity at the H19/Igf2 locus. Nature. 2000;405:486–9. doi: 10.1038/35013106. [DOI] [PubMed] [Google Scholar]
- 42.Bell AC, Felsenfeld G. Methylation of a CTCF-dependent boundary controls imprinted expression of the Igf2 gene. Nature. 2000;405:482–5. doi: 10.1038/35013100. [DOI] [PubMed] [Google Scholar]
- 43.Whitman SP, Liu S, Vukosavljevic T, et al. The MLL partial tandem duplication: evidence for recessive gain-of-function in acute myeloid leukemia identifies a novel patient subgroup for molecular-targeted therapy. Blood. 2005;106:345–52. doi: 10.1182/blood-2005-01-0204. [DOI] [PMC free article] [PubMed] [Google Scholar]
- 44.Guenther MG, Jenner RG, Chevalier B, et al. Global and Hox-specific roles for the MLL1 methyltransferase. Proc Natl Acad Sci U S A. 2005;102:8603–8. doi: 10.1073/pnas.0503072102. [DOI] [PMC free article] [PubMed] [Google Scholar]
- 45.Yu BD, Hess JL, Horning SE, Brown GAJ, Korsmeyer SJ. Altered Hox expression and segmental identity in Mll-mutant mice. Nature. 1995;378:505–8. doi: 10.1038/378505a0. [DOI] [PubMed] [Google Scholar]
- 46.Kleer CG, Cao Q, Varambally S, et al. EZH2 is a marker of aggressive breast cancer and promotes neoplastic transformation of breast epithelial cells. Proc Natl Acad Sci U S A. 2003;100:11606–11. doi: 10.1073/pnas.1933744100. [DOI] [PMC free article] [PubMed] [Google Scholar]
- 47.Decensi A, Serrano D, Bonanni B, Cazzaniga M, Guerrieri-Gonzaga A. Breast Cancer Prevention Trials Using Retinoids. J Mammary Gland Biol Neoplasia. 2003;8:19–30. doi: 10.1023/a:1025779120649. [DOI] [PubMed] [Google Scholar]
- 48.Langston AW, Gudas LJ. Retinoic acid and homeobox gene regulation. Curr Opin Genet Dev. 1994;4:550–5. doi: 10.1016/0959-437x(94)90071-a. [DOI] [PubMed] [Google Scholar]
- 49.Song JZ, Stirzaker C, Harrison J, Melki JR, Clark SJ. Hypermethylation trigger of the glutathione-S-transferase gene (GSTP1) in prostate cancer cells. Oncogene. 2002;21:1048–61. doi: 10.1038/sj.onc.1205153. [DOI] [PubMed] [Google Scholar]
- 50.Feltus FA, Lee EK, Costello JF, Plass C, Vertino PM. DNA motifs associated with aberrant CpG island methylation. Genomics. 2006;87:572–9. doi: 10.1016/j.ygeno.2005.12.016. [DOI] [PubMed] [Google Scholar]