

Abstract
Population-based surveillance of disease has become an important component of addressing common chronic diseases such as hypertension and diabetes. Such systems guide screening, prevention and treatment resources. Development of a chronic kidney disease (CKD) surveillance system for the United States that focuses on early stages of CKD is an important activity that could help stem the rising number of end-stage renal disease cases and CKD-related morbidity and mortality in the United States. It could also help in the evaluation of interventional programs that are currently being developed or are already in place. Such a surveillance system should address the burden of CKD, awareness of CKD, CKD risk factors, CKD consequences, process and quality of care in CKD and health system capacity for CKD; it should also allow for estimations of the burden of CKD by age, sex, race/ethnicity, socioeconomic strata, geographic groups and clinical subgroups. We describe the key components of a surveillance system for CKD, steps in development of such a system and challenges that will need to be addressed. Information necessary for surveillance of CKD is evolving. At this juncture, collecting, integrating, analyzing, and interpreting information on CKD for surveillance using a systematic, comprehensive and feasible approach will be instrumental in prevention and health promotion efforts for this chronic disease.
Chronic kidney disease (CKD), defined as kidney damage with persistent, gradual, and progressive deterioration of kidney function (loss of the ability to excrete wastes, concentrate urine, and conserve electrolytes), is a growing public health problem in the United States. Detected most commonly through laboratory measurements on blood (e.g., creatinine) and urine (e.g., albumin), prevalence of its most severe stage, end-stage renal disease (ESRD), has doubled over the last decade, with approximately 500,000 U.S. patients being treated for ESRD in 2005 (1). Almost a decade ago, CKD was declared a focus area of the Healthy People 2010 objectives (2). Despite the attention given to this chronic disease epidemic, there is no established comprehensive monitoring and surveillance system for the entire spectrum of CKD in the United States. Concerted efforts by the National Institutes of Diabetes and Digestive and Kidney Disease (NIDDK) and the Center for Medicare and Medicaid Services (CMS) in the establishment of the United States Renal Data System (USRDS) and the ESRD networks have historically focused on the most severe stage of CKD, stage 5 CKD or ESRD, an illness with many complications, high mortality, poor quality of life, and large healthcare costs. However, if we are to prevent ESRD and its related morbidity and mortality in the United States, efforts must be made to track the distribution of all stages of CKD, its risk factors and consequences and to identify opportunities to intervene on the illness at earlier stages, particularly among high-risk groups. A surveillance system is one of the first steps in this process. We discuss the principles, steps and challenges involved in our development of a Centers for Disease Control and Prevention (CDC)-sponsored, comprehensive surveillance system for CKD in the United States.
What is a Surveillance System?
A surveillance system comprehensively captures and tracks all important manifestations of a disease, providing key information on disease activity including persons affected, timing, magnitude, severity and location in order to guide implementation of medical and public health measures to control or contain the disease. For a chronic disease such as CKD, this means, in addition to enumeration of cases, information on progression of the disease and its complications. It is important to distinguish surveillance from screening, as the two concepts are often confused. Screening refers to identification of unrecognized cases of a disease. Screening may be a component of surveillance, but surveillance involves enumerating and tracking recognized cases of disease, in addition to detection of unrecognized cases of disease.
Desirable Attributes of a Surveillance System
The CDC (3) have proposed seven desirable attributes for a surveillance system (Box 1). To be effective and sustainable over time, a surveillance system for CKD should involve relatively straightforward data collection and operations for reporting such data on a periodic basis. It must be flexible to examine new dimensions identified from more intensive research and accommodate changes in definitions of disease. For example, new markers of kidney damage (e.g., neutrophil gelatinase-associated lipocalin, dimethylarginine, and liver-type fatty acid-binding protein) (4) and kidney function (e.g., cystatin C) have been identified. If such novel markers were to supersede current markers (albuminuria and creatinine) through further rigorous testing and become commercially available, a surveillance system should be able to adapt to incorporate their data collection and reporting. The data incorporated into a CKD surveillance system should be of high quality and be reliable and valid. The measures should have construct validity, predictive validity, and discriminant validity, as well as face validity. Sources of data should find the system acceptable and thus be willing to participate and share their data freely. The system must be sensitive to capture events over time and space, and a high percentage of true cases must be identified as possibly having a disease. The system must give representative picture of CKD in the United States as a whole and in communities. The system must also be able to report the status of chronic kidney disease in a timely fashion so that interventions can be effective. Finally, some of the most important measures such as burden of kidney disease will be most useful if data are assembled over time so that trends in illness can be examined. Therefore, the sources that provide information for a CKD surveillance system must be stable enough to ensure data will be available in the future. It is important to note that that these attributes can sometimes be in conflict with each other; for example, collection of data in a cohort study that would maximize predictive value of kidney damage through repeated measures of albuminuria to establish persistence may be less representative than data from a geographically broader, national cross-sectional survey.
Box 1
Attributes of an ideal surveillance system. Adapted with permission from (1). The data reported here have been supplied by the United States Renal Data System (USRDS). The interpretation and reporting of these data are the responsibility of the authors and in no way should be seen as an official policy or interpretation of the U.S. government.
Simplicity of the system structure and operation
Flexibility to look at new questions posed by research and accommodate changes in technology or reporting definitions
Data quality for complete and valid data
Acceptability to generate enthusiasm and willingness to participate in the system
Sensitivity for capturing all events and monitoring trends
Predictive value positive of capturing true cases
Representativeness of the information for individuals in the United States
Timeliness of process from collecting information to delivering it to make health care changes
Stability to reliably operate and provide information when called upon
Core Steps in a Surveillance System
Design of a comprehensive surveillance system for CKD includes several core steps that carefully weigh the desirable attributes of a surveillance system (Figure 1) (5). The first step includes the selection of important topics and measures within each topic area. The second includes establishment of indicators for each measure, along with selection of possible data sources. Third, data are collected or assembled from sources and integrated if obtained from more than one data source. Fourth, data are analyzed to address each indicator of interest. Fifth, results are interpreted and assembled for presentation. Finally, the products of the surveillance system are disseminated.
Figure 1.
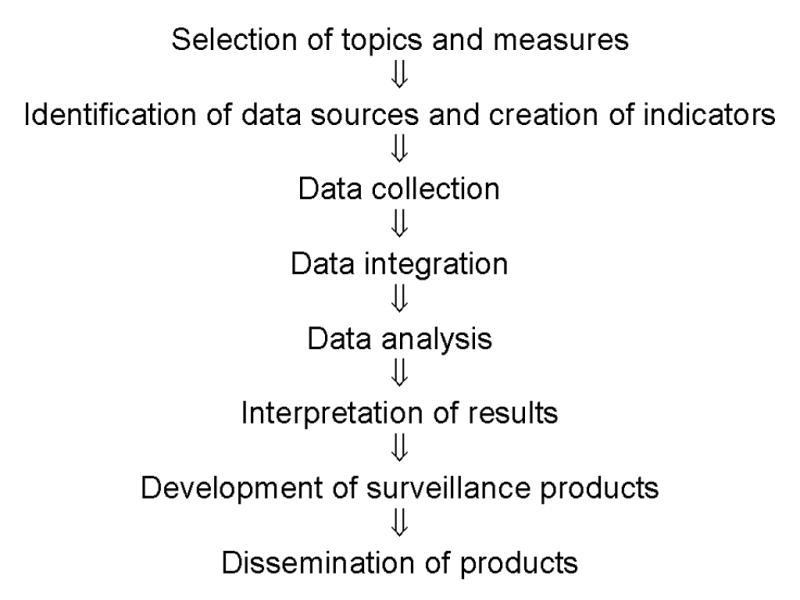
Core steps in the design of a surveillance system
Ideally, the process of selecting topics and measures to be included in a surveillance system should include input from not only experts but also possible users of the system. For CKD this might include representatives from federal government agencies impacted by kidney disease [(e.g., CDC, NIDDK, CMS, Agency for Healthcare Research and Quality (AHRQ), and Health Resources and Services Administration (HRSA)]. Involvement of professional societies [e.g., American Society of Nephrology (ASN), National Kidney Foundation (NKF), Renal Physicians Association (RPA), American Nephrology Nurses’ Association (ANNA), American College of Physicians (ACP), and American Academy of Family Physicians (AAFP)] and patient advocacy groups [e.g., American Association of Kidney Patients (AAKP) and American Diabetes Association (ADA)] provides input by those who can take local action on findings, to increase awareness and implement change. Also, input from local and regional health officials can be useful in galvanizing communities where disease burden and problems are most prevalent.
A Possible Classification of Topics for a CKD Surveillance System
A possible classification of topics for a surveillance system for CKD would include burden of CKD (incidence and prevalence), awareness of CKD, risk factors for CKD, health consequences of CKD, processes and quality of care in CKD, and health care system capacity for CKD. The burden of disease should be described according to stages of CKD (described in previous articles) and within different demographic (e.g., age, sex, race, and ethnicity) and clinical (e.g., diabetes and hypertension) groups, across different geographic areas (e.g., states) and across time. Stage 5 CKD or ESRD, which has been tracked since the late 1980s by its own surveillance system, the USRDS, provides an important reference point to gauge progress in prevention of kidney damage and progression of disease. For each of these potential topics, several measures may be relevant (Table 1), each of which may have indicators that need to be carefully delineated (Table 2).
Table 1.
Examples of measures within broad categories for CKD surveillance
| Category | Example Measures |
|---|---|
| Burden of CKD (CKD Incidence and Prevalence) | Prevalence of stages 1–5 CKD by eGFR (kidney function) |
| Incidence of stages 1–5 CKD by eGFR (kidney function) | |
|
| |
| Awareness of CKD | Awareness of risk among diabetics |
| Awareness of risk among hypertensives | |
| Awareness of risk among those with family history of CKD/ESRD | |
| Knowledge of CKD risk factors | |
|
| |
| Burden(Incidence/Prevalence) of Risk Factors for CKD Among Those at Risk | Prevalence of diabetes mellitus |
| Prevalence of hypertension | |
| Prevalence of controlled blood pressure | |
|
| |
| Health Consequences in CKD Patients | Proportion of CKD patients moving to ESRD over time |
| Mortality rates | |
| Progression of CKD by demographic characteristics (e.g., race/ethnicity) | |
| Progression of decreased renal function by level of proteinuria | |
|
| |
| CKD Processes and Quality of Care | Detection of CKD in those with risk factors |
| Appropriate use of ACE inhibitors/ARBs (e.g., for diabetics with proteinuria and for hypertensives) | |
| Referral to a nephrologist by PCP prior to ESRD | |
|
| |
| Health System Capacity for CKD | Reporting of eGFR by laboratories |
| Adequacy of insurance coverage | |
| Use of standardized creatinine | |
Abbreviations: CKD, chronic kidney disease; eGFR, estimated glomerular filtration rate; ACE, angiotensin-converting enzyme; ARB, angiotensin receptor blocker; ESRD, end-stage renal disease; PCP, primary care physician.
Table 2.
Sample CKD indicator template
| Field | Description |
|---|---|
| Indicator Name | Prevalence of Stage 3 CKD |
| Demographic group | Residents age ≥ 18 years |
| Numerator | Residents age ≥ 18 years who have eGFR of 30–60 mL/min/1.73m2 |
| Denominator | All residents age ≥ 18 years |
| Measures of frequency | Annual prevalence (as percentage and as estimates of number affected) |
| Period for case definition | 1980–2005 |
| Data resources | NHANES for calculation of percentage affected that could then be applied to Census Bureau population estimates for total disease burden |
| Background | Estimates from NHANES 1999–2000 show that the prevalence of Stage 3 CKD 3.7% which translated to approximately 7.4 million US adults from 2000 Census data (6) |
| Significance | Indication of future burden as this group progresses to ESRD or CVD |
| Limitations of indicator | Requires laboratory testing of serum creatinine and estimation of eGFR by standardized methods |
| Limitations of data resources | Not calculated from original serum creatinine measurements or will be difficult to extract from huge database |
| Addresses Healthy People 2010 objectives | 2010 targets relevant include reducing the ESRD incident rate to 217 per million since prevalent stage 3 CKD have high risk of progressing to ESRD |
| Additional data items | Individual level data of age, sex, race/ethnicity, geography, for adjustment of risk factors and data stratification |
Abbreviations: CKD, chronic kidney disease; CVD, cardiovascular disease; eGFR, estimated glomerular filtration rate; ESRD, end-stage renal disease; NHANES, National Health and Nutrition Examination Survey.
Potential Sources of Data for National and Local Surveillance
Many types of data sources could provide relevant data for a CKD surveillance system. These include population-based survey data, public and private health care system data, screening activity data, professional societies, private industry, cohort studies and registries. We describe some of these possibilities below. Table 3 shows a brief summary of specific data collection activities or databases for each of these types of data sources.
Table 3.
Types of data available from potential CKD surveillance data sources
| Type of Data | ||||||
|---|---|---|---|---|---|---|
| Data Source | Questionnaire | Exam | Laboratory | Medical Record | Claims | Mortality |
| Population- based Surveys | ||||||
| NHANES | ✓ | ✓ | ✓ | ✓ | ||
| BRFSS | ✓ | |||||
| Public Health Systems | ||||||
| CMS | ✓ | ✓ | ✓ | ✓ | ✓ | ✓ |
| VA | ✓ | ✓ | ✓ | ✓ | ✓ | |
| HIS | ✓ | ✓ | ✓ | ✓ | ✓ | |
| Private Health Systems | ||||||
| BCBS | ✓ | ✓ | ✓ | ✓ | ✓ | |
| Regional | ✓ | ✓ | ✓ | ✓ | ✓ | |
| Screening Activities | ||||||
| KEEP | ✓ | ✓ | ✓ | |||
| NKDEP | ✓ | |||||
| Professional Societies | ||||||
| AMA | ✓ | |||||
| ASN/ANNA | ✓ | |||||
| Private Industry | ||||||
| LabCorp | ✓ | ✓ | ||||
| Quest | ✓ | ✓ | ||||
| Medstat | ✓ | ✓ | ✓ | ✓ | ✓ | |
| Cohort Studies? | ||||||
| ARIC | ✓ | ✓ | ✓ | ✓ | ✓ | ✓ |
| CRIC/CKID | ✓ | ✓ | ✓ | ✓ | ✓ | |
| Registries? | ||||||
| USRDS | ✓ | ✓ | ✓ | ✓ | ||
| SRTR | ✓ | ✓ | ✓ | ✓ | ||
NHANES, National Health and Nutrition Examination Survey; BRFSS, Behavioral Risk Factor Surveillance System; CMS, Centers for Medicare & Medicaid Services; VA, Veterans Affairs; IHS, Indian Health Service; KEEP, Kidney Early Evaluation Program; NKDEP, National Kidney Disease Education Program; AMA, American Medical Association; ASN, American Society of Nephrology; ANNA, American Nephrology Nursing Association; ARIC, Atherosclerosis Risk in Communities; CRIC, Chronic Renal Insufficiency Cohort; CKID, Chronic Kidney Disease in Children; USRDS, United States Renal Data System; SRTR, Scientific Registry of Transplant Recipients.
Population-based Survey Data
National surveys such as the National Health and Nutrition Examination Survey (NHANES) and Behavioral Risk Factor Surveillance System (BRFSS) provide nationally representative data on the overall health of U.S. citizens. NHANES is a long-running national source of objectively measured health and nutrition data. The NHANES survey, now conducted every 2 years, includes physical examinations, clinical and laboratory tests and personal interviews to provide a cross-sectional summary of the health and nutritional status of the non-institutionalized, civilian U.S. population. NHANES provides data to determine rates of major diseases and health conditions as well as identify and monitor trends in medical conditions, risk factors, and emerging public health issues. BRFSS is a CDC-sponsored, state-based annual telephone survey of behavioral risk factors whose primary purpose is to provide state-specific estimates of behavioral factors that contribute to the leading causes of death in the United States. Data from the BRFSS provide information on trends in risk behaviors, health disparities, and effectiveness of prevention and education programs.
Public Health System Data
Public health programs in the United States might also provide useful data. The CMS serves both the elderly and disabled (Medicare) and the poor (Medicaid) populations and capture all claims from both sources. Data from CMS could come from many sources, including: Medicare Enrollment Database (EDB), National Medicare Utilization Database (NMUD), the Medicaid Utilization Database (MSIS), nursing home and health assessment data (OASIS, MDS), and the Medicare Current Beneficiary Survey (MCBS). The Department of Veterans Affairs (VA), through the Veterans Health Administration (VHA), operates the largest integrated health care system in the United States for all U.S. military veterans. The VHA has a long history of computerized clinical information systems. At present, all episodes of care provided under VA auspices in VA hospitals, nursing homes, domiciles, and outpatient clinics are reported by facility staff using nationally distributed software. The Indian Health Service (IHS), an agency within the Department of Health and Human Services, is responsible for providing federal health services to American Indians and Alaska Natives. The IHS is the principal federal health care provider and health advocate for the Native American population. The IHS currently provides health services to approximately 1.5 million American Indians and Alaska Natives who belong to more than 557 federally recognized tribes in 35 states.
Private Health System Data
Private health insurance plans such as Blue Cross Blue Shield (BCBS) could provide data on a national level (in aggregate) on diagnoses, treatments, costs, and trends in their patient populations. Additional, regional health care plans could provide in-depth information about trends in particular U.S. states or regions.
Screening Activity Data
Several organizations maintain screening and/or educational programs that may provide useful data for CKD Surveillance. The NKF sponsors a free kidney health screening program, the Kidney Early Evaluation Program (KEEP), designed to raise awareness about kidney disease among high-risk individuals and provide free testing and educational information, so that kidney disease and its complications can be prevented or delayed. The National Kidney Disease Education Program (NKDEP) has performed surveys on awareness of CKD risk factors among African-Americans and on eGFR reporting by laboratories.
Professional Societies
Professional societies, such as the American Medical Association (AMA), American Society of Nephrology (ASN) and American Nephrology Nurses’ Association (ANNA) might also provide data on issues of health care capacity, including numbers of nephrologists and nephrology nurses, in addition to nephrology trainees.
Private Industry Data
Private industry may also provide data that is useful to CKD surveillance. For example, national medical laboratories such as Quest and LabCorp might have information on tests ordered and possibly results of tests. Private data warehouses such as Medstat provide a family of databases to researchers, containing individual-level healthcare claims, lab test results, and hospital discharge information from large employers, managed care organizations, hospitals, and Medicare and Medicaid programs.
Cohort Study Data
Cohort studies, while usually not as representative as other sources, might provide valuable information on incidence and progression of disease that may be hard to capture elsewhere. For example, the Atherosclerosis Risk in Communities (ARIC) Study (7) is a longitudinal study of 15,792 ages 45–64 recruited from four U.S. suburban communities with the primary purpose of investigating the etiology and natural history of atherosclerosis, including the determination of risk factors. Baseline and follow-up visits (which occurred every 3 years) included measurements of demographics, lifestyle, physiologic characteristics, as well as laboratory measurements. Studies such as ARIC could be used to study incidence of CKD. Cohorts of participants enrolled with kidney disease, would be most useful for studying progression of disease. The Chronic Renal Insufficiency Cohort Study (CRIC) (8) and Chronic Kidney Disease in Children (CKiD) (9) are both prospective cohort studies funded by the NIDDK of the National Institutes of Health (NIH). CRIC comprises nearly 4000 adult patients, aged 21 to 74 years, recruited from 7 centers in the United States, including Philadephia, PA, Baltimore, MD, Cleveland, OH, Chicago, IL, Ann Arbor, MI, New Orleans, LA, and Oakland, CA. CRIC includes measures of kidney function over time and risk factors for CKD and cardiovascular disease to examine the relationship between moderate stages of CKD and CVD as a first step in prevent and better treat CKD and CVD. Selected participants also have undergone extensive measurement of kidney function with radio-labeled iothalamate. CKiD is recruiting from approximately 50 centers, approximately 500 children, aged 1 to 16 years who have estimated GFR between 30–75 mL/min/1.73m2. CKiD also includes measures of kidney function over time and risk factors for CKD progression to examine the impact of progression on growth, cognition, behavior and development of risk factors for cardiovascular disease. These studies provide detailed and carefully collected data on CKD progression from moderate CKD stages to ESRD.
Registry Data
National registries of end-stage renal disease care (USRDS) and transplant recipients [Scientific Registry of Transplant Recipients (SRTR)] provide valuable data. The USRDS is an NIDDK- and CMS-sponsored national database, predominantly for end-stage renal disease. It provides national statistics on ESRD incidence and prevalence, treatment modalities, achievement of clinical indicators, and clinical outcomes. The SRTR supports the ongoing evaluation of the scientific and clinical status of all solid organ transplantation in the United States, including kidney transplants. Thus, it provides a means of following patients who are at high risk for CKD outcomes.
Challenges in Establishing a CKD Surveillance System
The processes of identifying and selecting topics and measures, identifying and selecting relevant data sources, and integrating the information into a usable surveillance system for CKD in the United States are fraught with challenges.. These challenges include both conceptual and methodologic issues.
Sampling
The USRDS, the current surveillance system for ESRD, benefits from the relatively easy identification of persons treated for stage 5 CKD through Medicare program administrative files. Thus, it can enumerate nearly all cases of ESRD in the U.S. and passively follow them for outcomes such as hospitalization and death using Medicare program files. For early stages of CKD, total identification of all cases is not possible. Thus, the use of NHANES data, which utilizes probability sampling, has been the accepted approach to estimating the total burden of CKD in the United States (6, 10). Incorporating the sampling strategy for areas of the country is therefore critical for appropriate analysis of NHANES data. And because NHANES has strict confidentiality concerns, data are not available on smaller geographic units that might allow for local efforts to address CKD.
Establishing a Population Denominator
For some data we may be able to determine the number of cases affected, but the larger population from which they come (the denominator) may not be clearly defined. For example, clinical laboratories may be able to identify individuals with CKD through creatinine measurements. However, these individuals represent only those tested, and the reasons for testing are likely to be unknown in most cases. Similarly, health care system data are likely to identify those tested for CKD through proteinuria and creatinine measurements, but CKD among individuals not tested would not be identified. One could use the number of enrollees in the health care system as a denominator but there would be misclassification of some persons as normal who truly have kidney disease.
Geographic Detail for State and Local Planning
Arguably, data to compare communities with regard to CKD burden and prevention would be most useful. Many surveillance systems have benefited from data at state, county, zip code or census tract levels. For CKD risk factors it may be possible to obtain such information, but prevalence and incidence data on CKD at the local level are hard to come by. Local efforts such as the New York HANES could incorporate measures for CKD in data collection to address kidney disease in addition to other conditions.
Standardization of Measures
Some of the measures to calculate as part of a surveillance system are incidence and prevalence rates, mortality rates, and hospital admission rates. The standardization of these types of measures in a surveillance system is crucial (11), and the standardization must be done to a single population at a single time point. This is to ensure that the denominator provides an accurate representation of CKD at all its stages by geographic area, age, race, and other patient characteristics (and, eventually, over time). Many data sources provide measures that have already been standardized to their own population (e.g., the reference may be state- or region-level, or historical).
Variable Definitions of Measures
Variables such as diabetes could be defined multiple ways, such as a self-reported diagnosis, a fasting glucose of over 126 g/dL, or from information such as use of diabetes medication. Varying definitions such as these could give different rates. In addition, measurement of GFR, may be calculated based on several measurements or different formulae and thus lead to differences in classification and staging of CKD patients
Variability in Data Quality
Another issue is variability in the quality of the data, as different data sources may have different thresholds of quality—i.e., some sources may release all data they have collected, whereas other sources might release only data that have missing values below a certain proportion or that are in sufficient numbers in demographic or geographic subgroups that they are not identifiable. This information must be taken into account wherever possible. Additionally, individual measures may have their own methodologic issues, such as the measurement of GFR, which may be calculated based on several measurements or different formulae (12–14). In this case, we would ideally use the most recent and accepted measurements and formulae to estimate GFR, rather than necessarily depend on that calculated by the data source.
Extending CKD Surveillance Systems Globally
Many countries now have registries for stage 5 CKD with data elements similar to the USRDS. This has allowed international comparisons in prevalence, incidence and treatment for ESRD (1). Because such data collection efforts can be expensive in countries with fewer resources, CKD data for international comparisons will be a challenge. In 2006, experts from around the world examined CKD as a global public health problem Initiative addressing the issue of surveillance through the Kidney Disease Improving Global Outcomes (KDIGO) initiative (15). The experts from different countries made several recommendations with respect to establishment of national CKD surveillance programs (Box 2). Recognizing that data on early stages might be difficult to obtain, the group recommended that all countries institute CKD surveillance including estimates of the prevalence of Stage 4 and Stage 5 CKD. They recommended that nations with resources strive to include earlier stages. In addition, they recommended that data on risk factors for CKD (e.g., age, diabetes, hypertension) and CKD progression (16) be included. Recognizing the efficiency of combined efforts around cardiovascular disease and CKD, they suggested that surveillance for CKD be incorporated into ongoing surveillance programs and data collected that are also CKD risk factors in such programs should be used for CKD surveillance. They also made recommendations about topic areas, sampling and frequency of data collection.
Box 2
Recommendations on surveillance from the position statement from the KDIGO Controversies Conference - Chronic Kidney Disease as a Global Public Health Problem: Approaches and Initiatives Amsterdam, October, 2006 (15).
All countries should have a surveillance program for CKD to estimate prevalence of CKD Stages 4–5 and strive to include earlier stages
–If possible, data on risk factors for development and progression of CKD most relevant for the specific population should be included.
–Surveillance for CKD could be incorporated into existing surveillance programs and data from such programs should be used for surveillance of CKD risk factors.
–Data could be obtained from random samples of the general population or (possibly) populations receiving medical care
–Data should be collected at a frequency of every 5–10 years, or more often, depending on disease dynamics, interventional strategies, and regional resources.
–Additional components of a CKD surveillance program could be: consequences of CKD education/awareness, health system capabilities, quality of care markers and health policy goals
Conclusion
Despite the large amount of work and challenges involved in establishing a CKD surveillance system in the United States, a systematic, comprehensive and feasible approach, as outlined herein, can guide the collection, integration, analysis, and interpretation of CKD information. We are currently using these principles to design a comprehensive surveillance for CKD in the United States. Such a system will be instrumental in prevention and health promotion efforts for CKD.
Acknowledgments
Support: Dr. Powe is supported by grant K24DK02643 from the National Institute of Diabetes, Digestive and Kidney Diseases.
Footnotes
Financial Disclosure: None.
Publisher's Disclaimer: This is a PDF file of an unedited manuscript that has been accepted for publication. As a service to our customers we are providing this early version of the manuscript. The manuscript will undergo copyediting, typesetting, and review of the resulting proof before it is published in its final citable form. Please note that during the production process errors may be discovered which could affect the content, and all legal disclaimers that apply to the journal pertain.
References
- 1.U.S. Renal Data System. USRDS 2005 Annual Data Report: Atlas of End-Stage Renal Disease in the United States. Bethesda, MD: National Institutes of Health, National Institute of Diabetes and Digestive and Kidney Diseases; 2007. [Google Scholar]
- 2.Department of Health and Human Services. With Understanding and Improving Health and Objectives for Improving Health. 2. Vol. 2. Washington, DC: U.S. Government Printing Office; Nov, 2000. Healthy People 2010. [Google Scholar]
- 3.Indicators for chronic disease surveillance. MMWR Recomm Rep. 2004;53(RR11):1–6. [PubMed] [Google Scholar]
- 4.Nickolas TL, Barasch J, Devarajan P. Biomarkers in acute and chronic kidney disease. Curr Opin Nephrol Hypertens. 2008;17:127–132. doi: 10.1097/MNH.0b013e3282f4e525. [DOI] [PubMed] [Google Scholar]
- 5.Health Canada. Chronic Disease Surveillance in Canada: A Background Paper. Health Surveillance Coordination Division, Centre for Surveillance Coordination, Population and Public Health Branch, Health Canada; Jul 2, 2003. [Google Scholar]
- 6.Coresh J, Byrd-Holt D, Astor BC, Briggs JP, Eggers PW, Lacher DA, et al. Chronic kidney disease awareness, prevalence, and trends among U.S. adults, 1999 to 2000. J Am Soc Nephrol. 2005;16(1):180–188. doi: 10.1681/ASN.2004070539. [DOI] [PubMed] [Google Scholar]
- 7.The Atherosclerosis Risk in Communities (ARIC) Study: design and objectives. The ARIC investigators. Am J Epidemiol. 1989;129:687–702. [PubMed] [Google Scholar]
- 8.Feldman HI, Appel LJ, Chertow GM, Cifelli D, Cizman B, Daugirdas J, et al. The Chronic Renal Insufficiency Cohort (CRIC) Study: design and methods. J Am Soc Nephrol. 2003;14(7 Suppl 2):S148–53. doi: 10.1097/01.asn.0000070149.78399.ce. [DOI] [PubMed] [Google Scholar]
- 9.Furth SL, Cole SR, Moxey-Mims M, Kaskel F, Mak R, Schwartz G, Wong C, Muñoz A, Warady BA. Design and methods of the Chronic Kidney Disease in Children (CKiD) prospective cohort study. Clin J Am Soc Nephrol. 2006 Sep;1(5):1006–1015. doi: 10.2215/CJN.01941205. [DOI] [PMC free article] [PubMed] [Google Scholar]
- 10.Coresh J, Astor BC, Greene T, Eknoyan G, Levey AS. Prevalence of chronic kidney disease and decreased kidney function in the adult US population: Third National Health and Nutrition Examination Survey. Am J Kidney Dis. 2003;41(1):1–12. doi: 10.1053/ajkd.2003.50007. [DOI] [PubMed] [Google Scholar]
- 11.Selvin E, Manzi J, Stevens LA, et al. Calibration of serum creatinine in the National Health and Nutrition Examination Surveys (NHANES) 1988–1994, 1999–2004. Am J Kidney Dis. 2007;50(6):918–926. doi: 10.1053/j.ajkd.2007.08.020. [DOI] [PubMed] [Google Scholar]
- 12.Levey AS, Bosch JP, Lewis JB, Greene T, Rogers N, Roth D. A more accurate method to estimate glomerular filtration rate from serum creatinine: a new prediction equation. Modification of Diet in Renal Disease Study Group. Ann Intern Med. 1999;130:461–470. doi: 10.7326/0003-4819-130-6-199903160-00002. [DOI] [PubMed] [Google Scholar]
- 13.Cockcroft DW, Gault MH. Prediction of creatinine clearance from serum creatinine. Nephron. 1976;16:31–41. doi: 10.1159/000180580. [DOI] [PubMed] [Google Scholar]
- 14.Schwartz GJ, Haycock GB, Edelmann CM, Jr, Spitzer A. A simple estimate of glomerular filtration rate in children derived from body length and plasma creatinine. Pediatrics. 1976;58:259–263. [PubMed] [Google Scholar]
- 15.Levey AS, Atkins R, Coresh J, Cohen EP, Collins AJ, Eckardt KU, Nahas ME, Jaber BL, Jadoul M, Levin A, Powe NR, Rossert J, Wheeler DC, Lameire N, Eknoyan G. Chronic kidney disease as a global public health problem: approaches and initiatives - a position statement from Kidney Disease Improving Global Outcomes. Kidney Int. 2007 Aug;72(3):247–59. doi: 10.1038/sj.ki.5002343. [DOI] [PubMed] [Google Scholar]
- 16.McClellan WM, Flanders WD. Risk factors for progressive chronic kidney disease. J Am Soc Nephrol. 2003;14(7 Suppl 2):S65–S70. doi: 10.1097/01.asn.0000070147.10399.9e. [DOI] [PubMed] [Google Scholar]