

Abstract
Excessive alcohol intake characteristic of Alcohol Use Disorders (AUDs) produces neurodegeneration that may recover with abstinence. The mechanism of regeneration is unclear, however neurogenesis from neural stem/progenitor cells is a feasible mechanism of structural plasticity. Therefore, a timecourse of cell proliferation was examined in a rat model of an AUD and showed a striking burst in cell proliferation at 2 days of abstinence preceding the previously reported neurogenic proliferation at 7 days. New cells at 2 days, assessed by Bromo-deoxy-Uridine incorporation and endogenous markers, were observed throughout hippocampus and cortex. Although the majority of these new cells did not become neurons, neurogenesis was not altered at this specific timepoint. These new cells expressed a microglia specific marker, Iba-1, and survived at least 2 months. This first report of microglia proliferation in a model of an AUD suggests that microgliosis could contribute to volume recovery in non-neurogenic regions during abstinence.
Keywords: Alcoholism, regeneration, ethanol, hippocampus, cortex, progenitor, stem cell, adult neurogenesis, microglia, neurodegeneration
Over 8.5% of the U.S. population meets the diagnostic criteria for an alcohol use disorder (AUD), commonly termed alcoholism (Grant et al., 2004). AUDs result in cognitive deficits that correspond to various functional and structural neuropathologies (Sullivan and Pfefferbaum, 2005). Impairments in hippocampal functions such as short term and declarative memory, spatial learning and memory, and impulsivity suggest hippocampal pathology (Brandt et al., 1983; Parsons, 1993; Stephens et al., 2005; Sullivan et al., 2000a;b) though observations of such in human alcoholics vary: some report hippocampal cell or volume loss (Agartz et al., 1999; Beresford et al., 2006; Laakso et al., 2000; Sullivan et al., 2000a) but not others (Harding et al., 1997; Kril et al., 1997). Cortical neurodegeneration in alcoholics is more consistently reported, with impairments across psychometric, cognitive, imaging, volume and cell number analyses (Kril et al., 1997; Sullivan and Pfefferbaum, 2005). Alcoholic neurodegeneration may reverse with abstinence and is often accompanied by improved cognitive performance (Bartels et al., 2007; Sullivan et al., 2000a), however the mechanism of this recovery is not understood. The observation of this structural plasticity in the brain following alcohol dependence lead to the question of whether a recently described mechanism of structural plasticity, the regulation of neural stem/progenitor cells (NSCs), may contribute to neuroregeneration in AUDs.
The phenomenon of NSCs producing new neurons in adult brain, adult neurogenesis, is well-accepted in two regions of the normal brain: (1) the subgranular zone (SGZ) of the hippocampal dentate gyrus (Altman and Das, 1965; Palmer et al., 1997) and (2) the subventricular zone (SVZ) of the anterior lateral ventricles (Lois and Alvarez-Buylla, 1993). The significance of adult neurogenesis is suggested by the thousands of new granule cells generated daily (Cameron and McKay, 2001); by its conservation across species including humans (Eriksson et al., 1998) and by the correlation between hippocampal dysfunction and altered neurogenesis (Cameron and Gould, 1994; Eisch, 2002; Nixon, 2006; Warner-Schmidt and Duman, 2006). Regulation of NSCs/neurogenesis as a means of structural plasticity has been suggested to contribute to hippocampal dysfunction in psychiatric disease (Eisch, 2002; Ming and Song, 2005). Indeed, alcoholics demonstrate impaired cognition and animal models have shown that alcohol intoxication reduces adult neurogenesis at levels similar to the extent of granule cell loss in the dentate gyrus (Nixon and Crews, 2002; Walker et al., 1980). Conversely, a reactive burst in neurogenesis occurs at 1 week in abstinence (Nixon and Crews, 2004). However, NSC proliferation was restricted to the dentate gyrus and does not explain cortical regeneration. As this reactive neurogenesis event is similar to that of other brain damage models where multiple bursts in cell proliferation occur following injury (e.g. Ernst and Christie, 2006) and previous investigations only investigated limited timepoints, we investigated a full timecourse of cell proliferation events in ethanol withdrawal in a model of an AUD. This investigation led to the striking finding of an earlier and more widespread burst in cell proliferation that precedes the neurogenic proliferation event at 1 week of abstinence.
Materials and methods
Subjects
Data from 73 adult male Sprague-Dawley rats (Charles River; Raleigh, NC) weighing in range of 270 – 365g are reported in this study. BrdU and animal model data from the T72, T168, T2 wk and T4wk timepoint were reported previously (Nixon and Crews, 2004) but are included in this report to show the complete timeline of effects of ethanol on cell proliferation (Figure 1 and Table 2 only). Rats were kept on a 12h light: 12h dark cycle with ad libitum access to food and water except during binge alcohol treatment where food was removed. All animal procedures followed the Guide for the Care and Use of Laboratory Animals and were approved by the University of North Carolina Institutional Animal Care and Use Committee.
Figure 1.

Distinct bursts in cell proliferation following binge ethanol exposure. A full timecourse of changes in BrdU incorporation (cell proliferation) assessed from the number of BrdU+ cells/mm2 in the dentate gyrus and SGZ following binge ethanol exposure and reported as a percentage of control. Two distinct increases in cell proliferation are noted at 48 h after the last dose of ethanol (T48) and as we have reported previously at T168. Error bars represent SEM. *p<0.05.
Table 2. Intoxication parameters of the animal model.
All intoxication parameters were statistically similar among all of the timepoints investigated. Thus, neither differences in blood alcohol levels [F(8,32)=1.336; p=0.26] behavioral intoxication [H=8.208, p=0.41], dose [F(8,159)=0.672, p=0.72] peak withdrawal score achieved (H=8.845, p=0.36) nor mean withdrawal score across the 14 hours (H=11.61, p=0.17) behaviors explain the different patterns of BrdU immunoreactivity between time points. Further, in the T48 group, none of these measures correlated with the increase in BrdU+ cells in the dentate gyrus at T48.
| Dose (g/kg/day) | Intoxication behavior | BEC (mg/dl) | Peak WD | Mean WD | |
|---|---|---|---|---|---|
| T24 (n=4) | 9.4 ± 0.6 | 2.0 ± 0.2 | 314.5 ± 45.8 | 3.7 ± 0.2 | 1.7 ± 0.2 |
| T48 (n=5) | 9.4 ± 0.7 | 2.0 ± 0.2 | 281.3 ± 41.0 | 3.2 ± 0.2 | 1.4 ± 0.5 |
| T72 (n=6) | 8.5 ± 0.4 | 2.4 ± 0.1 | 341.2 ± 18.9 | 3.6 ± 0.1 | 2.1 ± 0.3 |
| T96 (n=3) | 8.0 ± 0.8 | 2.5 ± 0.3 | 372.2 ± 39.8 | 3.7 ± 0.1 | 1.1 ± 0.4 |
| T168 (n=7) | 9.1 ± 0.8 | 2.2 ± 0.3 | 298.0 ± 21.6 | 3.2 ± 0.3 | 0.8 ±0.3 |
| T 2wk (n=3) | 9.3 ± 1.6 | 2.1 ± 0.6 | 230.4 ± 66.2 | 3.7 ± 0.1 | 2.2 ±0.1 |
| T 4 wk (n=4) | 9.1 ± 0.3 | 2.2 ± 0.1 | 323.0 ± 38.5 | 3.3 ± 3.2 | 1.3 ± 0.5 |
| T48+28 days (n=5) | 10.4 ± 0.6 | 1.7 ± 0.2 | 277.4 ± 36.4 | 3.6 ± 0.2 | 1.5 ± 0.4 |
| T48+56 days (n=5) | 9.8 ± 0.4 | 1.9 ± 0.1 | 263.8 ± 16.7 | 2.6 ± 0.7 | 0.9 ± 0.4 |
| Correlation w/BrdU at T48 | −0.09 (p=0.89) | 0.41 (p=0.52) | −0.07 (p=0.93) | 0.21 (p=0.78) | −0.30 (p=0.51) |
Alcohol Use Disorder Model - Binge Alcohol Treatment
Ethanol was administered in a binge paradigm following established methods reported in detail elsewhere (Knapp and Crews, 1999; Majchrowicz, 1975; Nixon and Crews, 2004). In brief, rats were administered ethanol diet (25% ethanol w/v in Vanilla Ensure®) or isocaloric control diet via gastric intubation every 8 h for 4 days. Rats were given an initial priming dose of 5 g/kg with subsequent doses determined by a six-point behavioral intoxication scale: 0 – normal rat (dose=5 g/kg); 1 – hypoactive (4 g/kg); 2 – ataxia (3 g/kg); 3 - ataxia with dragging abdomen and/or delayed righting reflex (2 g/kg); 4 – loss of righting reflex (1 g/kg); and 5 – loss of eye blink reflex (0 g/kg). Eight hours after the last dose of alcohol, rat chow was returned to all cages and alcohol withdrawal behaviors were observed and scored from 10 h after the last dose (i.e. T10) through T24, the period of peak withdrawal symptoms for this exposure model (Knapp et al., 1993; Nixon and Crews, 2004; Penland et al., 2001).
Blood ethanol concentrations
To determine blood ethanol concentrations, tail blood samples were drawn 90 m after the afternoon dose on the second day of the binge. Blood samples were centrifuged to separate serum and samples were frozen at −20°C until analysis. Blood ethanol concentrations were determined from serum by a GM7 Analyser (Analox, London, UK) and reported in mg/dl ± SEM.
Bromodeoxyuridine (BrdU) labeling
To show a timecourse of changes in cell proliferation after ethanol exposure, a 300 mg/kg (i.p.) dose of BrdU was used to label dividing cells in rats sacrificed at various times. BrdU (Sigma; 20 mg/ml in 0.9% saline) was injected four hours before various sacrifice time points after the last dose of ethanol: 24 h (T24; BrdU at 20 h after the last dose), 48 h (T48), 72h (T72), 96h (T96), 168h (T168), and at 14 days (T2wk) and 28 days (T4wk). Time points were chosen based on previous studies of other types of neurodegenerative events (Liu et al., 1998; Parent et al., 1997). To examine changes in neurogenesis (BrdU-positive cell survival and cell phenotype), a single dose of BrdU was administered (300 mg/kg, i.p.) and rats were allowed to survive for 28 days. Specifically, rats were injected at T48h (Day 2) and allowed to survive to Day 30, referred to as “T48h + 28 days” or Day 58 “T48 + 2 mos.”
Tissue preparation
Animals were deeply anesthetized with ketamine/xylazine cocktail and transcardially perfused with 0.1M phosphate buffered saline (pH 7.4) followed by 4% paraformaldehyde (PFA) as described (Knapp and Crews, 1999; Nixon and Crews, 2002). Brain tissue was harvested and postfixed in 4% PFA for 2 hours. A 1:12 series of coronal sections (40 µm) were collected on a vibrating microtome (Leica VT1000S) and stored in cryoprotectant at −20°C until immunohistochemical labeling. Sections were obtained from approximately Bregma 1.2 (random start point) through Bregma −7.0 which yielded tissue for the entire dentate gyrus and portions of the subventricular zone (SVZ).
Immunohistochemistry
For general immunohistochemistry, every 12th section was processed following standard procedures for DAB detection (reagent concentrations vary by antibody). In brief, endogenous peroxidases were quenched by incubation in a 0.6% – 1% H2O2 in TBS. Sections were blocked in TBS+ (TBS / 0.1% triton-X / 3–10% normal serum) for 30 m and incubated at 4°C for 24–48 h in primary antibody diluted in TBS+ as shown in Table 1. With washes between each step, the sections were incubated with appropriate biotinylated secondary antibody (Table 1) for 1 h followed by avidin-biotin-peroxidase complex (ABC elite kit, Vector) and detected with Nickel-enhanced diaminobenzidine as a chromagen. Ki-67 labeled sections were lightly countered stained with Neutral Red and all sections were coverslipped with mounting medium (Cytoseal®). For BrdU immunohistochemistry, every 6th section (240 µm apart) was processed following the methods of Kuhn et al. (Kuhn et al., 1996) with an additional denaturing step as reported previously (Nixon and Crews, 2002). Sections were lightly counterstained with cresyl violet and coverslipped with Cytoseal®. In all cases, specificity of the antibody was verified by control experiments: omission of primary antibody, BrdU injection, or secondary antibody.
Table 1. Antibodies.
| Anti- (Source) | Dilution | Secondary used |
|---|---|---|
| BrdU (Chemicon) | 1:4000 | Biotinylated Horse anti-mouse |
| Ki-67 (Novacastra) | 1:200 | Biotinylated Horse anti-mouse |
| Iba-1 (Wako) | 1:400 | AlexaFluor goat anti-rabbit 546 |
| BrdU (Accurate) | 1:400 | AlexaFluor goat anti-rat 488 |
| NeuN (Chemicon) | 1:500 | AlexaFluor goat anti-mouse 633 |
| GFAP (Dako) | 1:2500 | AlexaFluor goat anti-rabbit 546 |
| ED-1 (CD68; Serotec) | 1:400 | Biotinylated Horse anti-mouse |
Fluorescent Immunohistochemistry
To determine cell differentiation, double or triple fluorescent immunohistochemistry was performed on every 12th section similar to that previously described (Kuhn et al., 1997; Nixon and Crews, 2004). In brief, DNA was denatured (without DNase), sections were blocked in TBS+ (TBS/3% goat serum/0.1% triton-X) for 1 h, and incubated 24–48 h at 4°C rat anti-BrdU, mouse anti-NeuN, and rabbit anti-GFAP or rabbit anti-Iba-1 or double labeling only of rat anti-BrdU and rabbit anti-Iba-1. Following washes in TBS+, sections were incubated for 1 h in fluorescent-coupled secondary antibodies at room temperature (Alexa Fluor as listed in Table 1; Molecular Probes) plus 1.5% goat serum. Sections were washed in TBS, mounted and dried, then coverslipped with anti-fade mounting medium (Pro-Long Gold, Molecular Probes).
Quantification
All brains were coded; therefore the experimenter was blind to the conditions during all staining and quantification procedures. Three subjects were removed from the study for insufficient BrdU labeling (Eisch et al., 2000). Quantification of immunopositive profiles was via profile counting for dentate gyrus (Fig 1, Fig 7b) and via image analysis for cortical and other hippocampal regions using methods identical to that previously reported (Crews et al., 2004; Nixon and Crews, 2004). Stereological quantification methods were not used as BrdU-positive (BrdU+) cells are not homogenously distributed (Popken and Farel, 1997) and the data of interest is relative difference and not absolute value (Guillery and Herrup, 1997). Further, stereological estimations, profile counts and/or densitometric analyses show identical results in percent change, the measure of interest (Crews et al., 2004). Briefly, to assess BrdU immunohistochemistry in the dentate gyrus, the number of BrdU+ cells was counted in the granule cell layer and SGZ (50 µm ribbon between the granule cell layer and hilus) of the dorsal dentate gyrus (Bregma −1.8 to−5.8) at 1200X with an oil immersion lens (Olympus Plan Apo 60X oil, numerical aperture = 1.4). The area of the granule cell layer and SGZ was then obtained by tracing the region at 42.5X with image analysis software (Bioquant Nova Advanced Image Analysis, R&M Biometric, Nashville, TN). Cell counts were divided by the area of the traced region, expressed as cells/mm2 ± SEM, and analyzed by ANOVA. For regions with vast BrdU-immunoreactivity (BrdU+IR) such as other hippocampal regions, cortical regions and the SVZ, BrdU+IR (densitometry) was measured with Bioquant image analysis software identical to past reports (Crews et al., 2004; Crews et al., 2006c). The pattern of BrdU immunoreactivity was verified with the endogenous cell proliferation marker, Ki-67 (Kee et al., 2002).
Figure 7.
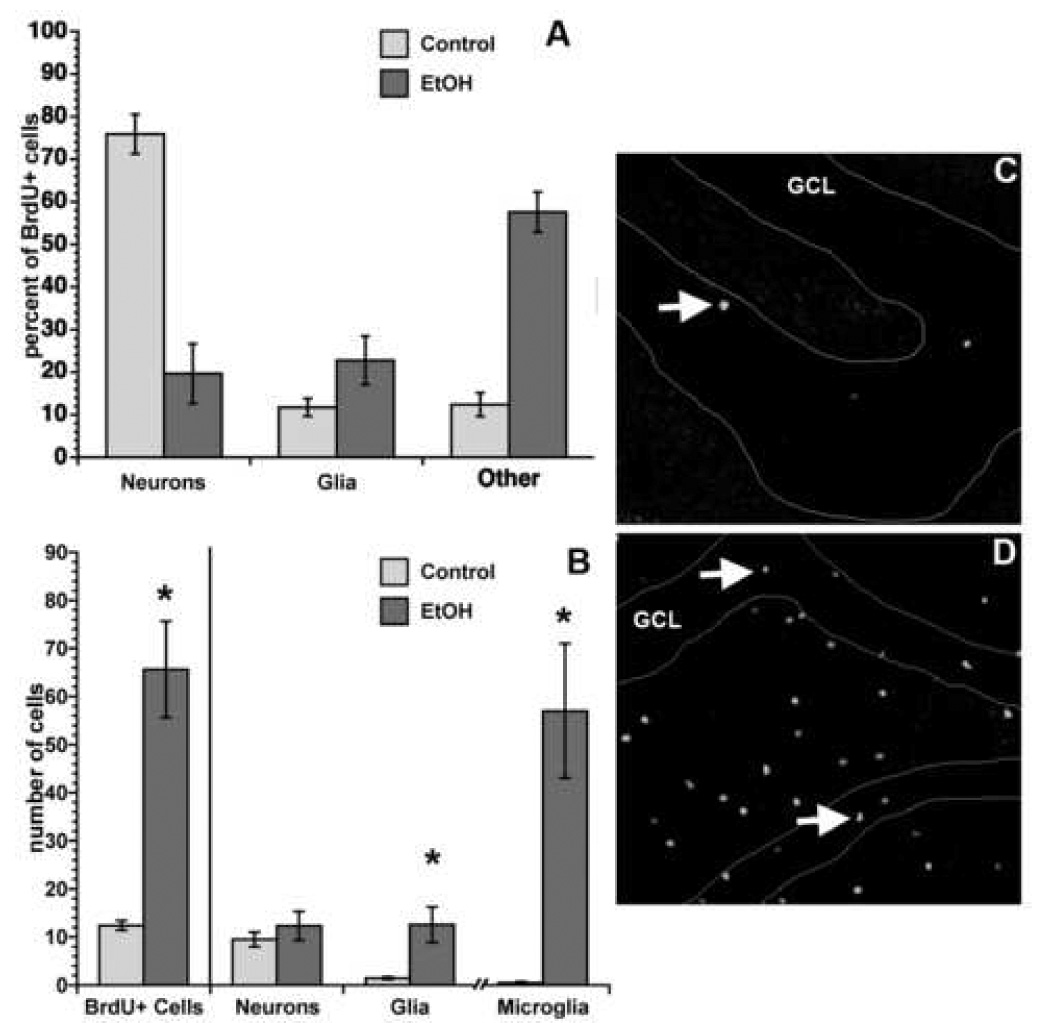
No net change in neurogenesis at day 30 despite proliferation effects at T48. Though BrdU+ cells are increased at day 30 of ethanol abstinence (i.e. T48+28 days) this increase is not in new neurons. Differentiation percentages for BrdU+ cells in the dentate gyrus at T48+28 days (A) were multiplied by BrdU+ cells counts (B, left side of graph) to roughly estimate neurogenesis and gliogenesis. The increased number of BrdU+ cells (profile count) at T48+28 days in ethanol-exposed rats versus controls is obvious as shown in representative fluorescent single label images of BrdU+ cells from a control (C) versus binge ethanol-exposed rats (D). Thus, neurogenesis is not increased at this particular timepoint, however, new astroglia (GFAP+/BrdU+ cells) are increased slightly and new microglia (Iba1+/BrdU+) cells are increased 6-fold. Error bars represent SEM. *p<0.05.
The co-labeling of BrdU with neuron-specific (NeuN), glia-specific (GFAP), or microglia-specific (Iba-1) proteins was confirmed by confocal microscopy as described in Nixon and Crews (2004). Briefly, a Zeiss Axiovert LSM510 confocal microscope and water immersion lens (C-Apochromat 40x/1.2 W corr) was used to take Z-plane section images of BrdU+ cells in a minimum of 5 tissue sections for each subject. The number of BrdU+ cells examined varied by region, treatment group, and subject (due to variability in extent of cell proliferation). A minimum of 50 cells were analyzed in the dentate gyrus of both ethanol and control brains. In other regions where cell proliferation is not common as many cells as feasible were examined. In each ethanol-exposed brain, approximately 40 cells were examined in the hilus, 20 in CA1, 20 in CA2, 30 in the molecular layer, and 20 in cortical regions (somatosensory and entorhinal cortices). For each control brain, fewer cells were present and therefore fewer cells were examined. Typically, five to ten cells were analyzed per non-neurogenic region per control brain. Z-plane section images (512 × 512 pixels) were collected at <0.8µm thickness then analyzed using LSM Image Examiner software. The criteria for co-labeling included appropriate, aligned morphology in 3-D reconstructed cells (orthogonal function) and greater than two Z-plane images of co-positive staining from each axis. Co-localization with NeuN, GFAP or Iba-1 was reported as a percentage of the number of BrdU+ cells that colocalized with each marker. The numberof BrdU+ cells at T48 + 28 days was counted at 400x (profile counts) using an Olympus BX-51 microscope with FITC filter cube and expressed as the number of cells per section. Values of “calculated cell genesis” were computed by multiplying this number of BrdU+ cells by the co-localization percentages as an estimate of neurogenesis and/or gliogenesis.
Statistical analysis
Statistical analyses were conducted in StatView (Mac v 5.0.1, Abacus Concepts, Berkeley, CA) or Prism (GraphPad Prism v4, San Diego, CA). Cell counts, blood ethanol measurements and immunoreactivity measures were analyzed by ANOVA followed by Fisher’s PLSD posthoc tests. For BrdU+IR in cortical regions, where variance was statistically different between the two groups (F-test, p<0.05), all values were log transformed to normalize the data. All two-group comparisons were analyzed by t-test. Behavioral scores (intoxication, withdrawal severity) were compared by nonparametric Kruskall-Wallis analysis of variance. BrdU+ cell counts were correlated to various intoxication measures and reported with Pearson or Spearman r as appropriate. In all cases, values were reported as mean ± SEM and differences were considered significant at p<0.05.
Results
Alcohol model data
A comparison of alcohol intake and withdrawal data for subjects in the proliferation timecourse shows that rats were significantly intoxicated as evidenced by blood ethanol concentrations (BEC), Ethanol intake (g/kg/day), and behavioral intoxication scores (see Table 2). For BECs, serum was obtained from tail blood samples ~90 min after the afternoon dose of ethanol on Day 2 of the binge. The grand mean BEC for all animals in this study was 300.5 ± 14.1 mg/dl, which corresponded to the grand mean dose of 9.2 ± 0.2 g/kg/day. This average dose per day is similar to that of rat self-administration models (Lukoyanov et al., 2000) and more importantly, the BECs are similar to that of bingeing alcoholics (Adachi et al., 1991; Minion et al., 1989; Urso et al., 1981). All ethanol-treated groups were similar in ethanol intoxication parameters evidenced by similar BECs, doses and intoxication behaviors as shown in Table 2.
As withdrawal from alcohol produces a well-described syndrome that can include seizures (Hall and Zador, 1997), and seizures alter NSC proliferation and neurogenesis in other models, we observed and scored withdrawal behaviors from 10 h after the last dose through 24 h. Withdrawal behavior was scored using the scale described in Penland et al. (2001) ranging from 0.0 for no overt signs or behaviors to 3.8 for tonic-clonic seizure-like behavior. Of the 42 rats assessed for ethanol withdrawal behaviors, 95% (n=40) demonstrated behaviors consistent with withdrawal and 38% (n=16) showed seizure-like behavior, percentages similar to past reports (Majchrowicz, 1975; Nixon and Crews, 2004). As reported in Table 2, both peak and mean withdrawal scores were similar between time point groups. Thus, withdrawal severity was statistically similar between all groups.
Cell Proliferation during Ethanol Withdrawal and Abstinence
The aforementioned model of physical dependence was used to examine the effects of high, intoxicating doses of alcohol on cell proliferation in the subgranular zone of the dentate gyrus, a region that contains NSCs (Palmer et al., 1997). The subgranular zone is defined as an approximate 50µm ribbon between the granule cell layer and the hilus. Following four-days of binge alcohol exposure, BrdU was injected to label dividing cells at several time points following the last dose of alcohol. In all cases, clusters and individual BrdU+ cells were visible in the subgranular zone as expected. Therefore, BrdU+ cell counts were conducted first in the dentate gyrus and subgranular zone from the seven time points examined after binge ethanol exposure thus far. As is evident in Figure 1, dramatic differences existed in the number of BrdU+ cells/area [F(7,47)=3.065, p=0.0096] between ethanol and control brains, with posthoc tests confirming significant increases in BrdU+ cells at T48 (p=0.0039) and T168 (p=0.0008) following binge ethanol exposure.
Because a striking pattern of BrdU-immunoreactivity was noted in the hippocampus and cortical regions of T48 binge exposed tissue, additional regions of interest were determined from visual observations of aberrant BrdU-immunoreactivity. All hippocampal subregions (other than dentate gyrus reported above) and cortical regions where distinct BrdU+ cells were easily visualized were then examined for BrdU-immunoreactivity. The immunoreactivity measure was chosen because of the vast number of BrdU+ cells in these regions. As shown in Figure 2, a significant increase in BrdU immunoreactivity (BrdU+IR) is observed across most subregions of the hippocampus including the molecular layer (p<0.0003), CA1 (p<0.0006), and CA2/3 regions (p<0.012). And though the hilus showed an eight-fold increase in BrdU+IR it was not statistically significant (p=0.10). No particular pattern in or around neuronal layers can be observed, an effect that is supported by staining for Ki-67, an endogenous marker of cell proliferation (Figure 2D, E). Ki-67 labels all cells that are actively dividing, that is not G0 phase, the resting phase (Kee et al., 2002). Only two distinct cortical regions among those examined (Figure 3) show significantly increased BrdU+IR in ethanol-exposed brains at T48 compared to controls, specifically the motor cortex (p=0.025), and somatosensory (p=0.038). And though BrdU+IR is increased by four-fold in ethanol-exposed retrosplenial cortex at T48, the effect is not statistically significant (p=0.08). As BrdU+IR was aberrantly increased at this particular time point after ethanol exposure, we also assessed BrdU+IR in the frontal neurogenic region, the subventricular zone. BrdU+IR was not different between binge ethanol-exposed (438.1 ± 102.5 pixels/mm2) and controls (506.2 ± 8.0 pixels/mm2) in the subventricular zone at T48, which suggests that this cell proliferation effect is regionally distinct.
Figure 2.
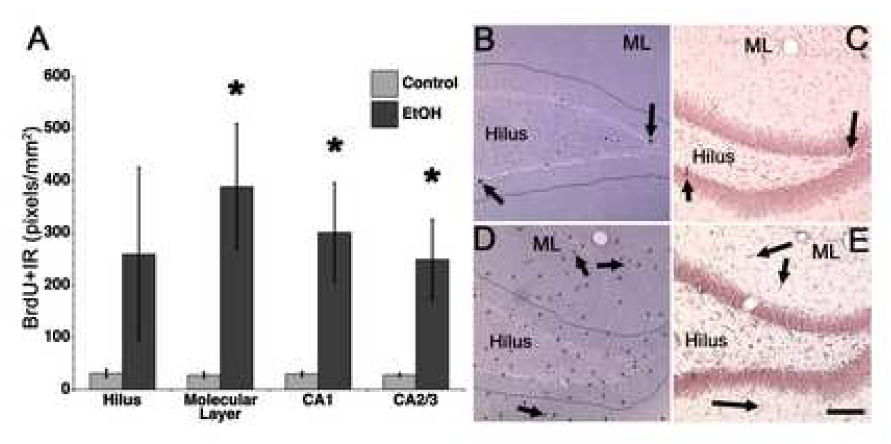
BrdU immunoreactivity is increased across the hippocampus. Increased cell proliferation as indicated by increased BrdU incorporation is evident across most regions of the hippocampus at T48 (A). Representative photomicrographs of BrdU immunoreactivity in the hippocampus is shown for controls (B) and T48 ethanol treated tissue (D). BrdU staining of proliferating cells was confirmed in adjacent tissue sections with Ki-67, an endogenous cell proliferation marker as shown for controls (C) and binge ethanol exposed tissue (E). Error bars represent SEM. *p<0.05.
Figure 3.

Aberrant cortical cell proliferation at T48 following binge ethanol exposure. At T48, a striking pattern of BrdU+IR is noted in a few regions of cortex. BrdU+IR was examined only in those areas with visually distinct immunoreactivity following binge exposure. BrdU+IR was significantly increased in the motor and somatosensory cortices of ethanol exposed rats (n=6) as opposed to controls (n=6) at T48. Error bars represent SEM. *p<0.05.
To examine survival and differentiation of new cells labeled at T48, a second binge experiment was performed: Rats were exposed to binge ethanol or control diet for four days injected with BrdU at T48 then allowed to survive for 28 days. Twenty-eight days is the point at which most newborn cells express a mature cell phenotype and are considered to become permanently incorporated (Kempermann et al., 2003). The initial visual inspection of ethanol-exposed tissue again revealed a striking pattern of BrdU+ cells in both hippocampal and cortical regions. Due to the vast labeling, immunoreactivity was measured for all regions. As shown in Figure 4A, BrdU+IR is significantly increased in all regions of the binge ethanol-exposed hippocampus at 28 days after BrdU injection at T48 (p<0.05 for all regions). Again, no distinct pattern in or around neuronal layers or subregions can be discerned and the BrdU label is dense and triangular in most regions, which is quite unlike what is typically observed in newborn BrdU+ neurons of the dentate gyrus granule cell layer (Figure 4A, Figure 5 E, F). Strikingly, BrdU+IR was observed in more cortical regions after 28 days than in the proliferation time point (Figure 3), therefore many regions were assessed for BrdU+IR. As shown in figure 4B, BrdU+IR was significantly increased in the auditory, entorhinal motor, parietal, perirhinal, retrosplenial, somatosensory, temporal, and visual cortices with merely a trend indicated for insular cortex (p=0.06) and cingulate cortex (p=0.08) as well as in the caudate putamen (p=0.08). Importantly, the same cortical regions that showed significant increases in BrdU+IR at T48, were also significantly increased at T48 + 28 days. However, several additional cortical regions had BrdU+ cells at this time point. To confirm whether these cells persisted long term, an additional timepoint was created: rats were exposed to binge ethanol or control diet as before, injected with BrdU at T48, then allowed to survive 56 days. BrdU immunoreactivity remained in similar locations (Figure 5 C, F) suggesting that these cells persist long term if not permanently.
Figure 4.

Aberrant BrdU+ cells persist 1 month after binge ethanol exposure. In ethanol exposed rats (EtOH), BrdU+ cells labeled at T48 remain in all regions of hippocampus and even more regions of the cortex 28 days later (T48+28 days). Control brains (Con) have only a few BrdU+ cells in the cortex and several in the dentate gyrus as expected in this neurogenic region. The scattered pattern of BrdU+IR was more pronounced and in additional regions of cortex despite ethanol treatment parameters being identical between the two timepoints, T48 and T48+28 days. Scale bar equals 200µm. Error bars are SEM. *p<0.05
Figure 5.

BrdU+IR at T48+56 days in ethanol-exposed tissue is similar to that of T48+28 days. Representative low magnification confocal images of control (A, D) versus ethanol-exposed brains (B,C,E,F) where Green = BrdU+ cells, Red = NeuN immunoreactivity and Blue = GFAP+ immunoreactivity. Though control brains (A,D) show the expected few BrdU+ cells (green) in non neurogenic regions such as the CA fields and Molecular Layer (A), aberrant BrdU+ cells remain in all regions of the hippocampus of ethanol-exposed tissue, especially in CA fields and the Molecular Layer after 28 (B) and 56 days (C). BrdU+ cells are visible in the dentate gyrus of control brains (D, arrow) however BrdU+ cells (arrows) show a similar pattern in ethanol-exposed tissue at T48 plus 28 days (E) and 56 days (F).
To identify what type of cells the new cells born on T48 become, a cell phenotype study was performed using multiple fluorescent immunohistochemistry and confocal microscopy (Figure 6). The first phenotype study focused on the dentate gyrus and examined multiple labeling for BrdU (newborn cell), NeuN (mature neuron) and GFAP (mature glia; representative images in Figure 6). Figure 7 shows the percent of BrdU+ cells that also labeled with the various mature cell markers. As expected, ~75% of newborn cells in control animals co-expressed NeuN and are considered newborn neurons (Figure 6, 7). However in the binge-ethanol exposed group only 24% of BrdU+ cells co-labeled with NeuN (e.g. Figure 6C), a percentage that is significantly different from the controls (p=0.003). For the mature glia marker, GFAP, BrdU+ cells in control brains colabeled with this marker in 10% of newborn cells whereas in binge Ethanol-exposed tissue, BrdU and GFAP colabeled in 20% of BrdU+ cells (p=n.s.). Importantly, in the control brains, this triple labeling scheme identified the phenotype of nearly 90% of the newborn cells as neurons or astroglia, but in binge ethanol exposed brains, this scheme only identified 40% of newborn cells. Therefore, a majority of cells born at T48 were not identified by these mature neuron or mature glia markers. To identify these unidentified BrdU+ cells, initially, we compared the aberrant pattern of BrdU expression in the molecular layer and CA fields with the pattern of expression of other markers. Examination of single label, DAB colorization on T48 + 28 day binge ethanol tissue only showed that the pattern of expression of various immature neurons markers (doublecortin, β-Tubulin III) and an oligodendrocyte marker (O4) were not similar to the pattern of BrdU+ cells (data not shown) which then ruled out the likelihood that newborn cells were newborn neurons or newborn oligodendrocytes. Next, a microglia marker (Iba-1) was examined in single label and based on the distribution of Iba-1 across the hippocampus, we then examined Iba-1 and BrdU colabeling in T48 + 28 day tissue. As is clearly shown in Table 3 and in representative images in Figure 8, very few BrdU+ cells colabeled with Iba-1 in control brains, whereas the majority of BrdU+ cells in binge ethanol-exposed brains colabeled with Iba-1, a significant difference in new cell phenotype. This colabeling between BrdU and Iba-1 was observed across all regions examined in binge ethanol-exposed tissue at T48 + 28 days and similarly when phenotyping was carried out on T48 + 56 day tissue (Table 3, Figure 7). For the neurogenic dentate gyrus granule cell and SGZ, phenotype percentages were then multiplied by BrdU+ cells counts (of fluorescent labeled BrdU+ cells in dentate gyrus/SGZ) to estimate effects on neurogenesis and cell genesis. As shown in Figure 7B, the number of BrdU+ cells is significantly increased in binge ethanol-exposed tissue (p=0.02). However when that increase in BrdU+ cells is multiplied by the low percentage of neuronal phenotype (Figure 7A), the result is no net change in calculated numbers of new neurons or “calculated neurogenesis” (Figure 7B). Further, when BrdU+ cell number is multiplied by the percent phenotype for glia and microglia, there are significant increases in both the calculated number of newborn astroglia [BrdU+/GFAP+/NeuN-; p=0.04] and microglia [BrdU+/Iba-1+; p<0.01]. Thus, binge ethanol exposure induces the proliferation of glia and predominantly microglia but does not alter neurogenesis at this particular time point.
Figure 6.

(A) Representative confocal images are shown for fluorescent triple labeling of BrdU (new cell, green), NeuN (neuron specific, red) and GFAP (astroglia specific, blue) or Iba-1 (microglia specific, blue) in the dentate gyrus of control and ethanol-exposed rats at T48+28days. In controls, the majority of new (BrdU+) cells colabel with NeuN and thus are new neurons (B). In ethanol exposed tissue at 28 and 56 days after being labeled with BrdU at T48 most new BrdU+ cells do not colabel with NeuN but do colabel with Iba1, a microglia specific calcium binding protein (see Figure 8). In the dentate gyrus, colocalization of BrdU and NeuN is confirmed in reconstructed Z-stacks (orthogonal view, LSM Image Examiner) for from controls (red NeuN + green BrdU = yellow new neuron shown in B). The lack of colocalization between BrdU and NeuN in T48+28days ethanol-exposed tissue is shown in representative images from T48+28 (C) and T48+56 (D) brain tissue. Importantly at no time did we observe BrdU+/NeuN+ cells in the cortex, which supports that binge ethanol exposure does not induce cortical neurogenesis at this time point.
Table 3. Cell phenotype percentages at 28 and 56 days post BrdU labeling.
Percentage of BrdU+ cells expressing Iba-1, a marker for microglia. At T48 + 28 days, BrdU+ cells were analyzed for colabeling with Iba-1 from ethanol-exposed (n=5) and control brains (n=4) and a separate group at T48 + 56 days from ethanolexposed (n=3) and control brains (n=3).
| Dentate Gyrus | Hilus | Molecular Layer | CA1 | CA2/3 | Cortex | |
|---|---|---|---|---|---|---|
| T48+28 days Control | 3.3 ± 1.8 | 1.6 ± 1.6 | 2.3 ± 2.3 | 12.5 ± 12.5 | 0.0 | 6.9 ± 4.2 |
| T48+28 days Ethanol | 74.2 ± 14.8** | 78.9 ± 16.6** | 80.9 ± 16.6** | 95.5 ± 3.5** | 75.1 ± 15.7** | 71.3 ± 12.9** |
| T48 +56 days Control | 0.0 | 4.2 ± 4.2 | 13.2 ± 6.7 | 28.6 ± 28.6 | 0.0 | 6.6 ± 4.2 |
| T48+56 days Ethanol | 78.3 ± 3.2** | 90.7 ± 9.3** | 94.7±2.7** | 100 ± 0.0* | 93.3 ± 6.7** | 56.3 ± 24.1† |
p<0.01
p<0.05
p=0.10
Figure 8.

After binge ethanol exposure, most dividing cells at T48 become microglia. BrdU primarily colabels with Iba-1, a microglia-specific marker, in ethanol treated tissue at T48 + 28 days. Representative confocal images are shown for BrdU (a,d,g,j,m), Iba-1 (b,e,h,k,n), and the two merged together (c,f,i,l,o) across cortex (a – f), hippocampus molecular layer (g–i) hippocampus CA1 (j–l), and hippocampus hilus (m–o) in ethanol (d – o) and control (a–c only) tissue. Representative 3-D reconstructed images (orthogonal view in LSM Image Examiner) are shown for cortex (p), molecular layer (q) and CA1 fields (r) of ethanol treated tissue to show how overlapping morphology in multiple Z-plane sections indicate colabeling.
As proliferation of microglia is a hallmark of microglial activation and microglial activation occurs after many cell death events in the brain, we examined the expression of a commonly used marker of microglial activation ED-1 (also referred to as CD68). ED-1 expression correlates with phagocytic activity (Damoiseaux et al., 1994), a characteristic of reactive microglia and/or macrophages (Guillemin and Brew, 2004). As control brains express low to minimal ED-1 protein, we included a positive control brain in these studies to verify ED-1 immunohistochemical labeling. The positive control, a piece of brain tissue from a rat given a single 10 mg/kg dose of kainate and allowed to seize for several hours, showed vast ED-1 immunoreactivity characteristic of phagocytic or fully “activated” microglia. Neither control brains nor T48 ethanol exposed brains showed significant ED-1 immunoreactivity within the brain parenchyma, as shown in Figure 9. Indeed, this lack of ED-1 immunoreactivity is consistent with the morphology of cells labeled with Iba-1 in the colabeling studies. Iba-1 positive cells appear ramified (see Figure 7), which is consistent with a non-phagocytic activation state and thus, the lack of ED-1 immunoreactivity.
Figure 9.

Lack of ED1 immunoreactivity for phagocytic microglia following binge ethanol exposure. Immunohistochemistry for ED1 was performed on T48 ethanol (a) and control (b) treated tissue along with positive control tissue (c, Kainate treated rat). As shown in panel A, no obvious ED1-positive cells are apparent following binge ethanol exposure, however some staining appears in the blood vessels (arrows). The morphology of these possible cells is dissimilar to the obvious ED1-positive phagocytes shown in positive control tissue (C) and ED-1 immunoreactivity is similar between binge ethanol and control tissue.
Discussion
These data are the first to directly show increased, newborn microglia in brain or microglia proliferation in any model of alcohol exposure in vivo. Specifically, we report for the first time that abstinence from ethanol, in a rodent model of an AUD, produces distinct peaks in brain cell proliferation that are regionally and temporally specific. At two days after the last dose of alcohol, BrdU+ cells were observed across the entire hippocampus, confirmed by the striking and significant increase in BrdU+IR and Ki67+IR in the CA fields, dentate gyrus and molecular layer. BrdU+ cells were also observed in distinct regions of cortex. Twenty-eight days later (T48+28days), BrdU+ cells were observed in even more regions of cortex. Phenotypic analysis of these newborn cells shows that the majority of new cells were not neurons. A large majority of these new cells co-labeled with Iba-1, a marker unique to microglia. Thus, binge ethanol exposure induces cell proliferation across the hippocampus and cortex that results in a long-term increase in new microglia in brain that persist for at least a few months. Interestingly, this mimics recent studies in post-mortem human alcoholic brain that found increased levels of cytokines and markers of microglia in alcoholics, but not moderate drinkers (He et al., 2008). Altogether, these data and our previous report on NSC proliferation/neurogenesis following binge ethanol exposure indicate that two distinct peaks in cell proliferation occur: first proliferation of microglia at T48 followed by proliferation of neuronal progenitors at T168 after binge exposure.
Though this is the first report showing microglial proliferation following binge alcohol exposure, this effect is consistent with reports of cell proliferation in various models of brain damage (Dash et al., 2001; Gould and Tanapat, 1997). Microglial proliferation is commonly observed after cell death (Hailer et al., 1999) and this binge alcohol model produces neuronal cell death (Collins et al., 1996; Obernier et al., 2002a; Zou et al., 1996). Specifically, degenerating cells increase during the 4-day binge and peak at the fourth day of ethanol intoxication (Figure 10; Crews et al., 2000; Obernier, 2002a;b). Neurodegeneration via ethanol inhibition of neurogenesis in the dentate gyrus also continues during intoxication (Nixon and Crews, 2002; 2004). Although the binge ethanol model has a significant withdrawal syndrome, markers of neurodegeneration subside during withdrawal and abstinence: markers decrease significantly by day 2–3 of abstinence and completely recede by 1 week (Figure 10; Crews et al., 2000; 2004; Obernier et al., 2002a). Thus, these bursts in cell proliferation occur as the degeneration and fragments of dying neurons clear.
Figure 10.

Temporal relationship of binge ethanol induced neurodegeneration and cell genesis. This figure illustrates that bursts of cell genesis occur in the week following binge ethanol treatment but overlap with neurodegeneration due to cell death. Neurodegenerative events (dashed-dotted line) are represented as downward lines on the y-axis whereas regenerative events are represented as upward lines (various lines as indicated in legend). The 4-day binge ethanol model has been studied extensively as a model of alcohol dependence and alcohol induced neurodegeneration. Multiple markers of neuronal cell death, particularly agyrophilic silver stain, have characterized pyramidal cell degeneration in cortical and hippocampal regions over the 4-day binge (Crews et al., 2000). Simultaneous to neuronal cell death during intoxication is ethanol inhibition of neural progenitor cell proliferation, e.g. neurogenesis (dotted line). Symptoms of physical withdrawal, including possible seizures, occur during the first 24 hrs (lightning bolt) post ethanol binge. The T48 burst in microglia proliferation (dashed line) occurs in multiple brain regions including the hippocampus and distinct regions of cortex. These new cells persist at least 56 days if not permanently (Kempermann et al., 2003). The T168 burst in progenitor cell proliferation is restricted primarily to the dentate gyrus and results in more new neurons 1 month later (dotted line; see also Nixon and Crews, 2004).
Binge ethanol induced degeneration is localized primarily to association cortex, such as piriform, perirhinal and entorhinal cortex, as well as the hippocampal dentate gyrus. We found increased cell proliferation in limbic regions showing neurodegeneration as well as across many cortical and non-cortical brain regions not previously thought to be damaged by binge ethanol treatment. Studies of cell proliferation after brain insults have similarly found cell genesis in regions not directly damaged. Entorhinal cortex lesions cause an increase in proliferation of microglia 3 days later in dentate gyrus on both the lesion side and the contralateral hippocampus suggesting that proliferation occurs in projection areas of the dying neurons as well as in the cell body regions (Hailer et al. 1999). Similarly, focal electrolytic lesions of the dentate gyrus result in increased proliferation in both the ipsilateral and contralateral dentate gyrus (Ernst and Christie, 2006). Although binge ethanol induced neurodegeneration is not observed in the same regions as those showing microglia proliferation at T48, degeneration studies primarily focused on the loss of cell bodies. The loss of innervation in the projection areas of damaged neurons is known to stimulate proliferation and/or migration of microglia to deafferented regions (Fagan and Gage, 1994; Gall et al., 1979). Accordingly, at T48+28days, broad areas of the cortex show new microglia that were not as prominent just after labeling (T48) consistent with migration and/or honing to sites of damage/deafferentation (e.g. Figure 4b). Therefore, this report of vast cortical and hippocampal microgliosis at T48+28 days and T48+56 days suggests novel regions of alcohol-induced damage.
We found that dentate gyrus proliferation increases from binge ethanol inhibited levels (T0) to control levels after one day of abstinence that is followed by distinct increases in proliferation during the first week of abstinence. Several other models of brain injury also have shown two bursts in cell proliferation with microglia proliferation followed by neuronal progenitor proliferation (Dash et al., 2001; Ernst and Christie, 2006; Rice et al., 2003). Indeed, this pattern is identical to the full timecourse of cell proliferation events during ethanol withdrawal and abstinence (Figure 1; Nixon and Crews, 2004). In models of traumatic brain injury and other acute neurodegenerative events, microglia proliferation is commonly noted 1–2 days after cell death though not necessarily 1–2 days after the event itself (Amat et al., 1996; Ernst and Christie, 2006; Fagan and Gage, 1994; Gall et al., 1979; Marella and Chabry, 2004; Vela et al., 2002; Williams et al., 1994). The specific timing of this increase in microglia proliferation at T48 is consistent with other models of diffuse brain injury and specifically an injury that is not direct (e.g. Ernst and Christie, 2006). Microglia proliferate within 12 to 24 hours in regions immediately adjacent to a lesion, but more distal sites of retrograde or anterograde degeneration may not have a proliferative reaction until 2 days (Vela et al., 2002). Remarkably, the pattern of microglial proliferation in the hippocampus following binge ethanol treatment is identical to that of a partially deafferented hippocampus (Gall et al., 1979). Hippocampal deafferentation is consistent with binge ethanol-induced cell death in entorhinal/perirhinal cortices. Therefore, the timing and pattern of microglial proliferation suggests a diffuse brain injury due to excessive alcohol intake.
Microglia exist in multiple states that can range from anti-inflammatory and trophic secretion of growth factors to phagocytic and pro-inflammatory. A role for microglia in alcohol-induced brain damage has been suggested for years (Streit, 1994; Collins et al., 1998), though there are no published reports of fully activated, or phagocytic, microglia in any in vivo AUD model. Interestingly, human alcoholic brain shows increased microglia markers, but no signs of increased proinflammatory microglia (He et al., 2008). Further, studies in animals have reported that chronic ethanol can cause a long term increase in the density of [3H]PK-11195, a ligand for the peripheral benzodiazepine receptor that is enriched in activated microglia (Obernier et al., 2002b; Syapin and Alkana, 1988; Weissman et al., 2004). However, the “activated” microglia marker for phagocytes, ED-1, is not expressed at T48 (Figure 9) nor any other time point examined to date (data not shown). This effect is supported by the lack of amoeboid-shaped microglia in any of the new microglia examined in this study (Figure 7) or in past reports in cerebellum (Riikonen et al., 2002) or cortex (Crews et al., 2006a). Although microglial proliferation is a sign of microglial activation, our studies are consistent with microglia not activated to a proinflammatory state. Alcoholics, however, do not just binge once and it must be considered that the increased microglia could heighten later responses to insults that may then increase degeneration if microglia become fully activated. Alternatively, an increase in anti-inflammatory microglia could contribute to the recovery of the brain during abstinence (Raivich et al., 1999). Additional work is needed to fully understand the phenotype of these new born microglia and how they contribute to brain degeneration and/or regeneration in abstinence.
In summary, during the first week of abstinence following a 4-day binge ethanol treatment there are distinct bursts of cell proliferation in many regions of the brain, particularly in the hippocampus and cortex. At the early timepoint in abstinence, proliferating cells labeled with BrdU are observed in multiple brain regions and largely differentiate into microglia. The late burst of proliferating cells is restricted to the neurogenic subgranular zone of the dentate gyrus and differentiates over several weeks mostly into neurons. These distinct cell genesis events during abstinence represent a unique and long-term change in brain cell structure that persists for long periods and perhaps permanently.
Acknowledgements
This research was supported by NIAAA, the Alcoholic Beverage Medical Research Foundation, and the Bowles Center for Alcohol Studies.
Footnotes
Publisher's Disclaimer: This is a PDF file of an unedited manuscript that has been accepted for publication. As a service to our customers we are providing this early version of the manuscript. The manuscript will undergo copyediting, typesetting, and review of the resulting proof before it is published in its final citable form. Please note that during the production process errors may be discovered which could affect the content, and all legal disclaimers that apply to the journal pertain.
References
- Adachi J, Mizoi Y, Fukunaga T, Ogawa Y, Ueno Y, Imamichi H. Degrees of alcohol intoxication in 117 hospitalized cases. J Stud Alcohol. 1991;52:448–453. doi: 10.15288/jsa.1991.52.448. [DOI] [PubMed] [Google Scholar]
- Agartz I, Momenan R, Rawlings RR, Kerich MJ, Hommer DW. Hippocampal volume in patients with alcohol dependence. Arch Gen Psychiatry. 1999;56:356–363. doi: 10.1001/archpsyc.56.4.356. [DOI] [PubMed] [Google Scholar]
- Altman J, Das GD. Autoradiographic and histological evidence of postnatal hippocampal neurogenesis in rats. J Comp Neurol. 1965;124:319–335. doi: 10.1002/cne.901240303. [DOI] [PubMed] [Google Scholar]
- Amat JA, Ishiguro H, Nakamura K, Norton WT. Phenotypic diversity and kinetics of proliferating microglia and astrocytes following cortical stab wounds. Glia. 1996;16:368–382. doi: 10.1002/(SICI)1098-1136(199604)16:4<368::AID-GLIA9>3.0.CO;2-W. [DOI] [PubMed] [Google Scholar]
- Bartels C, Kunert HJ, Stawicki S, Kroner-Herwig B, Ehrenreich H, Krampe H. Recovery of hippocampus-related functions in chronic alcoholics during monitored long-term abstinence. Alcohol Alcohol. 2007;42:92–102. doi: 10.1093/alcalc/agl104. [DOI] [PubMed] [Google Scholar]
- Beresford TP, Arciniegas DB, Alfers J, Clapp L, Martin B, Du Y, Liu D, Shen D, Davatzikos C. Hippocampus volume loss due to chronic heavy drinking. Alcohol Clin Exp Res. 2006;30:1866–1870. doi: 10.1111/j.1530-0277.2006.00223.x. [DOI] [PubMed] [Google Scholar]
- Bondy SC. Ethanol toxicity and oxidative stress. Toxicol Lett. 1992;63:231–241. doi: 10.1016/0378-4274(92)90086-y. [DOI] [PubMed] [Google Scholar]
- Brandt J, Butters N, Ryan C, Bayog R. Cognitive loss and recovery in long-term alcohol abusers. Arch Gen Psychiatry. 1983;40:435–442. doi: 10.1001/archpsyc.1983.01790040089012. [DOI] [PubMed] [Google Scholar]
- Cameron HA, Gould E. Adult neurogenesis is regulated by adrenal steroids in the dentate gyrus. Neuroscience. 1994;61:203–209. doi: 10.1016/0306-4522(94)90224-0. [DOI] [PubMed] [Google Scholar]
- Cameron HA, McKay RD. Adult neurogenesis produces a large pool of new granule cells in the dentate gyrus. J Comp Neurol. 2001;435:406–417. doi: 10.1002/cne.1040. [DOI] [PubMed] [Google Scholar]
- Carlen PL, Wilkinson DA. Reversibility of alcohol-related brain damage: clinical and experimental observations. Acta Med Scand Suppl. 1987;717:19–26. doi: 10.1111/j.0954-6820.1987.tb13038.x. [DOI] [PubMed] [Google Scholar]
- Collins MA, Corse TD, Neafsey EJ. Neuronal degeneration in rat cerebrocortical and olfactory regions during subchronic "binge" intoxication with ethanol: possible explanation for olfactory deficits in alcoholics. Alcohol Clin Exp Res. 1996;20:284–292. doi: 10.1111/j.1530-0277.1996.tb01641.x. [DOI] [PubMed] [Google Scholar]
- Collins MA, Zou JY, Neafsey EJ. Brain damage due to episodic alcohol exposure in vivo and in vitro: furosemide neuroprotection implicates edema-based mechanism. FASEB. 1998;12:221–230. doi: 10.1096/fasebj.12.2.221. [DOI] [PubMed] [Google Scholar]
- Crews F, Nixon K, Kim D, Joseph J, Shukitt-Hale B, Qin L, Zou J. BHT blocks NF-kappaB activation and ethanol-induced brain damage. Alcohol Clin Exp Res. 2006a;30:1938–1949. doi: 10.1111/j.1530-0277.2006.00239.x. [DOI] [PubMed] [Google Scholar]
- Crews FT. Neurotoxicity of alcohol: Excitotoxicity, oxidative stress, neurotrophic factors, apoptosis, and cell adhesion molecules. In: Noronha M, et al., editors. Review of NIAAA's Neuroscience and Behavioral Research Portfolio, Monograph No 34. Bethesda, MD: National Institute of Health; 2000. pp. 189–206. [Google Scholar]
- Crews FT, Bechara R, Brown LA, Guidot DM, Mandrekar P, Oak S, Qin L, Szabo G, Wheeler M, Zou J. Cytokines and alcohol. Alcohol Clin Exp Res. 2006b;30:720–730. doi: 10.1111/j.1530-0277.2006.00084.x. [DOI] [PubMed] [Google Scholar]
- Crews FT, Braun CJ, Hoplight B, Switzer RC, 3rd, Knapp DJ. Binge ethanol consumption causes differential brain damage in young adolescent rats compared with adult rats. Alcohol Clin Exp Res. 2000;24:1712–1723. [PubMed] [Google Scholar]
- Crews FT, Chandler LJ. Excitotoxicity and the neuropathology of ethanol. In: Hunt WA, Nixon SJ, editors. Alcohol-Induced Brain Damage. Rockville: NIAAA Monograph; 1993. pp. 355–371. [Google Scholar]
- Crews FT, Collins MA, Dlugos C, Littleton J, Wilkins L, Neafsey EJ, Pentney R, Snell LD, Tabakoff B, Zou J, Noronha A. Alcohol-induced neurodegeneration: when, where and why? Alcohol Clin Exp Res. 2004;28:350–364. doi: 10.1097/01.alc.0000113416.65546.01. [DOI] [PubMed] [Google Scholar]
- Crews FT, Mdzinarishvili A, Kim DH, He J, Nixon K. Neurogenesis in adolescent brain is potently inhibited by ethanol. Neuroscience. 2006c;137:437–445. doi: 10.1016/j.neuroscience.2005.08.090. [DOI] [PubMed] [Google Scholar]
- Crews FT, Nixon K, Wilkie ME. Exercise reverses ethanol inhibition of neural stem cell proliferation. Alcohol. 2004;33:63–71. doi: 10.1016/j.alcohol.2004.04.005. [DOI] [PubMed] [Google Scholar]
- Damoiseaux JG, Dopp EA, Calame W, Chao D, MacPherson GG, Dijkstra CD. Rat macrophage lysosomal membrane antigen recognized by monoclonal antibody ED1. Immunology. 1994;83:140–147. [PMC free article] [PubMed] [Google Scholar]
- Dash PK, Mach SA, Moore AN. Enhanced neurogenesis in the rodent hippocampus following traumatic brain injury. Journal of Neuroscience Research. 2001;63:313–319. doi: 10.1002/1097-4547(20010215)63:4<313::AID-JNR1025>3.0.CO;2-4. [DOI] [PubMed] [Google Scholar]
- Eisch AJ. Adult neurogenesis: implications for psychiatry. Prog Brain Res. 2002;138:315–342. doi: 10.1016/S0079-6123(02)38085-3. [DOI] [PubMed] [Google Scholar]
- Eisch AJ, Barrot M, Schad CA, Self DW, Nestler EJ. Opiates inhibit neurogenesis in the adult rat hippocampus. Proc Natl Acad Sci U S A. 2000;97:7579–7584. doi: 10.1073/pnas.120552597. [DOI] [PMC free article] [PubMed] [Google Scholar]
- Eriksson PS, Perfilieva E, Bjork-Eriksson T, Alborn AM, Nordborg C, Peterson DA, Gage FH. Neurogenesis in the adult human hippocampus. Nat Med. 1998;4:1313–1317. doi: 10.1038/3305. [DOI] [PubMed] [Google Scholar]
- Ernst C, Christie BR. Temporally specific proliferation events are induced in the hippocampus following acute focal injury. J Neurosci Res. 2006;83:349–361. doi: 10.1002/jnr.20724. [DOI] [PubMed] [Google Scholar]
- Fagan AM, Gage FH. Mechanisms of sprouting in the adult central nervous system: cellular responses in areas of terminal degeneration and reinnervation in the rat hippocampus. Neuroscience. 1994;58:705–725. doi: 10.1016/0306-4522(94)90449-9. [DOI] [PubMed] [Google Scholar]
- Gall C, Rose G, Lynch G. Proliferative and migratory activity of glial cells in the partially deafferented hippocampus. J Comp Neurol. 1979;183:539–549. doi: 10.1002/cne.901830306. [DOI] [PubMed] [Google Scholar]
- Gould E, Tanapat P. Lesion-induced proliferation of neuronal progenitors in the dentate gyrus of the adult rat. Neuroscience. 1997;80:427–436. doi: 10.1016/s0306-4522(97)00127-9. [DOI] [PubMed] [Google Scholar]
- Grant BF, Dawson DA, Stinson FS, Chou SP, Dufour MC, Pickering RP. The 12-month prevalence and trends in DSM-IV alcohol abuse and dependence: United States, 1991–1992 and 2001–2002. Drug Alcohol Depend. 2004;74:223–234. doi: 10.1016/j.drugalcdep.2004.02.004. [DOI] [PubMed] [Google Scholar]
- Guillemin GJ, Brew BJ. Microglia, macrophages, perivascular macrophages, and pericytes: a review of function and identification. J Leukoc Biol. 2004;75:388–397. doi: 10.1189/jlb.0303114. [DOI] [PubMed] [Google Scholar]
- Guillery RW, Herrup K. Quantification without pontification: choosing a method for counting objects in sectioned tissues. J Comp Neurol. 1997;386:2–7. doi: 10.1002/(sici)1096-9861(19970915)386:1<2::aid-cne2>3.0.co;2-6. [DOI] [PubMed] [Google Scholar]
- Hailer NP, Grampp A, Nitsch R. Proliferation of microglia and astrocytes in the dentate gyrus following entorhinal cortex lesion: a quantitative bromodeoxyuridine-labelling study. Euro J Neurosci. 1999;11:3359–3364. doi: 10.1046/j.1460-9568.1999.00808.x. [DOI] [PubMed] [Google Scholar]
- Hall W, Zador D. The alcohol withdrawal syndrome. Lancet. 1997;349:1897–1900. doi: 10.1016/S0140-6736(97)04572-8. [DOI] [PubMed] [Google Scholar]
- Hamelink C, Hampson A, Wink DA, Eiden LE, Eskay RL. Comparison of cannabidiol, antioxidants, and diuretics in reversing binge ethanol-induced neurotoxicity. J Pharmacol Exp Ther. 2005;314:780–788. doi: 10.1124/jpet.105.085779. [DOI] [PMC free article] [PubMed] [Google Scholar]
- Harding AJ, Wong A, Svoboda M, Kril JJ, Halliday GM. Chronic alcohol consumption does not cause hippocampal neuron loss in humans. Hippocampus. 1997;7:78–87. doi: 10.1002/(SICI)1098-1063(1997)7:1<78::AID-HIPO8>3.0.CO;2-3. [DOI] [PubMed] [Google Scholar]
- He J, Pluzarev O, Crews FT. Increased MCP-1 and microglia in various regions of human alcohol brain. Exp Neurol. 2008 doi: 10.1016/j.expneurol.2007.11.017. in press. [DOI] [PMC free article] [PubMed] [Google Scholar]
- Kee N, Sivalingam S, Boonstra R, Wojtowicz JM. The utility of Ki-67 and BrdU as proliferative markers of adult neurogenesis. J Neurosci Methods. 2002;115:97–105. doi: 10.1016/s0165-0270(02)00007-9. [DOI] [PubMed] [Google Scholar]
- Kempermann G, Gast D, Kronenberg G, Yamaguchi M, Gage FH. Early determination and long-term persistence of adult-generated new neurons in the hippocampus of mice. Development. 2003;130:391–399. doi: 10.1242/dev.00203. [DOI] [PubMed] [Google Scholar]
- Knapp DJ, Crews FT. Induction of cyclooxygenase-2 in brain during acute and chronic ethanol treatment and ethanol withdrawal. Alcohol Clin Exp Res. 1999;23:633–643. [PubMed] [Google Scholar]
- Knapp DJ, Saiers JA, Pohorecky LA. Observations of novel behaviors as indices of ethanol withdrawal-induced anxiety. Alcohol Alcohol Suppl. 1993;2:489–493. [PubMed] [Google Scholar]
- Kreutzberg GW. Microglia: a sensor for pathological events in the CNS. Trends Neurosci. 1996;19:312–318. doi: 10.1016/0166-2236(96)10049-7. [DOI] [PubMed] [Google Scholar]
- Kril JJ, Halliday GM, Cartwright H. The cerebral cortex is damaged in chronic alcoholics. Neuroscience. 1997;79:983–998. doi: 10.1016/s0306-4522(97)00083-3. [DOI] [PubMed] [Google Scholar]
- Kuhn HG, Dickinson-Anson H, Gage FH. Neurogenesis in the dentate gyrus of the adult rat: age-related decrease of neuronal progenitor proliferation. J Neurosci. 1996;16:2027–2033. doi: 10.1523/JNEUROSCI.16-06-02027.1996. [DOI] [PMC free article] [PubMed] [Google Scholar]
- Kuhn HG, Winkler J, Kempermann G, Thal LJ, Gage FH. Epidermal growth factor and fibroblast growth factor-2 have different effects on neural progenitors in the adult rat brain. J Neurosci. 1997;17:5820–5829. doi: 10.1523/JNEUROSCI.17-15-05820.1997. [DOI] [PMC free article] [PubMed] [Google Scholar]
- Laakso MP, Vaurio O, Savolainen L, Repo E, Soininen H, Aronen HJ, Tiihonen J. A volumetric MRI study of the hippocampus in type 1 and 2 alcoholism. Behav Brain Res. 2000;109:177–186. doi: 10.1016/s0166-4328(99)00172-2. [DOI] [PubMed] [Google Scholar]
- Liu J, Solway K, Messing RO, Sharp FR. Increased neurogenesis in the dentate gyrus after transient global ischemia in gerbils. J Neurosci. 1998;18:7768–7778. doi: 10.1523/JNEUROSCI.18-19-07768.1998. [DOI] [PMC free article] [PubMed] [Google Scholar]
- Lois C, Alvarez-Buylla A. Proliferating subventricular zone cells in the adult mammalian forebrain can differentiate into neurons and glia. Proc Natl Acad Sci U S A. 1993;90:2074–2077. doi: 10.1073/pnas.90.5.2074. [DOI] [PMC free article] [PubMed] [Google Scholar]
- Lovinger DM. Excitotoxicity and alcohol-related brain damage. Alcohol Clin Exp Res. 1993;17:19–27. doi: 10.1111/j.1530-0277.1993.tb00720.x. [DOI] [PubMed] [Google Scholar]
- Lukoyanov NV, Brandao F, Cadete-Leite A, Madeira MD, Paula-Barbosa MM. Synaptic reorganization in the hippocampal formation of alcohol-fed rats may compensate for functional deficits related to neuronal loss. Alcohol. 2000;20:139–148. doi: 10.1016/s0741-8329(99)00069-5. [DOI] [PubMed] [Google Scholar]
- Majchrowicz E. Induction of physical dependence upon ethanol and the associated behavioral changes in rats. Psychopharmacology. 1975;43:245–254. doi: 10.1007/BF00429258. [DOI] [PubMed] [Google Scholar]
- Marella M, Chabry J. Neurons and astrocytes respond to prion infection by inducing microglia recruitment. J Neurosci. 2004;24:620–627. doi: 10.1523/JNEUROSCI.4303-03.2004. [DOI] [PMC free article] [PubMed] [Google Scholar]
- Ming GL, Song H. Adult neurogenesis in the mammalian central nervous system. Annu Rev Neurosci. 2005;28:223–250. doi: 10.1146/annurev.neuro.28.051804.101459. [DOI] [PubMed] [Google Scholar]
- Minion GE, Slovis CM, Boutiette L. Severe alcohol intoxication: a study of 204 consecutive patients. J Toxicol Clin Toxicol. 1989;27:375–384. doi: 10.3109/15563658909000358. [DOI] [PubMed] [Google Scholar]
- Nixon K. Alcohol and adult neurogenesis: roles in neurodegeneration and recovery in chronic alcoholism. Hippocampus. 2006;16:287–295. doi: 10.1002/hipo.20162. [DOI] [PubMed] [Google Scholar]
- Nixon K, Crews FT. Binge ethanol exposure decreases neurogenesis in adult rat hippocampus. J Neurochem. 2002;83:1087–1093. doi: 10.1046/j.1471-4159.2002.01214.x. [DOI] [PubMed] [Google Scholar]
- Nixon K, Crews FT. Temporally specific burst in cell proliferation increases hippocampal neurogenesis in protracted abstinence from alcohol. J Neurosci. 2004;24:9714–9722. doi: 10.1523/JNEUROSCI.3063-04.2004. [DOI] [PMC free article] [PubMed] [Google Scholar]
- Obernier JA, Bouldin TW, Crews FT. Binge ethanol exposure in adult rats causes necrotic cell death. Alcohol Clin Exp Res. 2002a;26:547–557. [PubMed] [Google Scholar]
- Obernier JA, White AM, Swartzwelder HS, Crews FT. Cognitive deficits and CNS damage after a 4-day binge ethanol exposure in rats. Pharmacol Biochem Behav. 2002b;72:521–532. doi: 10.1016/s0091-3057(02)00715-3. [DOI] [PubMed] [Google Scholar]
- Palmer TD, Takahashi J, Gage FH. The adult rat hippocampus contains primordial neural stem cells. Mol Cell Neurosci. 1997;8:389–404. doi: 10.1006/mcne.1996.0595. [DOI] [PubMed] [Google Scholar]
- Parent JM, Yu TW, Leibowitz RT, Geschwind DH, Sloviter RS, Lowenstein DH. Dentate granule cell neurogenesis is increased by seizures and contributes to aberrant network reorganization in the adult rat hippocampus. J Neurosci. 1997;17:3727–3738. doi: 10.1523/JNEUROSCI.17-10-03727.1997. [DOI] [PMC free article] [PubMed] [Google Scholar]
- Parsons OA. Impaired neuropsychological cognitive functioning in sober alcoholics. In: Hunt WA, Nixon SJ, editors. Alcohol-Induced Brain Damage (NIAAA Research Monograph No. 22) Rockville, MD: National Institutes of Health; 1993. pp. 173–194. [Google Scholar]
- Penland S, Hoplight B, Obernier J, Crews FT. The effects of nicotine on ethanol dependence and brain damage. Alcohol. 2001;24:45–54. doi: 10.1016/s0741-8329(01)00142-2. [DOI] [PubMed] [Google Scholar]
- Popken GJ, Farel PB. Sensory neuron number in neonatal and adult rats estimated by means of stereologic and profile-based methods. J Comp Neurol. 1997;386:8–15. [PubMed] [Google Scholar]
- Raivich G, Bohatschek M, Kloss CU, Werner A, Jones LL, Kreutzberg GW. Neuroglial activation repertoire in the injured brain: graded response, molecular mechanisms and cues to physiological function. Brain Res Brain Res Rev. 1999;30:77–105. doi: 10.1016/s0165-0173(99)00007-7. [DOI] [PubMed] [Google Scholar]
- Rice AC, Khaldi A, Harvey HB, Salman NJ, White F, Fillmore H, Bullock MR. Proliferation and neuronal differentiation of mitotically active cells following traumatic brain injury. Exp Neurol. 2003;183:406–417. doi: 10.1016/s0014-4886(03)00241-3. [DOI] [PubMed] [Google Scholar]
- Riikonen J, Jaatinen P, Rintala J, Porsti I, Karjala K, Hervonen A. Intermittent ethanol exposure increases the number of cerebellar microglia. Alcohol Alcohol. 2002;37:421–426. doi: 10.1093/alcalc/37.5.421. [DOI] [PubMed] [Google Scholar]
- Stephens DN, Ripley TL, Borlikova G, Schubert M, Albrecht D, Hogarth L, Duka T. Repeated ethanol exposure and withdrawal impairs human fear conditioning and depresses long-term potentiation in rat amygdala and hippocampus. Biol Psychiatry. 2005;58:392–400. doi: 10.1016/j.biopsych.2005.04.025. [DOI] [PubMed] [Google Scholar]
- Streit WJ. Microglia in the Pathological Brain. In: Lancaster FE, editor. Alcohol and Glial Cells. Vol. 27. National Institute Alcohol Abuse and Alcoholism; 1994. pp. 55–68. [Google Scholar]
- Sullivan EV, Pfefferbaum A. Neurocircuitry in alcoholism: a substrate of disruption and repair. Psychopharmacology. 2005;180:583–594. doi: 10.1007/s00213-005-2267-6. [DOI] [PubMed] [Google Scholar]
- Sullivan EV, Rosenbloom MJ, Lim KO, Pfefferbaum A. Longitudinal changes in cognition, gait, and balance in abstinent and relapsed alcoholic men: relationships to changes in brain structure. Neuropsychology. 2000a;14:178–188. [PubMed] [Google Scholar]
- Sullivan EV, Rosenbloom MJ, Pfefferbaum A. Pattern of motor and cognitive deficits in detoxified alcoholic men. Alcohol Clin Exp Res. 2000b;24:611–621. [PubMed] [Google Scholar]
- Syapin PJ, Alkana RL. Chronic ethanol exposure increases peripheral-type benzodiazepine receptors in brain. Euro J Pharmacol. 1988;147:101–109. doi: 10.1016/0014-2999(88)90638-3. [DOI] [PubMed] [Google Scholar]
- Urso T, Gavaler JS, Van Thiel DH. Blood ethanol levels in sober alcohol users seen in an emergency room. Life Science. 1981;28:1053–1056. doi: 10.1016/0024-3205(81)90752-9. [DOI] [PubMed] [Google Scholar]
- Vela JM, Yanez A, Gonzalez B, Castellano B. Time course of proliferation and elimination of microglia/macrophages in different neurodegenerative conditions. J Neurotrauma. 2002;19:1503–1520. doi: 10.1089/089771502320914723. [DOI] [PubMed] [Google Scholar]
- Walker DW, Barnes DE, Zornetzer SF, Hunter BE, Kubanis P. Neuronal loss in hippocampus induced by prolonged ethanol consumption in rats. Science. 1980;209:711–713. doi: 10.1126/science.7394532. [DOI] [PubMed] [Google Scholar]
- Warner-Schmidt JL, Duman RS. Hippocampal neurogenesis: opposing effects of stress and antidepressant treatment. Hippocampus. 2006;16:239–249. doi: 10.1002/hipo.20156. [DOI] [PubMed] [Google Scholar]
- Weissman BA, Brandeis R, Gilat E, Cohen G, Alkalay D, Rabinovitz I, Sonego H, Raveh L. Monitoring drug-induced neurodegeneration by imaging of peripheral benzodiazepine receptors. Ann N Y Acad Sci. 2004;1025:584–589. doi: 10.1196/annals.1316.072. [DOI] [PubMed] [Google Scholar]
- Williams AE, Lawson LJ, Perry VH, Fraser H. Characterization of the microglial response in murine scrapie. Neuropathol Appl Neurobiol. 1994;20:47–55. doi: 10.1111/j.1365-2990.1994.tb00956.x. [DOI] [PubMed] [Google Scholar]
- Wirenfeldt M, Babcock AA, Ladeby R, Lambertsen KL, Dagnaes-Hansen F, Leslie RG, Owens T, Finsen B. Reactive microgliosis engages distinct responses by microglial subpopulations after minor central nervous system injury. J Neurosci Res. 2005;82:507–514. doi: 10.1002/jnr.20659. [DOI] [PubMed] [Google Scholar]
- Zou JY, Martinez DB, Neafsey EJ, Collins MA. Binge ethanol-induced brain damage in rats: effects of inhibitors of nitric oxide synthase. Alcohol Clin Exp Res. 1996;20:1406–1411. doi: 10.1111/j.1530-0277.1996.tb01141.x. [DOI] [PubMed] [Google Scholar]