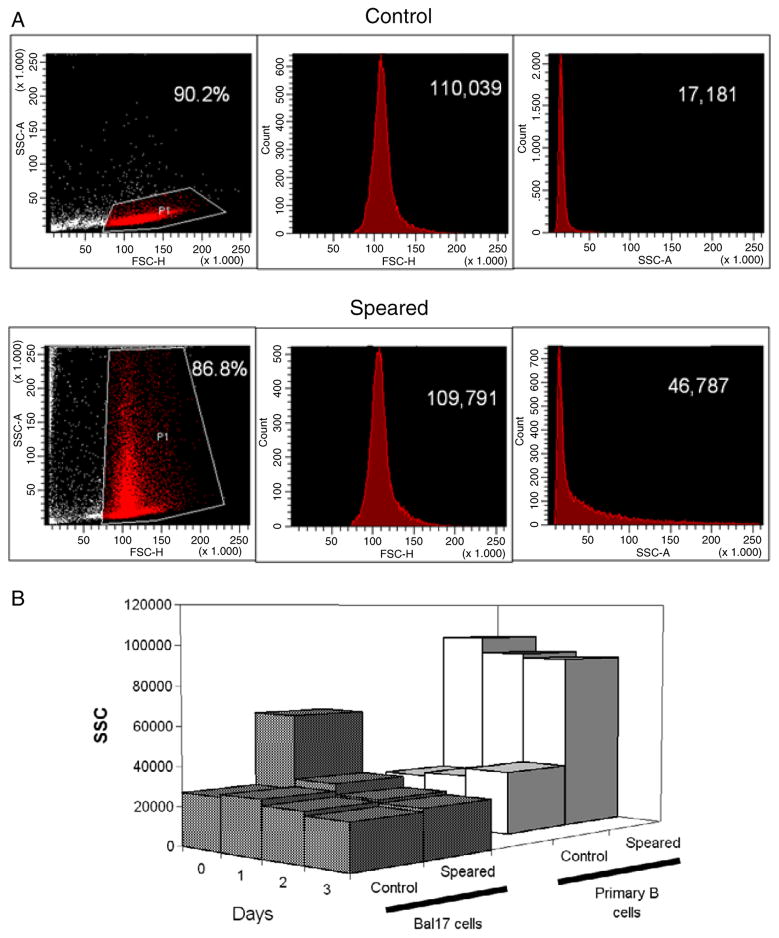
Figure 3.
Flow cytometry of CNT associated cells. (a) Speared primary B cells exhibit enhanced SSC. Scatter plots (left) show the recordings of FSC and SSC from 15 000 cells. The healthy cells were gated (grey (red online)) in the scatter plot and similar percentages in the total control and speared cells were compared. The histograms of FSC (middle) and SSC (right) of the selected populations are shown with the average values. (b) SSC have different transients in CNT associated primary B cells and Bal17 cells over the culture periods. Cells were speared with 0.4 fmol (a) and 1.6 fmol (b) CNTs.

