

Abstract
Neurons subject to degeneration in Alzheimer's disease (AD) exhibit evidence of re-entry into a mitotic cell cycle even before the development of substantial AD brain pathology. In efforts to identify the initiating factors underlying these cell cycle events (CCEs), we have characterized the appearance of the neuronal CCEs in the genomic-based R1.40 transgenic mouse model of AD. Notably, R1.40 mice exhibit neuronal CCEs in a reproducible temporal and spatial pattern that recapitulates the neuronal vulnerability seen in human AD. Neuronal CCEs first appear at 6 months in the frontal cortex layers II/III. This is 6–8 months before detectable amyloid β (Aβ) deposition, suggesting that specific amyloid precursor protein (APP) processing products are responsible for the induction of neuronal CCEs. Furthermore, a reduction in the levels of Aβ (achieved by shifting the genetic background from C57BL/6 to the DBA/2 mouse strain) dramatically delays the appearance of neuronal CCEs. More significantly, elimination of β-secretase activity blocks the appearance of CCEs, providing direct genetic evidence that the amyloidogenic processing of APP is required for the induction of CCEs. Finally, in vitro preparations of oligomeric, but not monomeric, Aβ induce DNA synthesis in dissociated cortical neurons, and this response is blocked by antioligomer specific antibodies. Together, our data suggest that low molecular weight aggregates of Aβ induce neuronal cell cycle re-entry in mouse models of Alzheimer's disease.
Keywords: Alzheimer's disease, APP, β-amyloid, neuronal cell cycle, cyclin A, transgenic mice
Introduction
Accumulating evidence suggests that neuronal cell cycle re-entry is the first step in a process that leads to the observed regional neuronal degeneration observed in Alzheimer's disease (AD). Expression of cell cycle proteins and DNA synthesis is observed in neurons susceptible to death in AD (Arendt et al., 1996; Vincent et al., 1996; Yang et al., 2001). Importantly, cell cycle proteins and hyperploid neurons are seen at much lower levels in age-matched controls and in neuronal populations within the AD brain in which degeneration is not prevalent. Furthermore, immunohistochemical analysis of brain tissue from individuals with mild cognitive impairment, believed by many to be of the clinical predecessor of AD (Petersen, 2000), reveals the presence of cell cycle events (CCEs) in brain regions that undergo substantial degeneration in AD (Yang et al., 2003).
To better understand the pathogenesis of AD, we and others have used mouse models that express transgenes with mutations that cause familial early onset AD in humans (Lamb, 1995; Sturchler-Pierrat et al., 1997; Oddo et al., 2003). Aβ deposition is found in transgenic mouse models of AD, but little neuronal cell loss is encountered. Every model that has been examined, however, shows signs of ectopic neuronal CCEs (Yang et al., 2006). In particular, the genomic-based mouse model, R1.40, expressing the Swedish mutant form of human amyloid precursor protein (APP), on the C57BL/6 inbred genetic background (B6-R1.40), recapitulates neuronal cell cycle re-entry in most of the same neuronal populations that exhibit DNA replication and degeneration in the AD brain. Because the first ectopic cell cycle alterations are observed 6–8 months before the onset of Aβ deposition, these data indicate that deposition is not itself the insult necessary for neuronal cell cycle re-entry.
Recent experimental evidence has indicated that soluble aggregates of Aβ, termed Aβ oligomers, may play a causative role in AD pathogenesis. Oligomeric assemblies of Aβ have been isolated from postmortem AD brains (Gong et al., 2003) as well as young, predepositing transgenic mouse models of AD (Lesné et al., 2006; Oddo et al., 2006; Cheng et al., 2007). These soluble Aβ aggregates have been implicated in the rapid interference of memory of learned behaviors (Cleary et al., 2005). Aβ oligomers can also inhibit long-term potentiation (LTP), in nanomolar concentrations (Walsh et al., 2002), and they exhibit potent toxic effects capable of inducing neuronal cell death in hippocampal slices (Lambert et al., 1998).
Because aberrant neuronal cell cycle re-entry is closely associated with sites of neuronal degeneration in human brain and mouse models of AD, we wanted to explore the involvement of Aβ in the formation of neuronal CCEs. We now provide direct genetic evidence that the onset of neuronal cell cycle alterations is dependent on the amyloidogenic processing of APP. In addition, we provide evidence that in vitro preparations of Aβ oligomers can induce CCEs in primary cortical neurons. Our results suggest that neuronal cell cycle alterations represent a valuable biomarker to determine the effectiveness of therapeutic strategies to reduce or eliminate Aβ production.
Materials and Methods
Mice.
The R1.40 transgene is a full genomic copy of human APP (a 400 kb insert from a yeast artificial chromosome clone) carrying the Swedish (K670M/N671L) mutation associated with early onset familial AD. Creation of the R1.40 transgenic mouse strain and subsequent backcrossing to inbred strains has been described previously (Lamb et al., 1993, 1997; Lehman et al., 2003b). Age- and gender-matched non-transgenic C57BL/6J and DBA2/J animals served as controls in all analyses. Homozygous R1.40 animals maintained on the C57BL/6J genetic background were also crossed to Bace1−/− animals (Cai et al., 2001), also maintained on the C57BL/6J genetic background, to generate F1 R1.40/−;Bace1+/− animals. F1 animals were intercrossed to generate animals homozygous for the R1.40 transgene and homozygous for the Bace1 knock-out allele, as well as Bace1−/− animals lacking the R1.40 transgene. Animals were housed at the Cleveland Clinic Biological Resources Unit, a facility fully accredited by the Association of Assessment and Accreditation of Laboratory Animal Care.
All procedures were approved by the Institutional Animal Care and Use Committee of the Cleveland Clinic.
Immunohistochemistry of tissue.
The rabbit polyclonal cyclin A antibody (ab 7956; Abcam), specific for the C-terminal domain of cyclin A2, was diluted 1:200 in 10% goat serum/PBS containing 0.1% Triton X-100 blocking buffer before use. The mouse monoclonal cyclin D antibody (ab 31450; Abcam) was raised and used as a marker of cell cycle antigens and diluted (1:200). The mouse monoclonal neuronal-specific nuclear protein (NeuN) antibody (dilution, 1:500; Millipore) was used as a neuronal-specific marker.
To perform double fluorescent immunohistochemistry, sections were first rinsed in PBS containing 0.1% Triton X-100 (PBST). Sections were incubated for 1 h at room temperature in 10% goat serum in PBS to block nonspecific binding. All primary antibodies were diluted in PBST and applied overnight at 4°C. After rinsing in PBS, the slides were incubated for 2 h with a secondary antibody, which was conjugated with various fluorescent Alexa dyes (dilution, 1:1000; Invitrogen). The sections were then rinsed in PBS and reincubated in 10% goat serum blocking solution for 1 h, followed by the addition of the second primary antibody (raised in a different species from the first primary antibody) for a second overnight incubation at 4°C. Sections were then rinsed in PBS, and the second secondary antibody, conjugated with a difference fluorescent dye, was applied to sections for 2 h at room temperature. After rinsing, all sections mounted in 4′,6′-diamidino-2-phenylindole dihydrochloride (DAPI) Hardest Reagent (Vector Laboratories) under a glass coverslip.
Histology.
Animals were prepared for histochemical analysis as described previously (Yang et al., 2006). Antibody concentrations used for immunohistochemistry were rabbit anti-cyclin A2 (Abcam) 1:200, mouse anti-cyclin D (Abcam) 1:200, and mouse anti-NeuN (Millipore) 1:500. Secondary antibodies (Invitrogen) were used 1:1000. Tissues were mounted with DAPI Hardest Reagent (Vector Laboratories) under a glass coverslip. Fluorescent in situ hybridization was performed as described previously (Yang et al., 2006) using a mouse-specific DNA probe [480C6, from the RPCI-22/bacterial artificial chromosome (BAC) library] containing 150 kb of genomic sequence from the region that encodes the endogenous Sim2 gene located on mouse chromosome 16 (Kulnane et al., 2002).
Neuronal cell counts.
For each of the genotypes, we examined five animals at each age. For each animal, a total of five evenly spaced sections containing the frontal cortex were double stained for the neuronal marker NeuN and cyclin A or cyclin D. The area located between 2.5 mm and 3.4 mm anterior to the bregma was identified in each section analyzed. We scored NeuN-positive cells within cortical layers II/III or V/VI for the presence or absence of the cell cycle marker. Only cells with a discernable portion of their nucleus in the section were scored. For each of the five sections, the percentage of NeuN+ cells exhibiting immunoreactivity for the cell cycle marker was tabulated, and the percentages for the five sections analyzed in each animal were averaged. For each age and genotype, the percentages were then averaged over all five animals and expressed as mean ± SEM. Adjacent sections that had undergone processing for fluorescent in situ hybridization (FISH) were tabulated in similar manner where neurons were scored for the presence or absence of 3 or 4 spots of hybridization. All counts were performed in a blinded manner, and data were analyzed with the Student's t test (GraphPad Prism).
Western blot of tissue homogenates.
Analysis of the steady-state levels of holo-APP and APP C-terminal fragments (CTFs) were performed on brain extracts from 28-d-old B6-R1.40 animals and B6-R1.40;Bace1−/− animals). Mice were killed by cervical dislocation, and their brains were removed, divided sagittally (after removing cerebellum), and snap frozen. Tissues were homogenized in 10 volumes of Tris-buffered saline (50 mm Tris; pH 7.4, 150 mm NaCl, 1 mm EDTA) with freshly added 1 mm PMSF and protease and phosphatase inhibitor mixture (Sigma-Aldrich). Total brain homogenates were subsequently centrifuged to remove nuclei and cell debris at 1000 g for 15 min. These postnuclear supernatants were carefully removed and saved in aliquots. Protein estimation was performed using Pierce BCA protein estimation kit. Equal amounts of protein (50 μg per lane) were added to the gel. Immunoblotting was performed using Novex NuPage, 4–12% Bis-Tris gel (Invitrogen). The blots were incubated with antibody 0443 (Calbiochem) against the C terminus of APP.
In vitro preparation of Aβ1–42 monomers and Aβ1–42 oligomers. The preparation of synthetic Αβ1–42 monomers and Aβ1–42 oligomers followed established protocols (Stine et al., 2003). Briefly, hexafluoro-2-propanol-treated lyophilized Aβ1–42 peptide was carefully and completely resuspended to 5 mm in anhydrous dimethyl sulfoxide (D2650; catalog number D-2650; Sigma-Aldrich) by pipette mixing followed by brief sonication. The recombinant Aβ1–42 peptide was diluted to 100 μm in ice-cold cell culture medium (phenol red-free Ham's F12; Caisson Laboratories) immediately before the treatment for monomer preparations or incubated at 37°C for 24 h to obtain Aβ1–42 oligomer preparations. Western blot analysis were performed according to the standard protocols as described previously (Stine et al., 2003) using monoclonal antibodies against Aβ oligomers (NU1 and NU2) (Lambert et al., 2007) or human Aβ (6E10; Covance Research Products).
Primary cortical cultures and Aβ1–42 treatments.
Cortical neurons from embryonic day 16.5 C57BL/6 mouse embryos were isolated by standard procedures as reported previously (Cicero and Herrup, 2005). All cultures were grown for a minimum of 7 d in vitro before any treatment. To assess the effect of monomeric and oligomeric Aβ1–42 on induction of neuronal cell cycle re-entry, the Aβ monomers, Aβ oligomers, or Ham's F12 vehicle were serially diluted in new Neurobasal media containing 10 μm bromodeoxyuridine (BrdU) and cells treated for 24 h. To immunoneutralize the oligomers from the synthetic preparations of Aβ, oligomer-specific antibody NU2 antibody was added to the neuronal cultures at a final concentration of 100 nm, 30 min before exposure to 100 nm of the oligomeric Aβ preparations (De Felice et al., 2008). As a control, 100 nm of nonspecific mouse IgG (Sigma-Aldrich) was exposed to the cultures in an identical manner. The treatments were performed on a minimum of three litters.
Immunocytochemistry of cells.
For BrdU visualization on neuronal cultures, cells were treated with 2N HCl for 30 min at 37°C, neutralized in 0.1 m sodium borate, pH 8.6, for 10 min and washed five times in PBS. Cells were blocked with 5% normal goat serum in PBS with 0.4% Triton X-100 for 1 h at room temperature, incubated overnight at 4°C with primary antibodies (in blocking buffer), including a mouse monoclonal antibody against microtubule associated protein 2 (Map2; 1:1000; Sigma-Aldrich), and a rat monoclonal antibody against BrdU (1:1000; Abcam).
After PBS washes, cells were incubated with secondary antibodies (1:1000; Invitrogen) for 1 h at room temperature. Cells were washed with PBS and coversliped with hard-set mounting media containing DAPI (Vector Laboratories).
Quantification of cells positive for Map2 and BrdU.
The number of cells positive for BrdU only, Map2 only, or positive for both were quantified by scoring five random fields per treatment per each concentration in a blinded manner. By assigning total number of Map2-positive cells per treatment as 100%, the percentage of the total number of Map2-positive and BrdU-positive cells were calculated and normalized and expressed as mean ± SEM (n = 3). Data were analyzed using the unpaired t test (GraphPad Prism).
Results
We examined the levels of cell cycle proteins in brain sections of adult B6-R1.40 transgenic mice at a variety of ages by immunohistochemistry. FISH was used to detect DNA replication. Consistent with our previous studies, 6-month-old R1.40 transgenic mice exhibited CCEs in a large population of neurons in layers II/III of frontal cortex. These cells were identified by coimmunostaining with the neuronal marker NeuN and cyclin A (Fig. 1D–F), as well as additional cell cycle proteins including cyclin D and proliferating cell nuclear antigen (data not shown). This ectopic cell cycle protein expression is accompanied by evidence of DNA replication as indicated by three or four FISH signals within a subset of these neuronal nuclei (Fig. 1F, inset). Significantly, no evidence of cyclin A re-expression or DNA replication was observed either in the brains of 4-month-old R1.40 transgenic mice (Fig. 1A–C, inset) or in the brains of 6-month-old non-transgenic control mice (Fig. 1G–I, inset). Together, these data indicate that the onset of the neuronal CCEs in cortical layers II/III in the R1.40 transgenic mice is rapid and nearly synchronous, as all of the animals aged to 4 months displayed no evidence of CCEs, whereas all of the 6-month-old animals displayed a robust activation of the cell cycle. The layer II/III neurons of the frontal cortex are the first population of cells that exhibit CCEs in the B6-R1.40 transgenic mouse model of AD.
Figure 1.

Appearance of cell cycle proteins and DNA synthesis in frontal cortical layers II/III in B6-R1.40 mice at 6 months. A–C, No evidence of cyclin A (A, green) immunoreactivity was apparent in NeuN-positive cells (B, red) in transgenic mice aged to 4 months (C, merge). At this age, neurons residing in frontal cortical layer II/III exhibit only 2 spots of hybridization (C, inset). D, E, Immunohistochemical profiles encountered at 6 months in B6-R1.40 animals reveal that cyclin A (D, green) is expressed in neurons (E, red). F, Overlaying the images reveals colocalization of both cyclin A and NeuN. FISH indicates that neuronal re-expression of cyclin A is accompanied by DNA synthesis as evidenced by three or four spots of hybridization (inset). G–I, There was no cyclin A (G, green) found in comparable neuronal populations (H, red) in age-matched non-transgenic controls. Nuclei were counterstained with DAPI (blue) throughout. The arrows indicate examples of cell cycle-positive neurons. Scale bar, 10 μm.
Though synchronous in any one neuronal cell population, there was nonetheless a pattern to the appearance of CCEs across different brain regions. We analyzed brain sections from B6-R1.40 animals at both 10 and 12 months with both immunohistochemistry and FISH. B6-R1.40 transgenic mice aged to 12 months had nearly identical densities of neuronal CCEs in cortical layers II/III as was observed in 6 month specimens (data not shown). In addition, in 12-month-old brains, neuronal CCEs had progressed to include cortical layers V/VI as evidenced by coimmunostaining for NeuN and cyclin D (Fig. 2D–F) and cyclin A (data not shown). As elsewhere, this was accompanied by evidence for DNA replication as assessed by FISH (Fig. 2F, inset). Neither 10-month-old B6-R1.40 animals (Fig. 2A–C, inset) nor 12-month-old non-transgenic controls (Fig. 2G–I, inset) exhibited either immunocytochemical or cytogenetic (FISH) evidence for CCEs in the same layer V/VI cells. This emphasizes the finding that within any one cell type the appearance of CCEs is rapid and nearly synchronous.
Figure 2.

Expression of cell cycle proteins in frontal cortical layer V/VI in B6-R1.40 at 12 months. A–C, There was no evidence of cyclin D (A, green) observed in NeuN-positive cells (B, red) in 10-month-old B6-R1.40 animals (C, merge). At this age, neurons residing in frontal cortical layer II/III exhibit only two spots of hybridization (C, inset). D–F, Cyclin D (D, green) immunoreactivity was encountered in neurons (E, red) in R1.40 mice aged to 12 months. Overlaying the images reveals colocalization of both cyclin D and NeuN (F). FISH indicates that neuronal re-expression of cyclin D is accompanied by DNA synthesis as evidenced by four spots of hybridization (inset). G–I, No evidence of cyclin D (G, green) was observed in NeuN+ cells (H, red) in age-matched non-transgenic controls. Cell nuclei were counterstained with DAPI (blue) throughout. For each age and genotype, a total of five animals were analyzed. Scale bar, 10 μm.
We performed a quantitative analysis of cyclin A immunoreactivity and FISH signals to determine whether the percentages of neurons exhibiting CCEs in different brain regions remained constant or increased as the transgenic animals aged (and presumably the disease progressed). We quantified CCEs in frontal cortical layers II/III and V/VI separately, as these nerve cell populations exhibit distinct, temporal patterns of CCEs. As shown in Figure 1, many neurons in layers II/III of the frontal cortex show evidence of cell cycle re-entry at 6 months. Quantitative analysis revealed that ∼44% of the neurons (NeuN-positive cells) within these layers are positive for cyclin A (Fig. 3A). This result was consistent across all test markers. Thus, ∼45% of NeuN-positive cells within cortical layers II/III were also positive for cyclin D (Fig. 3B). In contrast <1% of the neurons exhibited evidence of cyclin A and D expression in cortical layers V/VI at 6 months. Age-matched non-transgenic controls had 0.5% and 1.7% of cyclin A and D immunoreactive neurons, respectively, in cortical layers II/III (Fig. 3A,B).
Figure 3.
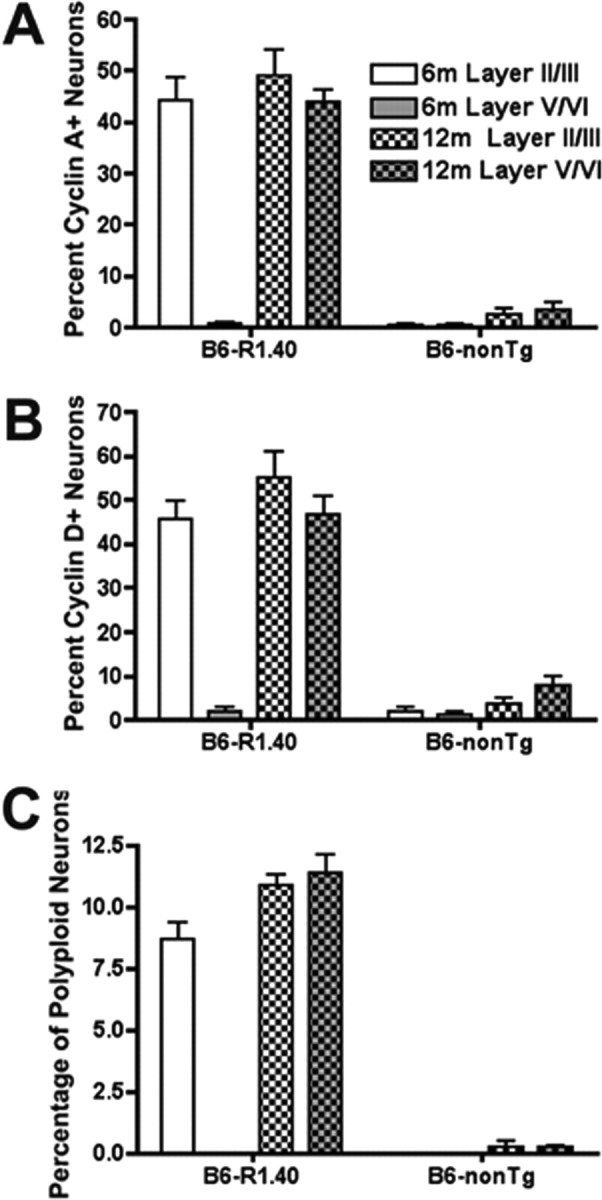
Quantification of neuronal cell cycle activity within cortical layers. Percentages of neurons exhibiting immunoreactivity for cell cycle re-entry were tabulated in both male and female B6-R1.40 transgenic and non-transgenic mice aged 6–12 months. A–C, Cell cycle re-entry was tabulated by scoring cyclin A (A) and cyclin D (B) immunoreactive neurons and polyploid neurons (C) in the frontal cortex.
To quantify the number of cells undergoing DNA replication within the same brains, we performed FISH and tabulated the percentages of neurons exhibiting three or four spots of hybridization. For these experiments, we used a 150 kb BAC-carrying genomic sequence from mouse chromosome 16 and determined the spots of hybridization within neuronal nuclei. Our analysis revealed that by 6 months, ∼9% of the neurons in cortical layers II/III had three or more spots of hybridization in the B6-R1.40 mice. Similar to the results from the cyclin A and D immunohistochemistry counts, <1% of neurons exhibit three of four spots of hybridization in non-transgenic controls at the same age (Fig. 3C).
We were surprised to find that the disease progresses with time between regions but not within them. The percentages of cyclin A and cyclin D immunoreactive neurons in layers II/III at 12 months remained unchanged when compared with 6 months in the R1.40 transgenic mice. Quantitative analysis of DNA replication with FISH revealed that, similar to the data obtained via immunohistochemistry, the number of neurons exhibiting three or four spots of hybridization did not change between 6 and 12 months in cortical layers II/III. (Fig. 3A,B). At 12 months, nearly 45% of neurons in layers V/VI now exhibited cyclin A or cyclin D immunostaining compared with <1% at 6 months (Fig. 3A,B). Non-transgenic controls, exhibited <8% cyclin A and D immunoreactive neurons at the same age. (Fig. 3A,B). Furthermore, although 6-month-old animals exhibited <1% of cells with increased FISH signal in cortical layers V/VI, this number increased to 11% by the age of 12 months. Non-transgenic controls at this age exhibited <1% of cells with increased FISH signal (Fig. 3C). Together, these data suggest that within the specific neuronal populations impacted, CCEs occur rapidly and within a large percentage of cells that is stable over a prolonged period of time.
Our studies indicate that neuronal CCEs are first evident at 6 months in cortical layers II/III and subsequently spread into cortical layers V/VI by 12 months. Thus, cortical CCEs appear ∼8 months before the onset of fibrillar Αβ deposition in the B6-R1.40 model. This suggests that fibrillar Aβ deposits are not responsible for the induction of neuronal CCEs and instead implicates either unique soluble Αβ species or particular APP processing products generated in the R1.40 transgenic mouse.
To further examine the APP products(s) responsible for the induction of CCEs, we examined R1.40 mice in which the transgene had been transferred by repeated backcrossing to the DBA/2J mouse strain. D2-R1.40 APP transgenic mice exhibit similar expression levels of both holo-APP and APP CTFs to that observed in B6-R1.40 mice. However, the steady state levels of transgene-derived Aβ are substantially reduced in the D2-R1.40 mice when compared with the B6-R1.40 mice (9.7 vs 12.3 pmol/g for Aβ1–40 and 4.0 vs 4.9 pmol/g for Aβ1–42). The result is a lack of Aβ deposition in the D2-R1.40 mouse model, even as late as 24 months, whereas B6-R1.40 mice exhibit Aβ deposition at ∼12–14 months (Lehman et al., 2003b).
Unlike the B6-R1.40 strain, we found no evidence for neuronal CCEs in any brain region at either 6 (data not shown) or 10 months (Fig. 4A–C) in the D2-R1.40 mouse strain. By 12 months, however, D2-R1.40 transgenic mice develop neuronal CCEs in cortical layers II/III but not cortical layers V/VI as evidenced by immunohistochemistry for cyclin A (Fig. 4D–F) and cyclin D as well as FISH (data not shown). As in the C57BL/6 strain, non-transgenic controls at the same ages did not exhibit any evidence of neuronal CCEs (Fig. 4G–I). Thus, even APP transgenic mouse models that do not develop fibrillar Aβ deposits across their entire lifespan still develop neuronal CCEs in an anatomically appropriate manner. These studies demonstrate that genetic reduction in steady state levels of Αβ delays the appearance of neuronal CCEs in all brain regions in the D2-R1.40 mouse model.
Figure 4.

Neuronal expression of cell cycle protein is delayed in D2-R1.40 animals. A–C, No evidence of cyclin A (green) immunoreactivity was apparent in NeuN-positive cells (red) in transgenic mice aged to 10 months. D–F, Cyclin A (D, green) was expressed in neurons (E, red) in 12-month-old D2-R1.40 animals. Overlaying the images reveals colocalization of both cyclin D and NeuN (F). G–I, There was no cyclin A found in comparable neuronal populations in age-matched non-transgenic control. Nuclei were counterstained with DAPI (blue throughout). The arrows indicate examples of cell cycle-positive neurons. Scale bar, 10 μm.
The delay in neuronal CCEs in the D2-R1.40 mice implicates Αβ as the causative factor in the induction of CCEs. To specifically test whether Αβ generation was necessary for the onset of CCEs, we generated B6-R1.40 animals that were also homozygous for a null allele in the β-secretase 1 (Bace1) gene. B6-R1.40 transgenic mice maintained on a Bace1−/− background fail to exhibit evidence of CTFβ or Αβ production (Cai et al., 2001; Luo et al., 2001; Roberds et al., 2001), with corresponding increases in CTFα and full-length APP (Fig. 5A) and no significant changes in the levels of the APP intracellular domain.
Figure 5.
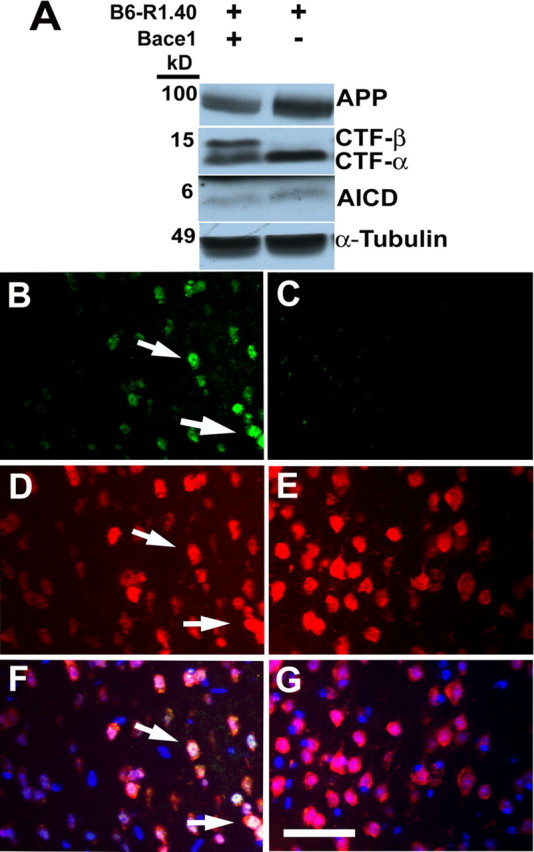
B6-R1.40;Bace1−/− animals do not display neuronal cell cycle re-entry at 6 months in frontal cortical layer II/III. A, Whole brain protein extracts were prepared from B6-R1.40 and B6-R1.40;Bace1−/− animals. Western blotting was performed using a C-terminal antibody. B, D, Cyclin A (green; B) is expressed in neurons (red; D) in 6-month-old B6-R1.40 animals. Overlaying the images reveals colocalization of both cyclin A and NeuN (F). E, Neurons (red; E) in 6-month-old B6-R1.40;Bace1−/− animals do not exhibit re-expression of cyclin A (green; C). Nuclei were counterstained with DAPI (blue throughout). The arrows indicate examples of cell cycle-positive neurons. Scale bar, 10 μm.
Although B6-R1.40 mice exhibit neuronal CCEs in cortical layers II/II at 6 months (Fig. 5B,D,F), age-matched Bace1−/− (data not shown) and B6-R1.40;Bace1−/− animals exhibit no evidence of neuronal CCEs in any brain region, including neurons residing in the frontal cortical layers II/III (Fig. 5C,E,G). Together with the delay in neuronal CCEs observed in the D2-R1.40 mice, these results suggest that the production of the Aβ peptide itself, or a soluble Aβ aggregate, is responsible for the induction of neuronal CCEs.
To further test this hypothesis, we examined whether synthetic preparations of monomeric or oligomeric Αβ were sufficient to drive primary cortical neurons in culture into an aberrant cell cycle. Human Aβ1–42 peptides were treated by established protocols to generate both monomeric and oligomeric Aβ (Stine et al., 2003). Western blot analysis with antibody 6E10 revealed the predominance of Αβ monomers and low molecular weight oligomers (trimers and tetramers) in the monomeric preparations, whereas the oligomeric preparations also contained Aβ monomers and low molecular weight oligomers in addition to higher molecular weight oligomers ranging in size from 25 to 98 kDa (supplemental Fig. 1, available at www.jneurosci.org as supplemental material). The higher molecular weight oligomers were also recognized by oligomer-specific antibodies NU1 and NU2 (data not shown).
To determine whether soluble Aβ species are capable of inducing neuronal CCEs, we treated primary cortical neurons with varying concentrations of either monomeric or oligomeric preparations of Aβ as well as vehicle in the presence of BrdU for 24 h. The cultures were then fixed and coimmunostained with antibodies to Map2 and BrdU. Exposure of neurons to increasing concentrations of oligomeric Aβ led Map2-immunoreactive neurons (green) to enter a cell cycle and incorporate BrdU (Fig. 6G–I, red). In contrast, Map2-positive neurons do not incorporate BrdU when exposed to monomeric Aβ (Fig. 6D–F) or vehicle (Fig. 6A–C). We observed a basal level (5.7 ± 1%) of Map2-positive cells displaying BrdU incorporation in vehicle-treated groups (Fig. 6J,K). During treatment with different concentrations of Aβ monomers, there was no statistically significant alteration in the percentage of BrdU-positive cells (Fig. 6J). However, upon exposure of neurons to the Aβ oligomeric preparations, we observed a two- to five-fold increase in the number of BrdU-positive neurons compared with the vehicle control (Fig. 6K). Importantly, the effect of Aβ oligomers was observed at concentrations as low as 50 nm, which resulted in a two-fold increase (5 vs 10%) in the Map2-positive neurons that displayed BrdU incorporation.
Figure 6.
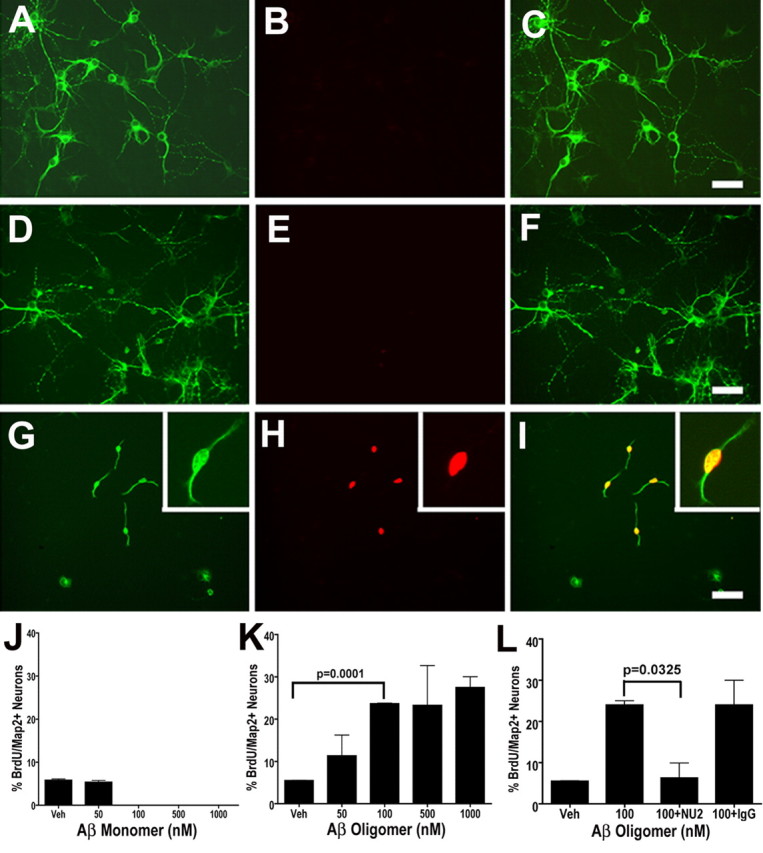
Aβ oligomers induce neuronal BrdU incorporation in cortical neurons in vitro. A–I, Cultured cortical neurons were treated with Ham's F12 vehicle (Veh) (A–C), 1000 nm of Aβ1–42 monomer-rich preparations (D–F), or 1000 nm Aβ1–42 oligomer-rich preparations (G–I) in the presence of BrdU for 24 h. Cells were fixed and coimmunostained with antibodies against Map2 (A, D, G) and BrdU (B, E, H), demonstrating the induction of BrdU incorporation in Map2-positive cells in the oligomer-rich preparations but not the monomer-rich or vehicle control (C, F, I, merged images). Scale bars, 10 μm. G–I, Insets, Higher magnification of the BrdU-positive, Map2-positive cell in the oligomer-rich treatment group. J, K, Quantification of the percentage of BrdU-positive/Map2-positive cells in Aβ monomer-rich and oligomer-rich preparations. Cortical neurons were exposed to either vehicle or increasing concentrations (50–1000 nm) of either monomer-rich (J) or oligomer-rich (K) preparations for 24 h. Treatment with oligomer-rich preparations at concentrations >100 nm resulted in a statistically significant increase in the percentage of BrdU-positive cells (p = 0.0001). L, Immunoneutralization of Aβ oligomers with the addition of the Aβ oligomer-specific antibody NU2 (100 nm) resulted in a five-fold reduction in BrdU incorporation (n = 3; p = 0.0325) in the neuronal cultures exposed to 100 nm of Aβ oligomer-rich preparations, to levels similar to the vehicle control (the same 100 nm control was used for experiments in K and L). At the same concentration, addition of nonspecific mouse IgG did not have a statistically significant effect on BrdU incorporation (L).
Finally, to demonstrate that the effect of the synthetic Aβ oligomer preparations was attributable to the presence of specific oligomeric Aβ assemblies, we performed the same neuronal cell culture experiments in the presence of the NU2 monoclonal antibody, which was previously demonstrated to bind to Aβ oligomers and inhibit other downstream consequences of Aβ oligomer exposure to neurons (Lambert et al., 2007). Preincubation of the NU2 antibody with the 100 nm preparations of Aβ oligomers resulted in five-fold reduction in the percentage of Map2-positive cells incorporating BrdU, whereas preincubation with a nonspecific mouse Ig had no discernible effect (Fig. 6L). In summary, our in vitro data demonstrate that Aβ oligomers are sufficient to induce cell cycle re-entry in neurons.
Discussion
The findings presented here offer substantial insights into the onset and progression of cell cycle events in postmitotic neurons in the R1.40 mouse model of AD and by extension into the disease pathogenesis underlying AD. In human AD, neuronal CCEs are observed in neurons subject to neurodegeneration in patients early in the disease process as indicated by their presence in patients with mild cognitive impairment, coupled with their virtual absence in nondemented individuals and in brain regions where there is no neuronal cell loss (Busser et al., 1998; Yang et al., 2001, 2003). These and other data argue that neuronal CCEs represent an early marker of neuronal distress and disease pathogenesis. This is consistent with other evidence suggesting the re-entrance of neurons into the cell cycle is associated with neurodegeneration (al-Ubaidi et al., 1992; Klein et al., 2002; Kuan et al., 2004). We have taken advantage of our ability to do longitudinal studies in a genetically reproducible system by quantifying the CCEs in the R1.40 brain at multiple ages as well as genetic and biochemical perturbations designed to identify the mechanism behind the initiation of the CCEs.
Our data document that CCEs do not develop within all disease-relevant neuronal populations at once. Rather, specific neuronal populations initiate CCEs during a relatively short period of time (i.e., 2 months or less) but in a precise sequence. Once initiated, these events are subsequently stable for at least 6 months within the same neuronal populations. For example, CCEs appear within a relatively large percentage of the neurons in frontal cortex layers II/III at 6 months, and we previously reported that neuronal CCEs are observed within two subcortical populations, the locus ceruleus and dorsal raphe, by 8 months (Yang et al., 2006). This is followed by the induction of CCEs in neurons of frontal cortical layers V/VI at 12 months. Between 6 and 12 months, however, CCEs remains constant in layers II/III. This bears striking but unexpected analogy to the findings in the Atm−/− (Yang and Herrup, 2005) and E2f1−/− (Wang et al., 2007) mouse brain. In both mutants, CCEs also appear synchronously. Closely spaced time points suggest the transition from normal to CCE-positive takes approximately a week. Our qualitative impression is that in the R1.40 event is more spread out, but we could imagine that the process is equally rapid in this AD model. The nature of the signal that triggers this transition thus becomes a question of utmost importance.
Neuronal CCEs are first observed ∼6 to 8 months before fibrillar Aβ deposition in the R1.40 transgenic mouse model of AD. In addition, neuronal CCEs are also observed in the locus ceruleus and dorsal raphe at 8 months in the R1.40 mice, two brain regions in which no Aβ deposition is observed even at late ages. Interestingly, the locus ceruleus and dorsal raphe exhibit evidence of CCEs and are subject to substantial degeneration within the AD brain, although there is limited AD-like pathology in these subcortical brain regions (Braak and Braak, 1997). Together, these results suggest that (1) the CCEs present in the R1.40 mouse model of AD provide an accurate read of the neuronal vulnerability observed in human AD that is likely reflective of the precise temporal regulation of the mutant human APP transgene and (2) that fibrillar Aβ is unlikely to be the triggering event responsible for neuronal CCEs. In addition, given that neuronal CCEs are not observed in age-matched, non-transgenic mice, this suggests that accumulation of either APP or its breakdown products (e.g., Aβ) is likely responsible for the induction of CCEs. This present study provides evidence that oligomeric Aβ species are both necessary and sufficient for the induction of neuronal CCEs.
Genetic experiments using D2-R1.40 transgenic mice demonstrated that a reduction in steady state levels of Aβ, without significant alterations in holo-APP or APP CTFs, results in a 6 month delay in neuronal CCEs. When compared with B6-R1.40 animals, D2-R1.40 animals exhibit lower levels of Aβ1–40 and Aβ1–42 and do not develop Aβ deposits throughout the lifetime of the animal. The biochemical differences are apparent as early as 28 d suggesting that altered APP processing and Aβ metabolism in young animals may have implications for later development of AD-like neuropathologies. Interestingly, CCEs first appear at 12 months in the D2-R1.40 mice in cortical layers II/III, suggesting that although delayed, the anatomical pattern and temporal progression of the CCEs is maintained. To more directly implicate Aβ production in the induction of neuronal CCEs, we examined B6-R1.40 mice lacking the primary β-secretase, Bace1. In B6-R1.40;Bace1−/− mice neuronal CCEs were completely blocked at 6 months, directly implicating the amyloidogenic processing of APP in the induction of CCEs. Together, this genetic data directly implicates the production of Aβ or its derivatives in initiating neuronal CCEs.
To determine the role of soluble Aβ species on the induction of neuronal CCEs, we performed in vitro studies on primary cortical neurons. Significantly, primary cortical neurons exposed to in vitro preparations of Αβ οligomers, but not monomers, resulted in substantial incorporation of BrdU. The concentrations of Αβ oligomers sufficient to induce CCEs (50–1000 nm) were similar to other studies examining the neurotoxicity of oligomers that are capable of inhibiting LTP in vivo (Walsh et al., 2002) and in hippocampal slices (Wang et al., 2002) decrease spine density (Lacor et al., 2007) and impair memory in animal models of AD independently of Aβ deposition and neuronal cell loss (Lesné et al., 2006). In addition, although previous studies from our group implicated Aβ fibrils in neuronal cell cycle alterations, this was observed at concentrations of 1 μm (Αβ25–35) after incubation for upward of 72 h (instead of 24 h in the present study) (Wu et al., 2000).
The studies leave unanswered the question of why discrete neuronal populations are impacted differently with age in the R1.40 mouse model and in AD. This could be attributable to (1) altered production of Αβ within specific brains regions, (2) altered generation of specific Aβ oligomers within these neuronal populations and/or (3) age-related alterations in neuronal selectivity to these insults. Previous data from our laboratory demonstrated that total levels of brain Αβ remain unchanged at the ages examined for neuronal CCEs in both the B6-R1.40 and D2-R1.40 mouse models and that the highest steady state levels of Aβ are in the cerebellum, hippocampus, and olfactory bulb (Lehman et al., 2003a). In addition, cell cycle events are not encountered within the purkinje and granule cells in the cerebellum as late as 22 months in B6-R1.40 animals (Yang et al., 2006). Together, these data suggest that the occurrence of neuronal CCEs is unlikely to be attributable to simply higher levels of Aβ peptides, per se. Nevertheless, these studies clearly implicate the production of Aβ in the induction of neuronal CCEs and demonstrate that Aβ oligomers are capable of inducing CCEs, a finding that suggests CCEs represent an early and disease-relevant marker of disease progression.
Our future studies will be focused on identifying which species of Aβ oligomers are sufficient to induce neuronal CCEs in vitro and whether they exert their mitogenic effects through any of the pathways thus far identified underlying Aβ oligomer-based neurotoxicity, such as interactions with NMDA receptors (De Felice et al., 2007), insulin signaling (Zhao et al., 2008), as well as calcium dysregulation (Nimmrich et al., 2008). In addition, it will be critical to determine whether neuronal CCEs represent an upstream or downstream consequence of Aβ oligomer exposure. Finally, the identification and characterization of additional biochemical, morphological, and physiological alterations will be required at the ages when neuronal CCEs first become evident in vivo.
Footnotes
This work was supported by National Institutes of Health Grants AG026146 (S.W.P.), AG023012 (B.T.L.), and AG024494 (K.H., B.T.L.); the Alzheimer's Association (B.T.L.); and an anonymous foundation. We thank R. Yan (Cleveland Clinic, Cleveland, OH) for Bace1−/− mice; G. Xu and N. Maphis for technical support; and W. L. Kline and M. P Lambert (Northwestern University, Evanston, IL) for providing NU1 and NU2 antibodies.
References
- al-Ubaidi MR, Hollyfield JG, Overbeek PA, Baehr W. Photoreceptor degeneration induced by the expression of simian virus 40 large tumor antigen in the retina of transgenic mice. Proc Natl Acad Sci U S A. 1992;89:1194–1198. doi: 10.1073/pnas.89.4.1194. [DOI] [PMC free article] [PubMed] [Google Scholar]
- Arendt T, Rödel L, Gärtner U, Holzer M. Expression of the cyclin-dependent kinase inhibitor p16 in Alzheimer's disease. Neuroreport. 1996;7:3047–3049. doi: 10.1097/00001756-199611250-00050. [DOI] [PubMed] [Google Scholar]
- Braak H, Braak E. Frequency of stages of Alzheimer-related lesions in different age categories. Neurobiol Aging. 1997;18:351–357. doi: 10.1016/s0197-4580(97)00056-0. [DOI] [PubMed] [Google Scholar]
- Busser J, Geldmacher DS, Herrup K. Ectopic cell cycle proteins predict the sites of neuronal cell death in Alzheimer's disease brain. J Neurosci. 1998;18:2801–2807. doi: 10.1523/JNEUROSCI.18-08-02801.1998. [DOI] [PMC free article] [PubMed] [Google Scholar]
- Cai H, Wang Y, McCarthy D, Wen H, Borchelt DR, Price DL, Wong PC. BACE1 is the major beta-secretase for generation of Abeta peptides by neurons. Nat Neurosci. 2001;4:233–234. doi: 10.1038/85064. [DOI] [PubMed] [Google Scholar]
- Cheng IH, Scearce-Levie K, Legleiter J, Palop JJ, Gerstein H, Bien-Ly N, Puoliväli J, Lesné S, Ashe KH, Muchowski PJ, Mucke L. Accelerating amyloid-beta fibrillization reduces oligomer levels and functional deficits in Alzheimer disease mouse models. J Biol Chem. 2007;282:23818–23828. doi: 10.1074/jbc.M701078200. [DOI] [PubMed] [Google Scholar]
- Cicero S, Herrup K. Cyclin-dependent kinase 5 is essential for neuronal cell cycle arrest and differentiation. J Neurosci. 2005;25:9658–9668. doi: 10.1523/JNEUROSCI.1773-05.2005. [DOI] [PMC free article] [PubMed] [Google Scholar]
- Cleary JP, Walsh DM, Hofmeister JJ, Shankar GM, Kuskowski MA, Selkoe DJ, Ashe KH. Natural oligomers of the amyloid-beta protein specifically disrupt cognitive function. Nat Neurosci. 2005;8:79–84. doi: 10.1038/nn1372. [DOI] [PubMed] [Google Scholar]
- De Felice FG, Velasco PT, Lambert MP, Viola K, Fernandez SJ, Ferreira ST, Klein WL. Abeta oligomers induce neuronal oxidative stress through an N-methyl-D-aspartate receptor-dependent mechanism that is blocked by the Alzheimer drug memantine. J Biol Chem. 2007;282:11590–11601. doi: 10.1074/jbc.M607483200. [DOI] [PubMed] [Google Scholar]
- De Felice FG, Wu D, Lambert MP, Fernandez SJ, Velasco PT, Lacor PN, Bigio EH, Jerecic J, Acton PJ, Shughrue PJ, Chen-Dodson E, Kinney GG, Klein WL. Alzheimer's disease-type neuronal tau hyperphosphorylation induced by Abeta oligomers. Neurobiol Aging. 2008;29:1334–1347. doi: 10.1016/j.neurobiolaging.2007.02.029. [DOI] [PMC free article] [PubMed] [Google Scholar]
- Gong Y, Chang L, Viola KL, Lacor PN, Lambert MP, Finch CE, Krafft GA, Klein WL. Alzheimer's disease-affected brain: presence of oligomeric A beta ligands (ADDLs) suggests a molecular basis for reversible memory loss. Proc Natl Acad Sci U S A. 2003;100:10417–10422. doi: 10.1073/pnas.1834302100. [DOI] [PMC free article] [PubMed] [Google Scholar]
- Klein JA, Longo-Guess CM, Rossmann MP, Seburn KL, Hurd RE, Frankel WN, Bronson RT, Ackerman SL. The harlequin mouse mutation downregulates apoptosis-inducing factor. Nature. 2002;419:367–374. doi: 10.1038/nature01034. [DOI] [PubMed] [Google Scholar]
- Kuan CY, Schloemer AJ, Lu A, Burns KA, Weng WL, Williams MT, Strauss KI, Vorhees CV, Flavell RA, Davis RJ, Sharp FR, Rakic P. Hypoxia-ischemia induces DNA synthesis without cell proliferation in dying neurons in adult rodent brain. J Neurosci. 2004;24:10763–10772. doi: 10.1523/JNEUROSCI.3883-04.2004. [DOI] [PMC free article] [PubMed] [Google Scholar]
- Kulnane LS, Lehman EJ, Hock BJ, Tsuchiya KD, Lamb BT. Rapid and efficient detection of transgene homozygosity by FISH of mouse fibroblasts. Mamm Genome. 2002;13:223–226. doi: 10.1007/s00335-001-2128-5. [DOI] [PubMed] [Google Scholar]
- Lacor PN, Buniel MC, Furlow PW, Clemente AS, Velasco PT, Wood M, Viola KL, Klein WL. Aβ oligomer-induced aberrations in synapse composition, shape, and density provide a molecular basis for loss of connectivity in Alzheimer's disease. J Neurosci. 2007;27:796–807. doi: 10.1523/JNEUROSCI.3501-06.2007. [DOI] [PMC free article] [PubMed] [Google Scholar]
- Lamb BT. Making models for Alzheimer's disease. Nat Genet. 1995;9:4–6. doi: 10.1038/ng0195-4. [DOI] [PubMed] [Google Scholar]
- Lamb BT, Sisodia SS, Lawler AM, Slunt HH, Kitt CA, Kearns WG, Pearson PL, Price DL, Gearhart JD. Introduction and expression of the 400 kilobase amyloid precursor protein gene in transgenic mice [corrected] Nat Genet. 1993;5:22–30. doi: 10.1038/ng0993-22. [DOI] [PubMed] [Google Scholar]
- Lamb BT, Call LM, Slunt HH, Bardel KA, Lawler AM, Eckman CB, Younkin SG, Holtz G, Wagner SL, Price DL, Sisodia SS, Gearhart JD. Altered metabolism of familial Alzheimer's disease-linked amyloid precursor protein variants in yeast artificial chromosome transgenic mice. Hum Mol Genet. 1997;6:1535–1541. doi: 10.1093/hmg/6.9.1535. [DOI] [PubMed] [Google Scholar]
- Lambert MP, Barlow AK, Chromy BA, Edwards C, Freed R, Liosatos M, Morgan TE, Rozovsky I, Trommer B, Viola KL, Wals P, Zhang C, Finch CE, Krafft GA, Klein WL. Diffusible, nonfibrillar ligands derived from Abeta1–42 are potent central nervous system neurotoxins. Proc Natl Acad Sci U S A. 1998;95:6448–6453. doi: 10.1073/pnas.95.11.6448. [DOI] [PMC free article] [PubMed] [Google Scholar]
- Lambert MP, Velasco PT, Chang L, Viola KL, Fernandez S, Lacor PN, Khuon D, Gong Y, Bigio EH, Shaw P, De Felice FG, Krafft GA, Klein WL. Monoclonal antibodies that target pathological assemblies of Abeta. J Neurochem. 2007;100:23–35. doi: 10.1111/j.1471-4159.2006.04157.x. [DOI] [PubMed] [Google Scholar]
- Lehman EJ, Kulnane LS, Lamb BT. Alterations in β-amyloid production and deposition in brain regions of two transgenic models. Neurobiol Aging. 2003a;24:645–653. doi: 10.1016/s0197-4580(02)00153-7. [DOI] [PubMed] [Google Scholar]
- Lehman EJ, Kulnane LS, Gao Y, Petriello MC, Pimpis KM, Younkin L, Dolios G, Wang R, Younkin SG, Lamb BT. Genetic background regulates β-amyloid precursor protein processing and β-amyloid deposition in the mouse. Hum Mol Genet. 2003b;12:2949–2956. doi: 10.1093/hmg/ddg322. [DOI] [PubMed] [Google Scholar]
- Lesné S, Koh MT, Kotilinek L, Kayed R, Glabe CG, Yang A, Gallagher M, Ashe KH. A specific amyloid-beta protein assembly in the brain impairs memory. Nature. 2006;440:352–357. doi: 10.1038/nature04533. [DOI] [PubMed] [Google Scholar]
- Luo Y, Bolon B, Kahn S, Bennett BD, Babu-Khan S, Denis P, Fan W, Kha H, Zhang J, Gong Y, Martin L, Louis JC, Yan Q, Richards WG, Citron M, Vassar R. Mice deficient in BACE1, the Alzheimer's beta-secretase, have normal phenotype and abolished beta-amyloid generation. Nat Neurosci. 2001;4:231–232. doi: 10.1038/85059. [DOI] [PubMed] [Google Scholar]
- Nimmrich V, Grimm C, Draguhn A, Barghorn S, Lehmann A, Schoemaker H, Hillen H, Gross G, Ebert U, Bruehl C. Amyloid β oligomers (Aβ1–42 globulomer) suppress spontaneous synaptic activity by inhibition of P/Q-type calcium currents. J Neurosci. 2008;28:788–797. doi: 10.1523/JNEUROSCI.4771-07.2008. [DOI] [PMC free article] [PubMed] [Google Scholar]
- Oddo S, Caccamo A, Shepherd JD, Murphy MP, Golde TE, Kayed R, Metherate R, Mattson MP, Akbari Y, LaFerla FM. Triple-transgenic model of Alzheimer's disease with plaques and tangles: intracellular Abeta and synaptic dysfunction. Neuron. 2003;39:409–421. doi: 10.1016/s0896-6273(03)00434-3. [DOI] [PubMed] [Google Scholar]
- Oddo S, Caccamo A, Tran L, Lambert MP, Glabe CG, Klein WL, LaFerla FM. Temporal profile of amyloid-beta (Abeta) oligomerization in an in vivo model of Alzheimer disease. A link between Abeta and tau pathology. J Biol Chem. 2006;281:1599–1604. doi: 10.1074/jbc.M507892200. [DOI] [PubMed] [Google Scholar]
- Petersen RC. Mild cognitive impairment: transition between aging and Alzheimer's disease. Neurologia. 2000;15:93–101. [PubMed] [Google Scholar]
- Roberds SL, Anderson J, Basi G, Bienkowski MJ, Branstetter DG, Chen KS, Freedman SB, Frigon NL, Games D, Hu K, Johnson-Wood K, Kappenman KE, Kawabe TT, Kola I, Kuehn R, Lee M, Liu W, Motter R, Nichols NF, Power M, et al. BACE knockout mice are healthy despite lacking the primary beta-secretase activity in brain: implications for Alzheimer's disease therapeutics. Hum Mol Genet. 2001;10:1317–1324. doi: 10.1093/hmg/10.12.1317. [DOI] [PubMed] [Google Scholar]
- Stine WB, Jr, Dahlgren KN, Krafft GA, LaDu MJ. In vitro characterization of conditions for amyloid-beta peptide oligomerization and fibrillogenesis. J Biol Chem. 2003;278:11612–11622. doi: 10.1074/jbc.M210207200. [DOI] [PubMed] [Google Scholar]
- Sturchler-Pierrat C, Abramowski D, Duke M, Wiederhold KH, Mistl C, Rothacher S, Ledermann B, Bürki K, Frey P, Paganetti PA, Waridel C, Calhoun ME, Jucker M, Probst A, Staufenbiel M, Sommer B. Two amyloid precursor protein transgenic mouse models with Alzheimer disease-like pathology. Proc Natl Acad Sci U S A. 1997;94:13287–13292. doi: 10.1073/pnas.94.24.13287. [DOI] [PMC free article] [PubMed] [Google Scholar]
- Vincent I, Rosado M, Davies P. Mitotic mechanisms in Alzheimer's disease? J Cell Biol. 1996;132:413–425. doi: 10.1083/jcb.132.3.413. [DOI] [PMC free article] [PubMed] [Google Scholar]
- Walsh DM, Klyubin I, Fadeeva JV, Cullen WK, Anwyl R, Wolfe MS, Rowan MJ, Selkoe DJ. Naturally secreted oligomers of amyloid beta protein potently inhibit hippocampal long-term potentiation in vivo. Nature. 2002;416:535–539. doi: 10.1038/416535a. [DOI] [PubMed] [Google Scholar]
- Wang HW, Pasternak JF, Kuo H, Ristic H, Lambert MP, Chromy B, Viola KL, Klein WL, Stine WB, Krafft GA, Trommer BL. Soluble oligomers of beta amyloid (1–42) inhibit long-term potentiation but not long-term depression in rat dentate gyrus. Brain Res. 2002;924:133–140. doi: 10.1016/s0006-8993(01)03058-x. [DOI] [PubMed] [Google Scholar]
- Wang L, Wang R, Herrup K. E2F1 works as a cell cycle suppressor in mature neurons. J Neurosci. 2007;27:12555–12564. doi: 10.1523/JNEUROSCI.3681-07.2007. [DOI] [PMC free article] [PubMed] [Google Scholar]
- Wu Q, Combs C, Cannady SB, Geldmacher DS, Herrup K. Beta-amyloid activated microglia induce cell cycling and cell death in cultured cortical neurons. Neurobiol Aging. 2000;21:797–806. doi: 10.1016/s0197-4580(00)00219-0. [DOI] [PubMed] [Google Scholar]
- Yang Y, Herrup K. Loss of neuronal cell cycle control in ataxia-telangiectasia: a unified disease mechanism. J Neurosci. 2005;25:2522–2529. doi: 10.1523/JNEUROSCI.4946-04.2005. [DOI] [PMC free article] [PubMed] [Google Scholar]
- Yang Y, Geldmacher DS, Herrup K. DNA replication precedes neuronal cell death in Alzheimer's disease. J Neurosci. 2001;21:2661–2668. doi: 10.1523/JNEUROSCI.21-08-02661.2001. [DOI] [PMC free article] [PubMed] [Google Scholar]
- Yang Y, Mufson EJ, Herrup K. Neuronal cell death is preceded by cell cycle events at all stages of Alzheimer's disease. J Neurosci. 2003;23:2557–2563. doi: 10.1523/JNEUROSCI.23-07-02557.2003. [DOI] [PMC free article] [PubMed] [Google Scholar]
- Yang Y, Varvel NH, Lamb BT, Herrup K. Ectopic cell cycle events link human Alzheimer's disease and amyloid precursor protein transgenic mouse models. J Neurosci. 2006;26:775–784. doi: 10.1523/JNEUROSCI.3707-05.2006. [DOI] [PMC free article] [PubMed] [Google Scholar]
- Zhao WQ, De Felice FG, Fernandez S, Chen H, Lambert MP, Quon MJ, Krafft GA, Klein WL. Amyloid beta oligomers induce impairment of neuronal insulin receptors. FASEB J. 2008;22:246–260. doi: 10.1096/fj.06-7703com. [DOI] [PubMed] [Google Scholar]