Abstract
This paper demonstrates the importance of disaggregating population data aggregated by census tracts or other units, for more realistic population distribution/location. A newly-developed mapping method, the Cadastral-based Expert Dasymetric System (CEDS), calculates population in hyper-heterogeneous urban areas better than traditional mapping techniques. A case study estimating population potentially impacted by flood hazard in New York City compares the impacted population determined by CEDS with that derived by centroid-containment method and filtered areal weighting interpolation. Compared to CEDS, 37 percent and 72 percent fewer people are estimated to be at risk from floods city-wide, using conventional areal weighting of census data, and centroid-containment selection, respectively. Undercounting of impacted population could have serious implications for emergency management and disaster planning. Ethnic/racial populations are also spatially disaggregated to determine any environmental justice impacts with flood risk. Minorities are disproportionately undercounted using traditional methods. Underestimating more vulnerable sub-populations impairs preparedness and relief efforts.
Keywords: dasymetric, population mapping, environmental justice, flood hazard, New York City, cadastral, urban, 100-year flood
BACKGROUND
Introduction
This study was designed to examine the potential utility of the recently-developed Cadastral-based Expert Dasymetric System (CEDS) by analyzing population(s) impacted by 100-year flooding in New York City in a geographical information science (GISc) framework. The lack of a consistent and accurate method to calculate potentially impacted populations can hinder disaster planning, preparedness, mitigation and recovery.
This paper will first review the overall issue of vulnerability and risk, then describe the CEDS method, discuss flood hazard in New York City, and define environmental justice in the context of natural hazards and disasters. We will then outline the methodology used to disaggregate the census population to more accurately determine flood risk and assess the potential environmental justice impact, and present the analysis and findings.
Hypotheses
This study has several goals: applying a newly-developed dasymetric population mapping method; estimating population potentially impacted by flood hazard; and conducting an environmental justice assessment of flood risk. Because of these multiple goals, there are two distinct, yet related, hypotheses. The first is that when the CEDS method is used to disaggregate population data, the estimation of the number of persons potentially affected by flooding in New York City (NYC) may be more “realistic” than the more traditional centroid containment and areal weighting (AW) methods (see section below for explanation of CEDS, AW, and centroid containment methods). The second hypothesis is that this dasymetric technique can be used to aid in the detection of the presence or absence of environmental injustice by disaggregating the racial and ethnic sub-populations and also compare the degree of over- or under-estimation for the various sub-populations. As previous research has demonstrated, racial and ethnic minority populations are often more vulnerable when exposed to the same magnitude event as the non-minority population, therefore underestimation of specific sub-populations could have deleterious ramifications in terms of hazard management and recovery efforts.
Vulnerability and Disasters
Equity issues are of particular importance in risk assessment of floods and other natural and technological disasters. The socially and economically vulnerable, particularly if they have limited or no social support structure, may bear additional burdens than “mainstream” or more affluent populations when exposed to identical physical phenomena. These hazards are comprised of stressors (often residing within the system) or perturbations (commonly originating from outside the system or location), as defined by Turner et al (2003).
“People’s vulnerability is generated by social, economic, and political processes that influence how hazards affect people in varying ways and differing intensities…. By ‘vulnerability’ we mean the characteristics of a person or group in terms of their capacity to anticipate, cope with, resist, and recover from the impact of a natural hazard,” (Blaikie et al, 1994:5, 9). In other words, certain people may be not only disproportionately exposed to hazards due to physical factors, like having poor quality housing that inadequately withstands hazard events, or living on marginal lands prone to hazard events, etc., but they may also be at a disadvantage due to lack of strong social, financial, or political support structures, and thus suffer greater relative losses, and experience a longer recovery time after a disaster, than the affluent, mainstream, or socially supported (Mitchell, 1999). It is important to note that minority status, economic disadvantage, and weak social support structures are not necessarily synonymous, and in fact it is possible to be economically disadvantaged and have strong social support structure, which could result in reduced vulnerability to hazards when compared with analogous sub-populations lacking in strong social support structures (Goltz et al, 1992; Morrow, 1997). Nevertheless, in an article reviewing the race, ethnicity, and disaster literature, most of the studies reviewed demonstrate an increase in risk and vulnerability to disasters for communities of color in the United States (Fothergill et al, 2000). This is one of the main reasons why it is so important to understand the specific demographics of each potentially impacted area.
As Negri states when discussing the use of GIS with regard to hazards and social vulnerability, “Analyzing census data with GIS tools, we can identify specific areas where people are at risk for floods and landslides. Some factors further increase social vulnerability, such as limited access to political power and representation, lack of access to resources (including information and technology), lack of social capital (like social networks), and poor health. Beliefs and customs, and the age, type, and density of infrastructure, buildings, and lifelines are also factors that affect risk and potential losses.” (Negri, 2005, p. 1245).
Cadastral-based Expert Dasymetric System (CEDS)
Dasymetric mapping is a technique which, while venerable, is not commonly used, due to a lack of standardized methods, as well as its relative complexity when compared to the simpler choropleth techniques (Holt et al, 2004; Maantay et al, 2007). The underlying concept of dasymetric mapping involves the process of disaggregating spatial data to a finer unit of analysis, using additional (or “ancillary”) data to help refine locations of population or other phenomena being mapped (Mennis, 2003). One of the main benefits of dasymetric mapping is that it is not restricted to using the locations of, for instance, census tract boundaries, ZIP code postal zones, or any other administrative boundaries, which do not necessarily relate to the underlying phenomena being mapped, having been created arbitrarily or to suit other governmental purposes. Using aggregated data, population totals within a given areal zone are assumed to be distributed evenly throughout the zone, when, in fact, population distribution is generally much more heterogeneous (Wu et al, 2005). This creates errors when trying to establish accurate rates for GIS analyses pertaining to health studies, crime patterns, hazard/risk assessment, land use planning, or environmental impacts, among others, that rely on a smaller unit of analysis, or a different spatial unit of analysis, than the original zones. For example, the case study highlighted in this paper is characterized by flood zone boundaries that intersect but do not spatially coincide with the census block group boundaries. Therefore, there was a need to assign population from census block groups to flood zones in order to conduct this analysis.
This problem of non-coincident spatial boundaries and the frequent need to transfer data from one set of zones to another (e.g., population within census block groups and flood zones) is a long-standing dilemma, and is not addressed by choropleth mapping, which simply distributes the population or other data evenly throughout the spatial unit. Typically, the issue of rectifying attribute data from different sets of spatial units is handled by a procedure called “areal weighting,” (AW). This very simple method redistributes the source data (e.g., population) based solely on area proportions. In other words, if a census tract is divided into 4 equal areas, each piece would be allocated exactly ¼ of the population. The population is thus “weighted” by the area’s proportion to the whole. AW assumes homogeneity – envisioning population evenly distributed throughout the geographic unit. This homogeneity is seldom the case in reality, particularly in a complex built environment like NYC.
One way to overcome this problem of false homogeneity is to use an ancillary data set, such as land cover, to filter out areas that are not inhabited. This is often called “filtered areal weighting,” and in the simplest version uses a binary redistribution: areas are deemed either inhabited or non-inhabited. If, from the land cover data, one can infer that an area is uninhabitable (e.g., lake, park, parking lot, highway), no population from the population source layer would be assigned to that polygon or pixel, leaving all of the population to be distributed to the remaining areas. In essence, the ancillary dataset in this example acts to “mask” the census tract data so that uninhabitable land is left devoid of population (Eicher and Brewer, 2001). This type of dasymetric mapping generally utilizes land cover data from satellite images to create the filtering or masking information, and in more complex types of dasymetric mapping, such as the three-tiered method, can also be used to develop rough population density information (Langford, 1994; Holloway et al, 1999; Mennis, 2003; Sleeter, 2004).
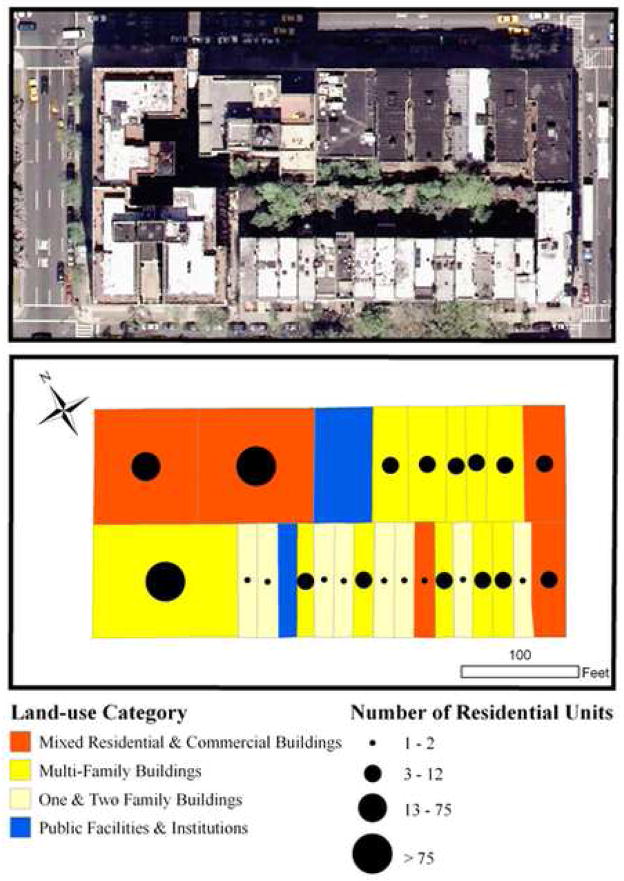
Unfortunately, this type of dasymetric disaggregation can be of limited utility in urban areas, due to many reasons, including the lack of distinction typically made between land cover and land use, and spatial resolution that is too low for the application. Complete information about land-use, and more importantly, population density, is not reflected clearly in the land cover data (Forster, 1985). Moreover, in a hyper-heterogeneous urban area like New York City, simply knowing whether or not an area is comprised of a residential land use is insufficient for calculating population, since residential buildings range from one household to several hundred households on one lot, and population density can vary widely even within the relatively small area of a census block group, or the even smaller city block (fig. 1).
Figure 1.
Heterogeneity of a Manhattan city block. The orthophoto (above) and the cadastral map show the uneven distribution of land use categories and residential units at the tax-lot level even when examining only one city block. (There are, on average, more than 16 city blocks in a New York City census tract.) Data source: NYCMap, 2004; LotInfo 2001.
It is more logical, therefore, to use one of the smallest functional population units of the urban environment, the property tax-lot, rather than an arbitrarily imposed boundary (e.g. census unit or raster pixel of a satellite image). This is one of the main reasons that the CEDS methodology was developed. It has the potential to be of great use to researchers looking at problems geographically in hyper-heterogeneous urban environments. As the name implies, the Cadastral-based Expert Dasymetric System (CEDS) uses cadastral-based data as the ancillary data set with which to disaggregate the census information. Cadastral data is property tax lot data, and is used in recording property boundaries, property ownership, property valuation, and for property tax collection. The specific cadastral data we used (LotInfo, 2001) in this study contains many fields, including zoning designation, land use, residential area, residential units, and lot size. This type of data is now available for most urban areas in the United States and other developed countries, since its primary purpose is for property tax collection.
By using an expert system, CEDS determines, on a localized basis, whether residential area (i.e., square feet of living space per lot) or number of residential units (e.g. number of individual dwelling units per lot) works best for that particular census unit. Although conceptually quite simple, the design and implementation of CEDS proved to be a bit more complex, and is explained fully in Maantay, Maroko, and Herrmann’s article, “Mapping Population Distribution in the Urban Environment: The Cadastral-based Expert Dasymetric System (CEDS),” (2007).
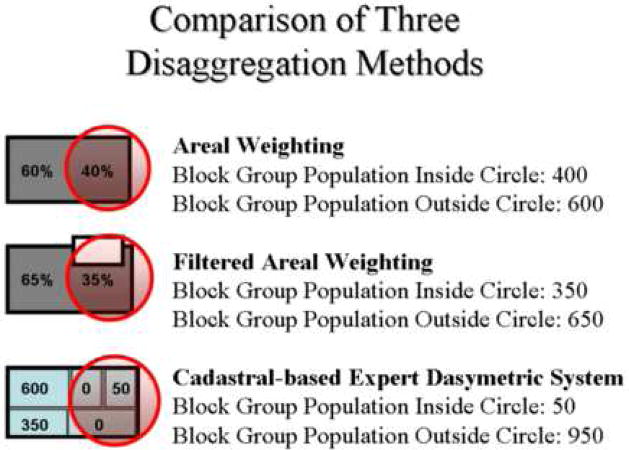
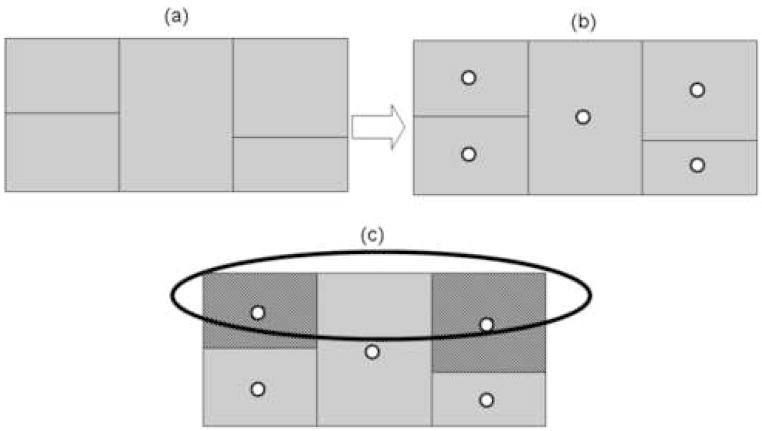
The CEDS technique uses residential area (RA) and number of residential units (RU) as proxies for population distribution. In other words, it is assumed that where there are more potential living accommodations, there will be higher populations. As such, the population in each block group was disaggregated, or redistributed, among the tax lots based on either RA or RU. The proxy unit (RA or RU) used in the disaggregation was determined by an expert system individually for each geographic unit. The results were then validated against census data and compared to commonly used dasymetric techniques to assess predictive accuracy and possible improvement over other methods (fig. 2).
Figure 2.
Methodological differences and potential improvement of population estimation of the CEDS method (c), over both Filtered Areal Weighting (b), and Simple Areal Weighting (a).
Studies involving comparisons of data sets used to estimate vulnerable, exposed, or impacted populations have been carried out by other researchers, similar to the case study presented in this paper. Goodchild, Anselin, and Deichmann (1993) conducted a spatial analysis using non-coincident areal units, namely the 58 counties of California and the state’s 12 major hydrological basins. The boundaries of the two sets of spatial units were, for the most part, incompatible. The socioeconomic data are available on the county level, but data connected with water issues are collected based on the hydrologic basin units that correspond to major watershed boundaries. In order to conduct a major economic impact study of water usage and policy, variables such as employment, income, and population had to be transferred from the county spatial units to the hydrological regions. Goodchild et al used direct areal weighting to accomplish this, assuming that densities in the county units were uniform. When later comparing the results of the areal weighting method with other methods using various statistical approaches, they found that areal weighting was not as effective, having a much higher mean percentage error than the other methods.
Jane Fielding and Kate Burningham (2005) compared populations vulnerable to flood hazard in England and Wales using two different population data sets. The first dataset, roughly equivalent to the U.S. Census aggregates, produced greatly inflated results when compared to that of a gridded population estimate provided at a much finer spatial resolution. Aside from differences in total populations, the researchers looked at relative flood risks according to social class, and determined that the population data source had significant influence over these results.
Therefore, it has been found that not only the data sets used to derive the populations, but the methods used to calculate the population from these data sets will have a considerable impact on the results of the analysis.
Flood Hazard
Flooding has been, and continues to be, a concern not only in the New York City region, but across the country. According to the United States Geological Survey (USGS), nationally floods result in 140 deaths and $6 billion in property damage on average annually. The costliest river-related flood in U.S. history occurred in the Upper Mississippi River Basin in 1993, killing 47 people and causing an estimated 20 billion dollars of damage. In 2005, flooding associated with Hurricane Katrina caused more than 200 billion dollars of damage, the costliest natural disaster in the country’s history (USGS, 2006).
A common way to delineate the threat of flood is with what is termed the “100-year floodplain.” This designation represents areas with a 1-percent-annual-chance for flooding and was created so that there would be a standardized measure among federal, state, and local agencies involved with floodplain management. FEMA estimates that nearly 150,000 square miles of the United States (over 4 percent of the total area) are within the 100-year floodplain (FEMA, 1983).
“The U.S. has very little experience with evacuating cities from natural hazards,” (Cutter, 2006, p. xxiii). New York City, one of the nation’s most densely populated metropolitan regions, is susceptible to flood hazards, and would be a particularly difficult city to evacuate; it is a city of islands surrounded by water - oceans, rivers, tidal straits, estuaries, and bays - and contains numerous inland waterbodies as well. NYC has close to 600 miles of coastline (Bloomfield, 1999), and approximately 15% of its area is within the 100-year flood plain. Given the high density of NYC’s built environment, encompassing both residential and commercial development, there is an enormous potential for damage to life and property from flooding. New York City experiences frequent and destructive “nor’easters” and the occasional hurricane, and the storms’ strength and potential for devastation are magnified by the unique configuration of Long Island’s land mass in relation to the mainland, which creates virtually a 90 degree angle to the eastern seaboard of the U.S. Hurricane experts state that even a category 3 hurricane here could have devastating consequences (Coch, 1994).
Further exacerbating the situation, it is predicted that global warming and accelerated sea level rise could greatly increase flood risk. One of the bullet points referring to tactics to mitigate and adapt to the effects of climate change in the Sigma Xi (United Nations Foundation Scientific Research Society) executive summary, Confronting Climate Change: Avoiding the Unimaginable and Managing the Unavoidable, suggests to “… avoid new development on coastal land that is less than one meter above present high tide, as well as within high-risk areas such as floodplains” presumably due to “seemingly modest changes in average temperature experienced over the 20th century … [that has been] … accompanied by significant increases in the incidence of floods” (Sigma Xi, 2007, p. 4). Regarding New York City, Gornitz claims that the “… vulnerability of the Metropolitan East Coast Region to coastal hazards, such as more frequent storm flooding, beach erosion, submergence of coastal wetlands, and saltwater intrusion, will intensify as sea level rises.” (Gornitz, 2000, p. 45) and that due to accelerated sea level rise “… the return period of the 100-yr storm flood could be reduced to 19–68 years, on average, by the 2050s, and 4–60 years by the 2080s,” (Gornitz, 2002, p.61).
Environmental (In)justice
The final element of this study to be examined prior to the methodological discussion is environmental justice (EJ). This is a term whose definition has broadened appreciably in recent years, and has gained widespread usage. Originally, EJ referred to the principle that certain groups - generally communities of color, people with low socio-economic status, or populations that are otherwise disadvantaged or marginalized due to language differences, cultural discrimination, or geographic or social isolation - bear a disproportionate share of the environmental burden and have no, or limited, input regarding policy and legislation. The U.S. Environmental Protection Agency (USEPA) defines EJ as:
Environmental Justice is the fair treatment and meaningful involvement of all people regardless of race, color, national origin, culture, education, or income with respect to the development, implementation, and enforcement of environmental laws, regulations, and policies. Fair Treatment means that no group of people, including racial, ethnic, or socioeconomic groups, should bear a disproportionate share of the negative environmental consequences resulting from industrial, municipal, and commercial operations or the execution of federal, state, local, and tribal environmental programs and policies. Meaningful Involvement means that: (1) potentially affected community residents have an appropriate opportunity to participate in decisions about a proposed activity that will affect their environment and/or health; (2) the public’s contribution can influence the regulatory agency’s decision; (3) the concerns of all participants involved will be considered in the decision-making process; and (4) the decision-makers seek out and facilitate the involvement of those potentially affected. (US EPA, 1995)
However, the definition of EJ has been broadened by many researchers and advocates to include other vulnerable groups, such as children, the elderly, the immuno-compromised, and future generations, and has also grown to accommodate any geographically significant dissimilarity (Bryant, 1995; Bullard, 1994; Greenberg, 1993; Hofrichter, 1993; Johnston, 1994). Not only has the definition of the impacted population been broadened, but the definition of the term “environment” within “environmental justice” now casts a wider net to include built, natural, political, economic, and social environments. This dissimilarity could mean the disproportionate burden of outcomes such as pollution, disease, or crime; disproportionate access to beneficial resources such as parks, open space, nutritious food, education, or transportation; disproportionate exposure to risk from hazards such as flood, mudslide, drought, or hurricane; or nearly any other socio-political, built, or natural phenomenon which is distributed in an uneven manner. A recent example of this latter type of environmental injustice can be seen in the emergency preparedness, evacuation, and reconstruction efforts in New Orleans in the aftermath of hurricane Katrina (Cutter, 2006). EJ issues in natural disaster incidents can be seen in a multitude of ways, including the manner of evacuation, property affected by water/winds due to location or pre-disaster mitigation, and in the way reconstruction has (or has not) proceeded.
The revelations of inadequate response to hurricane Katrina’s aftermath are not just about failures in emergency response at the local, state and federal levels or failures in the overall emergency management system. They are also about failures of the social support systems for America’s impoverished – the largely invisible inner-city poor […] Social vulnerability is partially a product of social inequalities – those social factors and forces that create the susceptibility of various groups to harm, and in turn affect their ability to respond and bounce back after the disaster […] Race and class are certainly factors that help explain the social vulnerability in the American south, while ethnicity plays a additional role in many cities. (Cutter, 2006, p. xxi–xxiii)
There is a substantial body of literature describing and documenting environmental injustices occurring around the issues of technological disasters, human-made environmental catastrophes, environmental contamination, every-day pollution events, and chronic reductions of air, water, and soil quality resulting in health impacts (Bullard, 1994; Johnston, 1994; Chakraborty et al, 1997; Neumann et al, 1998; White, 1998; Morello-Frosch, et al, 2001; O’Neill, et al, 2003; Maantay, 2007). However, there is much less written about the environmental injustices surrounding natural disasters. “Socially created vulnerabilities are largely ignored in the hazards and disaster literature because they are so hard to measure and quantify,” (Cutter, 2006, p. xxii).
In their excellent review article of the literature pertaining to race, ethnicity, and disasters in the United States, Fothergill, Maestas, and Darlington (1999) look at potential racial and ethnic inequalities in all the major stages in a disaster event: risk perception; preparedness behavior; warning communication and response; physical impacts; psychological impacts; emergency response; recovery; and reconstruction. They cite examples of previous research indicating that in all these stages, there are significant differences in how disasters are experienced, depending on race and ethnicity. For instance, “Red Cross fatality counts indicate that disaster-connected deaths were disproportionately high among ethnic minorities,” (Fothergill et al, 1999, p.161, citing Trainer and Hutton, 1972).
Regarding emergency response during a disaster, “the interactions between relief personnel and racial and ethnic communities play out the pre-existing social problems and structural stratification. Following Hurricane Frederick, for instance, response workers restored power in black areas only after it was restored in white areas, and black communities received less emergency shelter, ice, food and assistance (Beady and Bolin, 1986). After the Whittier Narrows earthquake, authorities placed signs reading ‘Not Fit for Occupancy’ on buildings with English-speaking tenants, while the Spanish translation read ‘Entry Illegal,’ and was posted on the buildings of Spanish-speaking residents (Cooper and Laughy, 1994). Indeed, after Loma Prieta [earthquake in the San Francisco Bay area] shelters in well-off neighborhoods had more volunteers than homeless and received visits from the mayor, while at a low-income emergency shelter it was reported that Anglo volunteers made racist remarks and the mayor paid no visits (Dhesi, 1991),” (Fothergill et al, 1999, p. 163).
Additionally, during the recovery and reconstruction stages, ethnic/racial, and socioeconomic factors also serve to marginalize certain communities. Recovery is more difficult when the household has a low income to begin with, their employment may tend to be more disrupted by a disaster, the household may have little or no savings, and may not have adequate or any insurance. Residential segregation patterns, and insurance company red-lining practices may also contribute to minority households having less than optimal insurance, or for being insured with non-major insurance firms. Racial and ethnic minority households also tend to have less access to information about relief assistance and opportunities. More affluent and non-Hispanic white households are more likely to know how to “work the system,” to fill out forms, ferret out information, and navigate through convoluted government procedures than the minority households, resulting in the minority and lower-income households receiving much less relief aid, and recovering economically much more slowly (Fothergill et al, 1999, p. 165, citing Aptekar, 1990; Bolin, 1986).
And lest we conclude that the disadvantages suffered by racial and ethnic minority communities during and after disasters is due primarily to their low economic status and lack of political power, there is substantial evidence presented in Fothergill’s review paper pointing to “cultural ignorance, ethnic insensitivity, racial isolation, and racial bias in housing, information dissemination, and relief assistance,” (Fothergill, 1999, p. 169), leading to racial/ethnic discrimination in how people are handled before, during, and after a disaster, quite apart from issues of poverty alone producing the inequalities experienced.
It should be noted that historical settlement patterns influence the socio-demographic characteristics of populations residing in flood-prone areas. The development of low-elevation areas for housing and the desirability of coastal living has varied over time and place. Even within any given city, there may not be uniformity in the relationship between socio-economic status and elevation (Meyer, 1994, 2005; Ueland and Warf, 2006; Willie, 1961). As such, the New York City case study presented in this paper is not necessarily representative of conditions in other geographies, but is simply illustrative of the potential improvement in estimating populations impacted by flood hazard, and the kinds of discrepancies that can result from relying on census data and generalized methods of population estimation.
It seems obvious from reading the existing research that different populations may require different strategies and approaches to disaster preparedness, emergency response, and disaster relief. That is why we believe it is important to understand not only the numbers and locations of potentially affected people, but exactly “who” the people are who might be most impacted by a major natural disaster such as a flood in New York City. We need to know what the socio-demographic characteristics of these people are so that appropriate warning communications, mitigation, and recovery planning efforts can be put in place prior to such an event occurring. This will need to be an individualized response for each city, reflecting the particular circumstances and conditions of settlement and population distribution in each specific place.
METHODOLOGY
Methodologically, this study is straightforward and uses standard GIS techniques within ESRI’s ArcGIS package (ESRI, 2005). These geo-processing techniques include any number of operations, generally falling in the category of “overlay” functions (e.g., intersect) which allow the creation of new information which does not exist in any of the input datasets (Maantay, 2006).
Data Sets
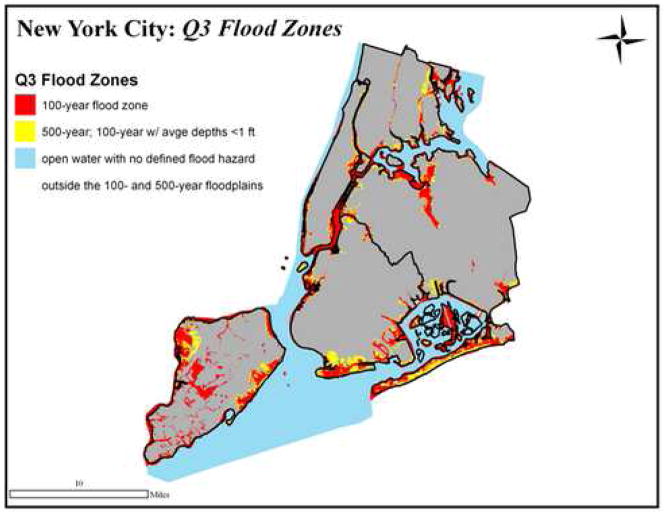
The 100-year flood data is from FEMA’s Q3 dataset. This information, designed to serve in disaster response and recovery activities as well as flood insurance concerns, is essentially digital versions of Flood Insurance Rate Maps (FIRMS) categorizing flood risk into distinct zones. These zones reflect the severity and type of flooding in the area (fig. 3). The area included in the 100-year floodplain, also known as the Special Flood Hazard Area (SFHA), is built by compiling selected high risk zones as designated by FEMA.
Figure 3.
FEMA Q3 flood zones in New York City. Data source: FEMA, 1996
There are, however, some drawbacks associated with using the Q3 data. Firstly, it is represented as vector (discrete polygons, not continuous) data. This artificially rigid border does not allow for the subtlety, boundary “fuzziness,” and areas of transition commonly associated with natural phenomena. Secondly, the scale at which the Q3 data was created is significantly coarser than the tax-lot data that was used in the CEDS approach to disaggregate the population data. This could lead to an over-inflated veneer of accuracy in the results and should therefore be interpreted with caution (Cutter, 1997).
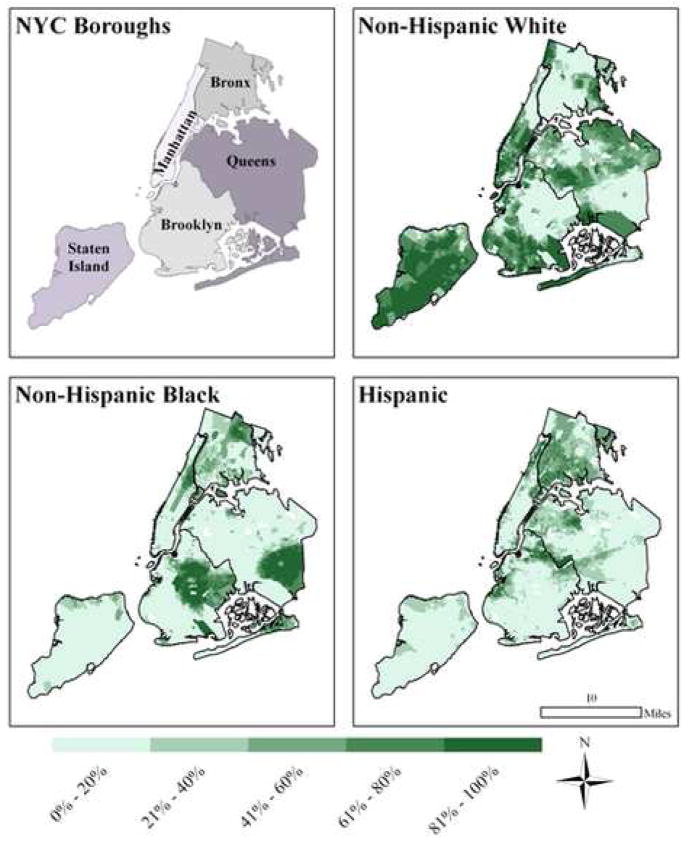
The NYC base map data was supplied by both LotInfo and the U.S. Bureau of the Census. Standard demographic data, including total population, non-Hispanic white population (NHWH), non-Hispanic black population (NHBL), non-Hispanic Asian population (NHAS), and Hispanic population (HISP), was downloaded from the U. S. Census Bureau website (SF1 and SF3 data) and served to populate the choropleth map at the block group (BG) level (n = 5734 in NYC) (fig. 4).
Figure 4.
NYC boroughs and percent non-Hispanic white, non-Hispanic black, and Hispanic populations by census block groups in NYC (n = 5,734). Data source: U.S. Bureau of the Census, 2000
The alternate population data was a result of the CEDS method of data disaggregation introduced earlier using the LotInfo property tax lots (n = 847,153 in NYC, roughly 150 times more tax-lots than census block groups).
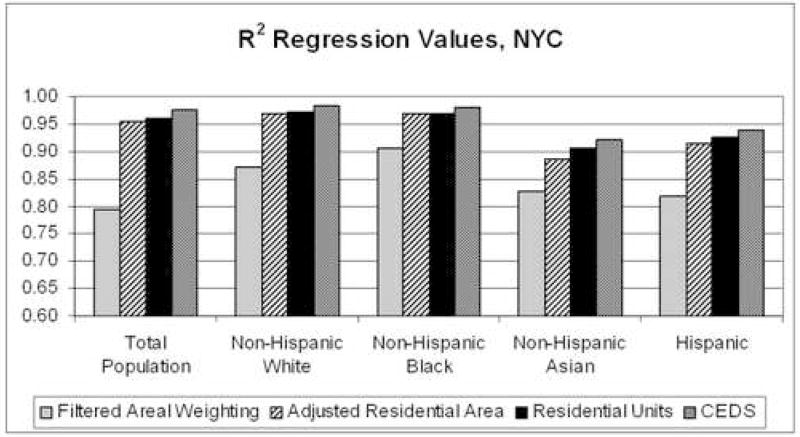
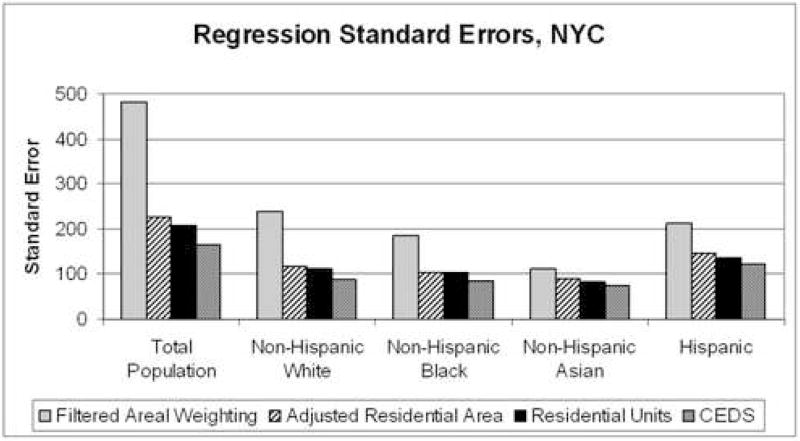
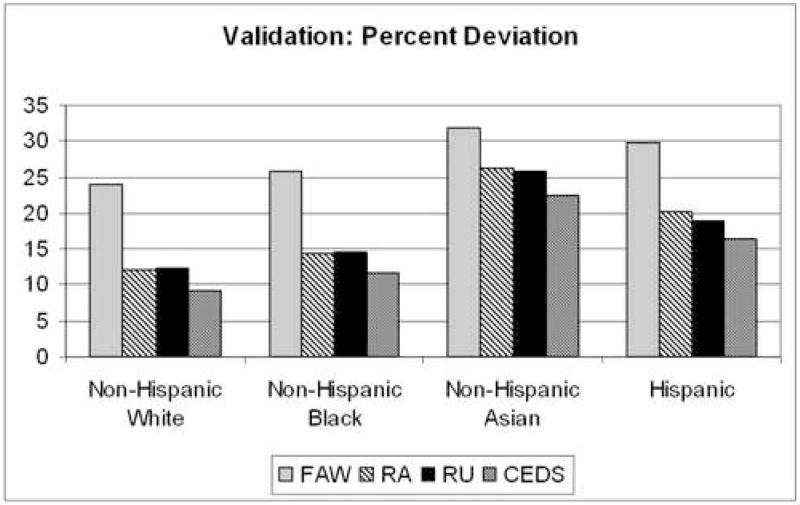
By using the expert system, which selects either residential area or residential units as the ancillary dataset on a block group-by-block group basis, CEDS was able to estimate total population, and racial/ethnic subpopulations in NYC. The estimated accuracy of these predictions was calculated by employing simple linear regression analysis, the results of which can be seen below (figures 5, 6, 7, and table 1).
Figure 5.
R2 values from simple linear regressions of selected populations for areal weighting, residential area, residential units, and CEDS vs. census validation data.
Figure 6.
Standard error values from simple linear regressions of selected populations for areal weighting, residential area, residential units, and CEDS vs. census validation data.
Figure 7.
Percent deviation of CEDS-derived data as compared to census validation data.
Table 1.
Regression Equations for Filtered Areal Weighting and CEDS.
| FAW | RA | RU | CEDS | |
|---|---|---|---|---|
| Total Population | .936x + 86.8 | .968x + 46.4 | .983x + 46.4 | .983x + 29.0 |
| non-Hispanic White | .951x + 22.6 | .984x + 8.6 | .987x + 7.4 | .993x + 4.3 |
| non-Hispanic Black* | 1.00x − 1.2 | .995x + 2.4 | .991x + 3.9 | 1.00x + 1.3 |
| non-Hispanic Asian | .950x + 6.6 | .956x + 6.2 | .966x + 4.7 | .981x + 3.1 |
| Hispanic | .942x + 21.7 | .974x + 10.1 | .981 + 7.6 | .989x + 4.8 |
As can be seen by the regression and the percent deviance analyses, CEDS is a better approximation of reality than areal weighting.
Identification of Populations and Sub-Populations Vulnerable to Flooding
There are various ways of calculating population vulnerable to flood hazard. This section will outline three different methods: the centroid containment method, areal weighting (AW), and the Cadastral-based Expert Dasymetric System (CEDS).
Centroid Containment Method
A common method for estimating populations exposed to flood risk is with FEMA’s HAZUS-MH (Hazards U.S. Multi-Hazard) software. The package uses census centroids (block group or tract) to identify impacted populations (FEMA, 2006). This is a rather primitive and imprecise technique that effectively places an entire census unit within the impact zone if its geographic center (centroid) is contained within the zone, and excludes the entire unit if the centroid is not within the zone, independent of how much residential area belonging to the unit is potentially affected. The centroid containment method is not a true disaggregation method, but rather a simple selection technique (fig. 8).
Figure 8.
a–c: the Centroid Containment Method transforms census block groups (a) into points at the geographic center of each polygon (b). The ‘affected’ block groups (shown cross-hatched) are then determined by selecting each centroid which intersects with the phenomenon of interest (shown in red) (c).
Areal Weighting
Areal weighting is a more robust estimation method than the centroid containment method. In order to calculate populations within the flood zones, the census block group data was “clipped” by the 100-year floodplain layer – meaning that the flood information acted as a “cookie cutter” for the census data. The resultant clipped census information was then adjusted based on areal weighting (e.g., if 25% of a BG fell within the 100-year floodplain, 25% of the total, non-Hispanic white, non-Hispanic black, non-Hispanic Asian, or Hispanic populations were considered to be within the floodplain).
Cadastral-based Expert Dasymetric System (CEDS)
The alternative to these methods, for the sake of testing the new dasymetric technique in this study, was to use CEDS-derived tax-lot population data by selecting tax-lots which intersect with the flood zone. This method does not assume a homogeneous distribution of populations, nor does it assume that each population will be distributed in the same fashion. It should be noted that the CEDS tax-lot selection was determined by an intersection of flood zone and tax lot, rather than the more conservative techniques similar to the centroid containment method, wherein the tax-lot would only be selected if the geographic center fell within the 100-year flood zone. In other words, the concept fueling this study is to calculate how many people will potentially be affected by the flood; therefore tax-lots which intersect the zone were used rather than those that had their centers within it. Bear in mind that the tax lots are typically substantially smaller than the block group, (on average, there are 150 tax lots to one BG in NYC), so selecting tax lots that are within the flood zone boundaries will be more accurate than using BG population data, regardless of whether intersection or geographic center of lots are used to determine inclusion in the flood plain.
Example Illustrating the Three Methods
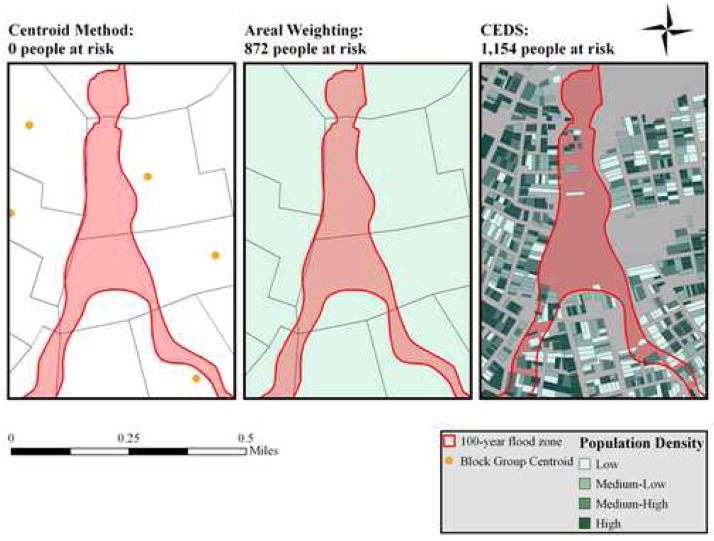
The difference in techniques becomes more apparent when looking at the data in large-scale maps (fig. 9). In this example of a small area of northern Staten Island, CEDS estimates that over 1,100 people are within the 100-year flood zone, whereas AW estimates less than 900 and the centroid containment method estimates that no people reside in the affected area. What is more important than the absolute numbers is that the block groups’ populations are not distributed evenly, either within each block group, or between the block groups. In other words, not only are the population counts not the same, but the populations being estimated are not the same people.
Figure 9.
100-year flood zone in a small area of Staten Island, NY showing population densities calculated with the Centroid Containment Method (left), Areal Weighting (center) and CEDS (right). The centroid containment method predicts zero people since no centroids fall within the flood zone. AW not only predicts fewer people than CEDS, but also different people.
ANALYSIS AND RESULTS
Calculating Population and Sub-Populations Inside the Flood Zones
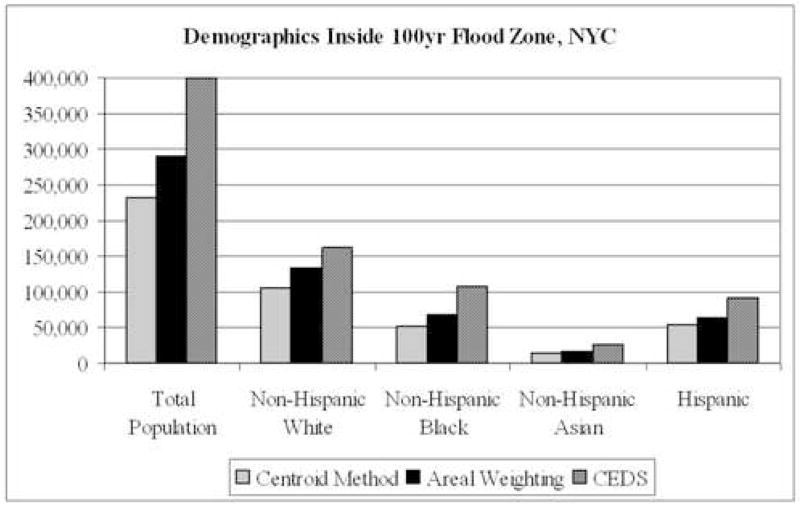
The first stage of analysis was the comparison of data derived from the centroid containment method, areal weighting, and CEDS. As would be expected from using such different methodologies, the results were divergent. Overall, both the centroid containment method and areal weighting had a tendency to underestimate population when compared to the CEDS technique (fig. 10), although there were individual areas where the centroid containment method and AW calculated higher populations than CEDS.
Figure 10.
Predicted populations within the 100-year flood zone in NYC.
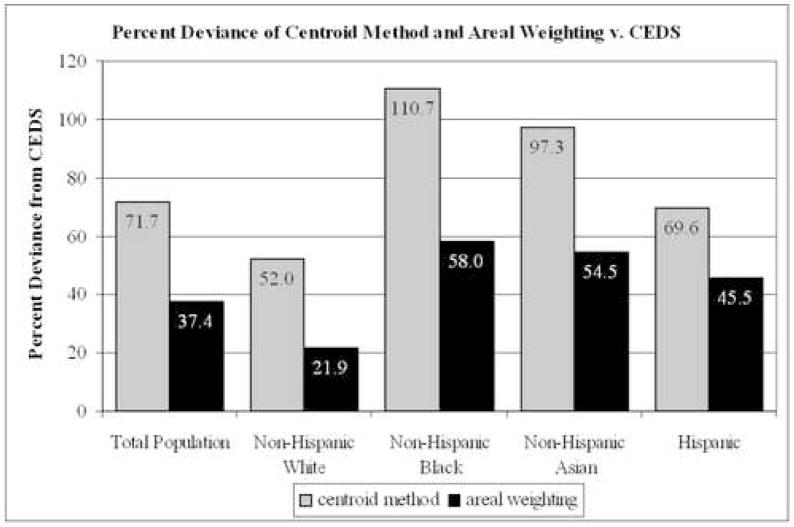
In the results for the entire city, the centroid containment method and areal weighting undercounted the total population potentially affected by the 100-year flood by 166,909 people (72%) and 108,770 people (37%), respectively when compared to the CEDS-derived population. When examined a bit more closely, however, it can be seen that this underestimation by the centroid containment and AW methods was not consistent across racial/ethnic groups. For instance, while areal weighting undercounted non-Hispanic whites by 22% in NYC, non-Hispanic blacks were undercounted by 58%. The centroid containment method results were similar with Non-Hispanic whites undercounted by 52% while the non-Hispanic black population had a 111% deviance. In other words, the racial and ethnic make-up of the flood-affected populations in NYC is quite different dependent upon which population data and which disaggregation technique is being used (fig. 11).
Figure 11.
Percent deviance of the Centroid Containment Method and AW vs. CEDS regarding undercounting of racial/ethnic groups.
Environmental Justice Assessment of Flood Zones
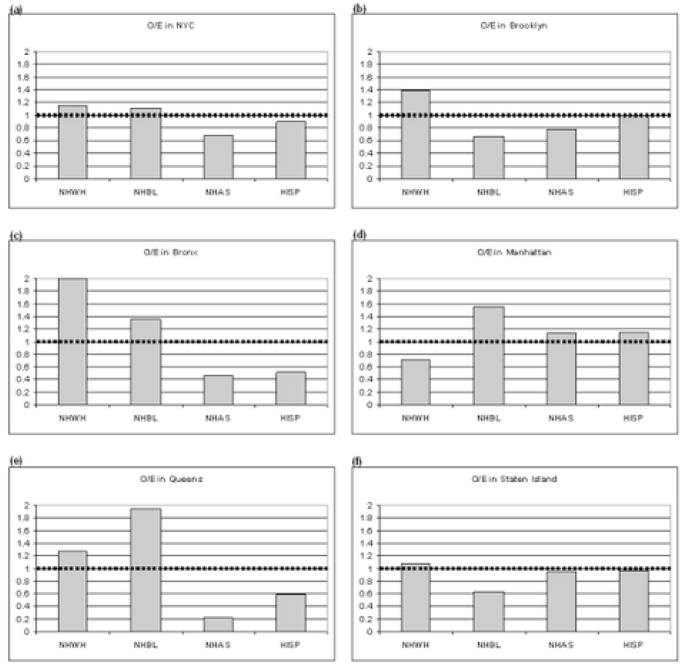
Further analysis of potential environmental justice impact, namely racially or ethnically biased likelihood for residing within the 100-year floodplain, was conducted on the CEDS data by comparing observed and expected values for flood-affected populations. Expected values were calculated by deriving the rate of the total population being within the flood zone for each borough (e.g., Bronx residents inside the floodplain/total Bronx residents), and multiplying that by the subpopulation being examined (e.g., Hispanics in the Bronx). A simple ratio of observed divided by expected (O/E) was calculated that shows increased likelihood (values > 1) or decreased likelihood (values < 1) of residing within the flood zones. The results can be seen below (Fig. 12)
Figure 12.
a–f: Observed/expected ratios of non-Hispanic white (NHWH), non-Hispanic black (NHBL), non-Hispanic Asian (NHAS), and Hispanic (HISP) populations in (a) NYC (b) Brooklyn (c) Bronx (d) Manhattan (e) Queens and (f) Staten Island.
The Observed/Expected ratios show, for instance, that the Non-Hispanic Black population within the flood zones was nearly 60 percent higher than expected in Manhattan, 40 percent higher than expected in the Bronx, and almost 100 percent higher in Queens. Non-Hispanic White populations, on the other hand, were over-represented by approximately 100 percent above expected in the flood zones in the Bronx, and 40 percent above expected in Brooklyn.
Although there are instances of significantly disparate risk in Queens, the Bronx, and to a lesser degree Manhattan, there is no consistency between boroughs regarding the risk of flood exposure and race/ethnicity. Various other statistical tests were performed (e.g. chi square and Kramer’s Phi) showing generally inconclusive environmental justice results in terms of the disproportionate impact of floods on communities of color.
The inconsistent results regarding environmental justice impacts is likely due to a number of factors: variations amongst the boroughs’ historic patterns of residential settlement; different levels and chronology of industrial development along the waterfront; recent and historic landfilling of coastal wetland areas, which subsequently enabled development at different times; recent de-industrialization efforts and gentrification in certain areas of the city; and cultural changes over the years concerning the desirability of living along the waterfront and therefore the flood zones.
CONCLUSION
There are, overall, 37 percent fewer people estimated to be at risk from floods using the conventional areal weighting of census data and 72 percent fewer people using the centroid containment selection method, as compared to using the CEDS method. This undercounting of impacted population could have serious implications for emergency management and disaster planning.
According to CEDS-derived population estimates and the FEMA Q3 flood data, minority populations, on a city-wide basis, do not appear to be disproportionately represented within 100-year flood plains, although minority populations may be over-represented in the flood zones of several of NYC’s boroughs. This study does, however, show how substantially different, and theoretically closer to reality, CEDS derived population data is vis-à-vis prediction of the location of populations and subpopulations when compared to the centroid containment method and areal weighting. It is this improvement in estimation that has lead to the realization that the centroid containment method and AW seems to be undercounting black, Asian, and Hispanic populations at nearly twice the rate at which it undercounts the white population. In other words, the sub-populations within the flood zones that are most at risk due to socio-demographic ‘disadvantages’, are the very same that are underestimated using the currently accepted techniques. While minority populations city-wide do not disproportionately live within the flood plains in New York City, they are disproportionately undercounted by the traditional methods of population estimation, as, for example, Non-Hispanic Blacks in the flood zones being undercounted at twice the rate of Non-Hispanic Whites.
The ability to accurately determine the population potentially affected by the 100-year flood, or residing in an SFHA, particularly with regards to vulnerable sub-populations, could greatly improve emergency management and disaster planning. The CEDS method could also be usefully applied to estimating populations potentially impacted by hazards other than flood risk, especially those hazards whose impact extent can be adequately delineated. By knowing more precisely who and where are the populations at risk and then working directly with these local communities, efforts for disaster planning, mitigation, and recovery are much more likely to be successful and actualized.
Acknowledgments
This research was partially supported by the National Oceanic and Atmospheric Administration’s Cooperative Remote Sensing Science and Technology Center (NOAA-CREST) under NOAA grant number NA17AE162. The National Institute of Environmental Health Sciences of the National Institutes of Health also provided critical support for this project under grant number 2 R25 ES01185-05. The statements contained within this paper are not the opinions of the funding agency or the U.S. government, but reflect the authors’ opinions. A PSC-CUNY Faculty Research Award # 69372-00 38 also provided funding for this project.
Footnotes
Publisher's Disclaimer: This is a PDF file of an unedited manuscript that has been accepted for publication. As a service to our customers we are providing this early version of the manuscript. The manuscript will undergo copyediting, typesetting, and review of the resulting proof before it is published in its final citable form. Please note that during the production process errors may be discovered which could affect the content, and all legal disclaimers that apply to the journal pertain.
References
- Aptekar L. A comparison of the bicoastal disasters of 1989. Behavior Science Research. 1990;24(1–4):73–104. [Google Scholar]
- Beady CH, Jr, Bolin RC. The role of the black media in disaster reporting in the black community Working Paper No. 56. Boulder, CO: Institute for Behavioral Science, University of Colorado; 1986. [Google Scholar]
- Blaikie P, Cannon T, Davis I, Wisner B. At risk: Natural hazards, people’s vulnerability, and disasters. London, UK: Routledge; 1994. [Google Scholar]
- Bloomfield J, Smith M, Thompson N. Hot nights in the city: Global warming, sealevel rise and the New York metropolitan region. Washington, D.C: Environmental Defense Fund; 1999. [Google Scholar]
- Bolin R. Disaster impact and recovery: A comparison of black and white victims. International Journal of Mass Emergencies and Disasters. 1986;4(1):35–50. [Google Scholar]
- Bryant B, editor. Environmental justice: Issues, policies, and solutions. Washington, DC: Island Press; 1995. [Google Scholar]
- Bullard RD, editor. Unequal protection: Environmental justice and communities of color. San Francisco CA: Sierra Club Books; 1994. [Google Scholar]
- Chakraborty J, Armstrong MP. Exploring the use of buffer analysis for the identification of impacted areas in environmental equity assessment. Cartography and Geographic Information Systems. 1997;24(3):145–157. [Google Scholar]
- Coch NK. Hurricane hazards in the Northeast U.S. Journal of Coastal Research, Special Issue. 1994;12:115–147. [Google Scholar]
- Cooper F, Laughy L. Managing hazards in a changing multinational world. 1994. Unpublished manuscript. [Google Scholar]
- Cutter S, Mitchell J, Scott M. Handbook for conducting a GIS-based hazards assessment at the county level. 1997. Prepared for South Carolina Emergency Preparedness Division Office of the Adjutant General. [Google Scholar]
- Cutter S, Hodgson M, Dow K. Subsidized inequities: The spatial patterning of environmental risks and federally assisted housing. Urban Geography. 2001;22:29–53. [Google Scholar]
- Cutter SL, editor. Hazards, Vulnerability and Environmental Justice. London, UK: Earthscan; 2006. [Google Scholar]
- Dhesi N. The social impacts of the 1906 and 1989 earthquakes. Unpublished manuscript, Boulder, CO: University of Colorado; 1991. [Google Scholar]
- Eicher C, Brewer C. Dasymetric mapping and areal interpolation: implementation and evaluation. Cartography and Geographic Information Science. 2001;28:125–138. [Google Scholar]
- Environmental Systems Research Institute (ESRI) ArcGIS 9.1. Redlands; California, USA: 2005. [Google Scholar]
- Federal Emergency Management Agency (FEMA) The 100-year base flood standard and the floodplain management executive order: A review. Washington DC: U.S. Printing Office; 1983. Prepared for the Office of Management and Budget. [Google Scholar]
- Federal Emergency Management Agency (FEMA) HAZUS: FEMA’s software program for estimating potential losses from disasters, FAQ [WWW page] 2006 www.fema.gov/plan/prevent/hazus/
- Fielding J, Burningham K. Environmental inequality and flood hazard. Local Environment. 2005;10(4):379–395. [Google Scholar]
- Fothergill A, Maestas EGM, Darlington J. Race, ethnicity and disasters in the United States: A review of the literature. Disasters. 1999;23(2):156–173. doi: 10.1111/1467-7717.00111. [DOI] [PubMed] [Google Scholar]
- Forster BC. An examination of some problems and solutions in monitoring urban areas from satellite platforms. International Journal of Remote Sensing. 1985;6(1):139–51. [Google Scholar]
- Goltz JD, Russell LA, Bourque LB. Initial behavioral response to a rapid onset disaster: a case study. International Journal of Mass Emergencies and Disasters. 1992;10(1):43–69. [Google Scholar]
- Goodchild M, Anselin L, Deichmann U. A framework for the areal interpolation of socioeconomic data. Environment and Planning A. 1993;25:383–397. [Google Scholar]
- Gornitz V. Climate Change and a Global City: An Assessment of the Metropolitan East Coast (MEC) Region Coastal Zone Sector Report: Sea Level Rise and Coastal Hazards. (June 8, 2000) [WWW page] 2000 http://metroeast_climate.ciesin.columbia.edu/
- Gornitz V, Couch S, Hartig E. Impacts of sea level rise in the New York City metropolitan area. Global and Planetary Changes. 2002;32:61–88. [Google Scholar]
- Greenberg M. Proving environmental inequity in siting locally unwanted land uses. Journal of Risk - Issues in Health and Safety. 1993;4(3):235–252. [Google Scholar]
- Hofrichter R, editor. Toxic Struggles: The Theory and Practice of Environmental Justice. Philadelphia, PA: New Society Publishers; 1993. [Google Scholar]
- Holloway SR, Schumacher J, Redmond RL. People and place: Dasymetric mapping using Arc/Info. In: Morain S, editor. GIS Solutions in Natural Resource Management. Santa Fe, NM: OnWord Press; 1999. pp. 283–291. [Google Scholar]
- Holt JB, Lo CP, Hodler TW. Dasymetric Estimation of Population Density and Areal Interpolation of Census Data. Cartography and Geographic Information Science. 2004;31:103–121. [Google Scholar]
- Johnston BR, editor. Who Pays the Price? The Sociocultural Context of Environmental Crisis. Washington, DC: Island Press; 1994. [Google Scholar]
- L. R. Johnston Associates. Prepared for Interagency Task Force on Floodplain Management. Washington, DC: Federal Emergency Management Agency; 1989. A Status Report on the Nation’s Floodplain Management Activity: An Interim Report. [Google Scholar]
- Langford M, Unwin D. Generating and mapping population density surfaces within a geographical information system. Cartographic Journal. 1994;31:21–6. [PubMed] [Google Scholar]
- LotInfo LLC. LotInfo. SpaceTrack, Inc.; 304 Park Ave, 11th Floor New York, NY 10010: 2001. [Google Scholar]
- Maantay JA, Ziegler J. Geographic information systems for the urban environment. Redlands, CA: Environmental Systems Research Institute Press; 2006. [Google Scholar]
- Maantay JA. Asthma and Air Pollution in the Bronx: Methodological and Data Considerations in Using GIS for Environmental Justice and Health Research. Health and Place. 2007;13:32–56. doi: 10.1016/j.healthplace.2005.09.009. [DOI] [PubMed] [Google Scholar]
- Maantay JA, Maroko A, Herrmann C. Mapping population distribution in the urban environment: The cadastral-based expert dasymetric system (CEDS) Cartography and Geographic Information Science. 2007;34(2):77–102. [Google Scholar]
- Mennis J. Generating Surface Models of Population Using Dasymetric Mapping. The Professional Geographer. 2003;55(1):31–42. [Google Scholar]
- Meyer WB. Bringing hypsography back in altitude and residence in American Cities. Urban Geography. 1994;15(6):505–513. [Google Scholar]
- Meyer WB. The poor on the hilltops? The vertical fringe of a late nineteenth-century American city. Annals of the Association of American Geographers. 2005;95(4):773–788. [Google Scholar]
- Mitchell JK. Crucibles of Hazard: Megacities and disasters in transition. United Nations University Press; Tokyo: 1999. [Google Scholar]
- Morello-Frosch R, Pastor M, Sadd J. Environmental justice and southern California’s “riskscape”— The distribution of air toxics exposures and health risks among diverse communities. Urban Affairs Review. 2001;36(4):551–578. [Google Scholar]
- Morrow BH. Stretching the Bonds: The Families of Andrew. In: Peacock WG, Morrow BH, Gladwin G, editors. Hurricane Andrew: Ethnicity, Gender, and the Sociology of Disasters. New York: Routledge; 1997. pp. 141–169. [Google Scholar]
- Negri A, Burkardt N, Golden J, Halverson J, Huffman G, Larsen M, McGinley J, Updike R, Verdin J, Wieczorek G. The hurricane–flood–landslide continuum. Bulletin of the American Meteorological Society. 2005;86(9):1241–1247. [Google Scholar]
- Neumann CM, Forman DL, Rothlein JE. Hazard screening of chemical releases and environmental equity analysis of populations proximate to toxic release inventory facilities in Oregon. Environmental Health Perspectives. 1998;106(4):217–226. doi: 10.1289/ehp.98106217. [DOI] [PMC free article] [PubMed] [Google Scholar]
- O’Neill MS, Jerret M, Kawachi I, Levy J, Cohen AJ, Gouvela N, Wilkinson P, Fletcher T, Cifuentes L, Schwartz J. Health, wealth, and air pollution: advancing theory and methods. Environmental Health Perspectives. 2003;111(16):1861–1870. doi: 10.1289/ehp.6334. [DOI] [PMC free article] [PubMed] [Google Scholar]
- Sigma Xi. Confronting climate change: Avoiding the unimaginable and managing the unavoidable. Executive Summary. Scientific Expert Group Report on Climate Change and Sustainable Development; Prepared for the 15th Session of the Commission on Sustainable Development. United Nations Foundation.2007. [Google Scholar]
- Sleeter R. Dasymetric mapping techniques for the San Francisco Bay region, California. Urban and Regional Information Systems Association Annual Conference Proceedings; Reno, Nevada. November 7–10, 2004.2004. [Google Scholar]
- Trainer P, Hutton J. An approach to the differential distribution of deaths and disaster; Paper presented at the meeting of the Midwest Council on Social Research in Aging; Kansas City. 1972. [Google Scholar]
- Turner BL, II, Kasperson R, Matson P, McCarthy JJ, Corell RW, Christensen L, Eckley N, Kasperson JX, Luers A, Martello ML, Polsky C, Pulsipher A, Schiller A. Framework for Vulnerability Analysis in Sustainability Science Proceedings. National Academy of Sciences of the United States of America. 2003;100(14):8074–8079. doi: 10.1073/pnas.1231335100. [DOI] [PMC free article] [PubMed] [Google Scholar]
- Ueland J, Warf B. Racialized topographies: Altitude and race in southern cities. Geographical Review. 2006;96(1):50–78. [Google Scholar]
- United States Geological Survey (USGS) Fact sheet 2006: Flood hazards—a national threat. U.S. Department of the Interior/U.S. Geological Survey.; 2006. [Google Scholar]
- United States Environmental Protection Agency (USEPA) Draft Strategy on Environmental Justice. Accessed from Environmental Justice FAQ. 1995 [WWW page]. www.epa.gov/compliance/resources/faqs/ej/
- White HL. Race, class, and environmental hazards. In: Camacho DE, editor. Environmental Injustices, Political Struggles: Race, Class, and the Environment. Durham, NC: Duke University Press; 1998. pp. 61–81. [Google Scholar]
- Willie CV. Land elevation, age of dwelling structure, and residential stratification. The Professional Geographer. 1961;13(3):7. [Google Scholar]
- Wu S, Qiu X, Wang L. Population estimation methods in GIS and remote sensing: A review. GIScience and Remote Sensing. 2005;42(1):80–96. [Google Scholar]


