

Abstract
The σ subunit of bacterial RNA polymerase (RNAP) regulates gene expression by directing RNAP to specific promoters. Unlike σ70-type proteins, the alternative σ factor, σ54, requires interaction with an ATPase to open DNA. We present the solution structure of the C-terminal domain of σ54 bound to the –24 promoter element, in which the conserved RpoN box motif inserts into the major groove of the DNA. This structure elucidates the basis for sequence specific recognition of the –24 element, orients σ54 on the promoter, and suggests how the C-terminal domain of σ54 interacts with RNAP.
Introduction
The sigma (σ) subunit of RNA polymerase (RNAP) is a key regulator of gene expression in bacteria. The σ-factor controls transcription initiation by directing RNAP binding to specific promoter sequences and "melting" the double-stranded DNA 1; 2. Unlike the σ70-RNAP, σ54-RNAP requires interaction with an upstream activator protein3. This activator is an AAA+-ATPase that couples promoter opening to ATP hydrolysis4. Thus, understanding the details of σ54-dependent transcription will help us understand more broadly the process of DNA opening. Further, σ54-dependent transcription is important for the virulence of many plant and animal pathogens, such as Borrelia burgdorferi5, the agent of Lyme disease, and Vibrio cholerae6, a major cause of mortality in developing countries.
To date only relatively low resolution information from electron microscopy has been available for σ54 7; 8. The σ70 –type proteins have been structurally well-characterized by x-ray crystallography9; 10; 11. However, the structures determined for σ70 are of little aid in understanding how σ54 functions because there is no apparent sequence similarity between σ54 and σ70. Therefore the details of σ54-dependent transcription are still unknown, including the basic question of how σ54 recognizes and binds its promoter DNA.
The σ54 promoter element contains two highly conserved sequences centered at -12 and -24 basepairs upstream of the start site of the gene 12(Figure 1B). The C-terminal region of σ54 (the last 53 residues) has been shown to be essential for binding these sequences13. Further, the RpoN box (Figure 1A: boxed), nine highly conserved amino acids found at the C-terminal end in all σ54 proteins, has been shown by DNA cleavage assays to be near the -24 promoter element during transcription initiation14. However, the minimal DNA-binding domain for σ54 was unknown. We recently solved the structure of the C-terminal domain from Aquifex aeolicus alone (less nine C-terminal residues) and found that it forms an unpredicted helix-turn-helix (HTH) motif, similar to many DNA-binding domains15. Here we show that this domain, which we refer to as the “RpoN domain,” specifically interacts with the –24 promoter element of the σ54 binding site. We also present the high-resolution structure of this domain in complex with –24 region. This structure provides the first detailed information about how σ54 recognizes its promoter. The structure also provides insights into how the C-terminal end of σ54 interacts with RNAP and suggests a new role for this domain in promoter melting.
Figure 1.
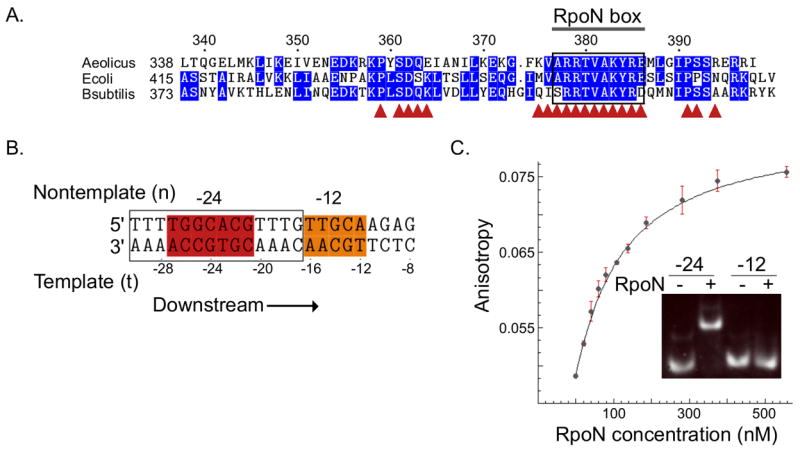
The RpoN domain binds to the –24 element (A)Protein sequence alignment of the C-terminal RpoN domain of σ54; residues conserved in two or more species are highlighted in blue. The conserved RpoN box is bracketed, and (▲) designates residues that contact DNA. (B)Nucleotide sequence of the full σ54 binding site. The -24 and -12 consensus sequences are shown in red and orange, respectively; oligonucleotide used for structure determination is boxed. (C)Changes in fluorescence anisotropy of dye-labeled -24 promoter upon titration with the RpoN domain. Inset: The RpoN domain binds to the -24 element (left) but not to the -12 element (right).
Results and Discussion
C-terminal RpoN domain binds to the –24 promoter element
We found that the last 60 residues of the Aquifex aeolicus σ54 (Figure 1A), the “RpoN domain,” bind specifically to the -24 promoter consensus sequence (Figure 1B: red) with high affinity (Kd = 114 nM ± 10 nM s.d. [n=3]; Figure 1C), but it does not interact with the -12 element (Figure 1C: inset). Throughout the article, nucleotide numbering is as shown in Figure 1B with “t” and “n” designating “template” and “nontemplate” strands, respectively.
We also found that the last nine residues of σ54 are required for high DNA binding affinity. Protein construct “B” in Supplemental Figure 1, which is missing residues Ile390 to Ile398, fails to bind to a full σ54 promoter (Supplemental Figure 1C: bottom left) To ensure that the N-terminal region of construct “B” was not inhibiting DNA binding, we also created a construct from Thr323 to Ile398 (the union of constructs “A” and “B” in Supplemental Figure 1B). This fragment only expressed in insoluble inclusion bodies but still bound the -24 element when the protein was refolded in the presence of DNA (data not shown).
Structure of RpoN domain-DNA complex
We then solved the structure of the RpoN domain (Figure 1A) in complex with a 14-basepair oligonucleotide (Figure 1B: boxed) that includes the -24 consensus promoter element 5'-GGCACG-3'. We used a combination of 15N, 13C-edited and 13C-filtered experiments with 1377 distant restraints, including 70 intermolecular restraints between the protein and the DNA (Table 1). Examples of the data used to obtain intermolecular restraints are shown in Figure 3A. The structure converged well (Figure 2B); the superposition of the final 20 structures has an r.m.s.d. from the mean structure of 0.48 Å ± 0.13 Å s.d. for DNA heavy atoms and protein backbone and 0.76 Å ± 0.13 Å s.d. for all heavy atoms (Table 1). Statistics for the final ensemble of structures is presented in Table 1.
Table 1.
Structural statistics for the RpoN-DNA complex1
| NMR distance & dihedral restraints | <SA> |
|---|---|
| R.m.s. deviation from NOE interproton distance restraints (Å) | |
| All (1377) | 0.052 ± 0.002 |
| Protein sequential (|i−j|=1) (296) | 0.043 ± 0.005 |
| Protein medium range (1 < |i−j| < 5) (319) | 0.033 ± 0.002 |
| Protein long range (|i−j| > 4) (153) | 0.039 ± 0.004 |
| Protein intraresidue (188) | 0.034 ± 0.006 |
| DNA (351) | 0.079 ± 0.002 |
| DNA-protein (70) | 0.056 ± 0.005 |
| R.m.s. deviations from hydrogen bonding restraints hydrogen bonds2 | 0.081 ± 0.006 |
| Protein (10) | 0.055 ± 0.006 |
| DNA (68) | 0.055 ± 0.006 |
| R.m.s. deviations of dihedral angle restraints (°)3 | 0.147 ± 0.125 |
| Deviations from idealized geometry | |
| Bond lengths (Å) | 0.005 ± 0.001 |
| Bond angles (º) | 0.776 ± 0.008 |
| Impropers (º) | 0.459 ± 0.016 |
| Average pairwise r.m.s.d. (Å)4 | |
| Protein backbone plus DNA heavy | 0.43 ± 0.12 |
| All protein heavy atoms plus DNA heavy | 0.73 ± 0.10 |
| Protein backbone | 0.28 ± 0.06 |
| All protein heavy atoms | 0.82 ± 0.09 |
| DNA heavy atoms | 0.42 ± 0.12 |
| Procheck statistics | |
| Residues in the most favored region | 77.0% |
| Residues in additional allowed region | 17.3% |
| Residues in the generously allowed region | 5.7% |
| Residues in disallowed region | 0.0% |
<SA> are the 20 simulated annealing structures (from 50 starting structures) with the lowest overall minimization energy with XPLOR-NIH, no distance violation > 0.5 Å, and no dihedral angle violation > 5°. After restrained simulated annealing with the AMBER 1994 force field, the 20 structures have an r.m.s.d. from the mean structure of 0.61 Å ± 0.15 Å and 1.18 Å ± 0.22 Å for protein backbone/DNA heavy atoms and all heavy atoms, respectively; average r.m.s.d. from the NOE interproton distance restraints is 0.028 Å ± 0.007 Å.
For the protein, hydrogen bond restraints were defined from slowly exchanging amide protons and added at the end of refinement. To maintain Watson-Crick hydrogen bonding, four and six distant restraints were added at the end of refinement for A-T and G-C base pairs, respectively.
For the protein, 18 JHNHA coupling constants were converted to phi dihedral restraints using the Karplus curve. For the DNA, 130 loose dihedral restraints that are compatible with A- and B-DNA for were added.
R.m.s.d values are calculated from the mean structure. For the protein, all residues were used, expect for the two N-terminal and the last C-terminal residues. For the DNA, only residues at the protein interface, nucleotides −30 to −22, were included in the calculation.
Figure 3.
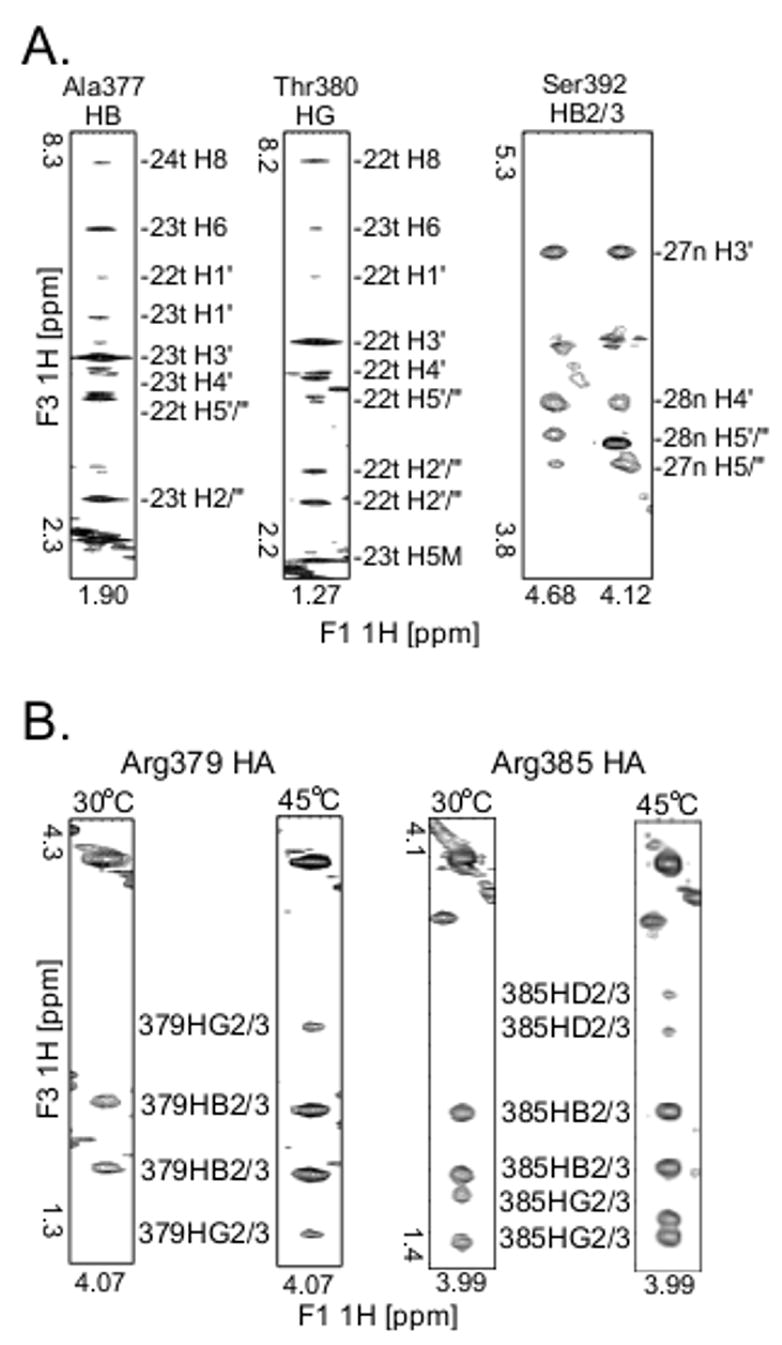
Examples of key NMR data (A) Panels from the 3D [F1] 13C-edited [F3] 13C-filtered HSQC-NOESY spectrum used to obtain intermolecular restraints between the RpoN domain and the DNA. The identity of each amino acid proton is above the panel and the identity of each DNA proton is labeled on the side. (B)Panels from the 3D HCCH-TOCSY experiment illustrating the significant line-broadening seen for Arg 378 and Arg379 side chains (left) in comparison to other arginines in the RpoN domain (right). Left: Panels for the HA of RpoN box residue Arg379 at 30°C and 45°C; at 30°C we could assign only the HA and HB for Arg379, but at 45°C we could assign all aliphatic atoms for this side chain. Right: Panels for the HA of Arg385 showing an example of the typical peak intensities seen for arginines in the RpoN domain-DNA complex. For each arginine residue, except Arg378 and Arg379, a cross peak from HA to HD (labeled 385HD2/3) was observed in the HCCH-TOCSY spectrum at 45°C.
Figure 2.
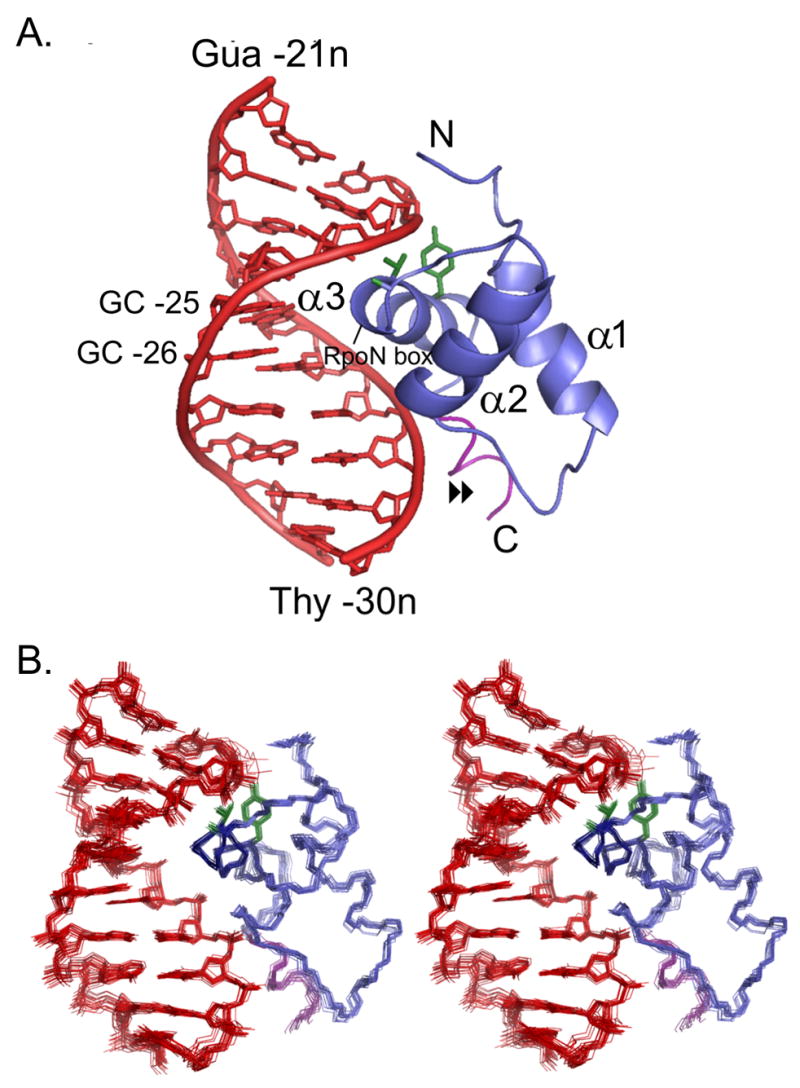
Solution structure of the RpoN-DNA complex (A)Ribbon diagram of the RpoN domain (blue) complexed with the –24 promoter (red). The highly conserved pair of guanines (-25 and -26) and the RpoN box are indicated; residues making hydrogen bonds with the DNA in all 20 structures are green sticks; (▶▶) points to the C-terminal segment (purple) required for binding; and, the three α-helices of the RpoN domain are labeled, starting at the N-terminus. (B)Stereoview of 20 NMR structures of the RpoN-DNA complex (colored as in “A”).
The overall topology of the RpoN domain (Figure 2A), including the length of the loop and the angle of the helices in the HTH motif, is more similar to winged-HTH (wHTH) domains than to the basic HTH domains. In a structural homology search of the Protein Databank, four of the five top-scoring proteins were members of the wHTH family (Supplemental Table). However, unlike wHTH proteins, the RpoN domain does not have β-strand elements or a “wing” at the C-terminal end. In place of the “wing”, the RpoN domain has a novel short helical segment (Figure 2A: arrow). The function of this extension is highly similar to that of a “wing,” stabilizing the first loop of the domain via hydrogen bonds and hydrophobic interactions16. Also like many “wings,” this is essential for DNA binding affinity. Removing this helix (the last nine residues of the protein) reduces DNA affinity greater than 100-fold (see above and Supplemental Figure 1). DNA contacts along this C-terminal segment include potential hydrogen bonds between Ser361 and Thy –29n along the backbone and between Arg394 and Thy –29n in the minor groove (Figure 5). Thus, the RpoN domain is a hybrid between the basic HTH and wHTH proteins.
Figure 5.
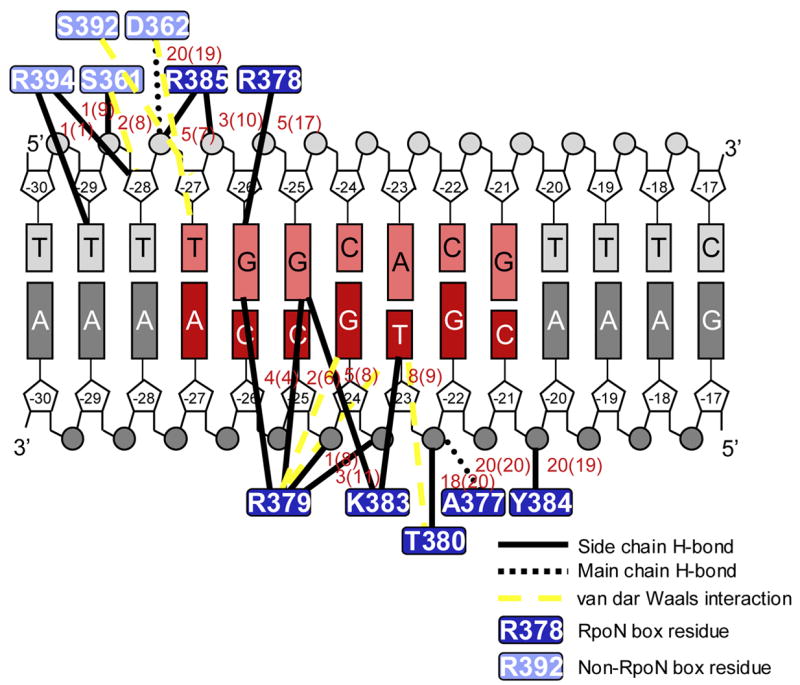
Cartoon representation of protein-DNA interactions. The -24 consensus sequence is in red with the template strand (bottom strand) shaded darker than the non-template strand (top strand). The number of times the hydrogen bond appeared in the ensemble of 20 structures before (and after refinement in the AMBER 1994 force field) is given next to each line black line.
Role of RpoN box residues in DNA binding
The highly conserved RpoN box (Figure 1A: boxed) forms the recognition helix of the HTH motif (Figure 2A) that is inserted into the major groove at the center of the -24 promoter element. Alanine mutations of positively charged and aromatic residues of the conserved RpoN box (bold: 377-ARRTVAKYRE-386) have previously been shown to reduce dramatically in vitro DNA binding and transcriptional activities to ≤ 20% and ≤ 30% the activities of wild-type proteins, respectively17. The RpoN domain-DNA structure presented here clearly shows how each of these residues and others of the RpoN box function in DNA binding and promoter recognition. Protein-DNA interactions are summarized in Figure 5.
At the N-terminal end of the recognition helix, Ala377’s amide and Thr380’s hydroxyl group (Figure 4A) form hydrogen bonds with the phosphate of Thy -23t. We could observe the hydrogen bonding for both of these hydrogens, as the hydroxyl hydrogen of Thr380 was clearly present in H2O-NOESY spectra and the amide hydrogen of Ala377 showed slow exchange with D2O (data not shown). The aliphatic hydrogens of Thr380 are then oriented to make van der Waals interactions with the methyl group of Thy -23t (Figure 4A). Although not detected directly in NOESY spectra, in all 20 structures the hydroxyl hydrogen of Tyr384 also forms a hydrogen bond along this side of the DNA backbone (Figure 4A), specifically with the phosphate (O3*) of Cyt -21t. These three hydrogen bonds all occur along the downstream side of the template strand (Figure 2A).
Figure 4.
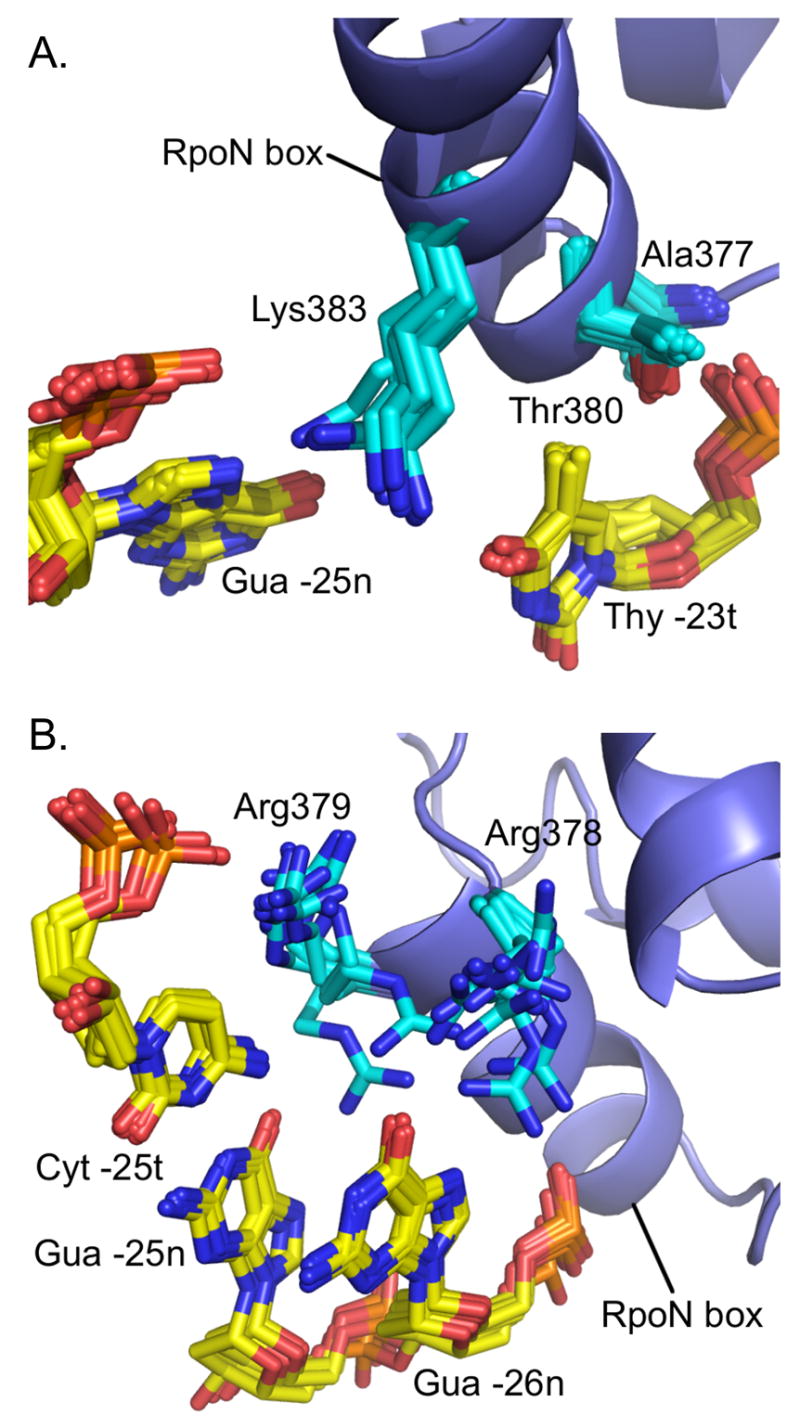
Key interactions in the major groove between highly conserved RpoN box residues and the –24 consensus sequence. Designated side chains (blue) and bases (yellow) are shown as sticks with 20 and 10 lowest energy structures overlayed in A and B, respectively. The RpoN box helix is represented as a blue ribbon.
The hydrogen bonding network described above positions Lys383 in the major groove where it can make hydrogen bonds with either O4 of Thy -23t or N7 of Gua -25n (Figure 4A). The configuration of Lys383 is strikingly similar to the configuration of Lys50 in the x-ray crystal structure of the eukaryotic engrailed homeodomain mutant, Q50K, bound to DNA18. In that structure, electron density revealed two conformations for Lys50 (Supplemental Figure). As with the RpoN domain lysine, the homeodomain lysine hydrogen bonds to either a thymine (Thy4) or guanine (Gua6) on opposite strands of the DNA.
The highly conserved arginines of the RpoN box, Arg378 and Arg379, are also in the major groove at the center of the -24 element. They are positioned to make multiple hydrogen bonding and ionic interactions, including potential hydrogen bonds with the conserved guanines, Gua -25n and Gua -26n (Figure 4B). In 4 of the 20 structures, Arg378 hydrogen bonds to O6 of Gua -26n. In 2 others, it hydrogen bonds with N7 of Gua -26n. Arg379 shows hydrogen bonds with O6 of Gua -25n; N7 and O6 of Gua -26n; and, the phosphate backbone of Gua -24t and Cyt -25t. The number of structures containing these interactions significantly increased when the structures were refined with the AMBER force field; specific values before and after AMBER refinement are given in Figure 5.
Both Arg378/Arg379 backbone and side chains are dynamic on the chemical shift timescale (10−6 to 10−1 sec), consistent with the possibility of multiple interactions between the side chains and the major groove. At 30°C all aliphatic atoms for the arginines in the RpoN domain could be assigned (Figure 3B: right), except for Arg378 and Arg379. At 45°C the crosspeaks for Arg378 and Arg379 sharpened considerably (Figure 3B: left). At this higher temperature we could completely assign Arg378 and Arg379 since their cross peaks were well-dispersed in the 3D HCCH-TOCSY spectrum. The backbone at Arg378/379 also shows significant line-broadening at 30°C. The peak volumes of Arg378 and Arg379 amide crosspeaks in the 15N-HSQC spectrum (6 and 7, respectively) were considerably more than one standard deviation lower than the average cross peak volume of 29 ± 15 s.d. In addition, both guanines (Gua -25n and Gua -26n) that interact with Arg378 and Arg379 are also severely exchanged broadened in the protein-DNA complex, but not in the DNA alone (data not shown). Other residues at the protein-DNA interface that showed significant line-broadening in the 15N-HSQC spectrum at 30°C were Ser361, Asp362, Gln363, Lys375, Ala377, Val381, and Lys383.
The line-broadening of Arg378 and Arg379 reduced the number of intermolecular restraints obtained for this region, preventing us from having detailed information on the different subpopulations present. Future mutational experiments may determine which specific conformations dominate in solution. However, the motion present in this region appears to be critical to the function of the RpoN domain because this pair of arginines (Arg378/Arg379) is found in 98.9% of 182 σ54 sequences analyzed and the pair of guanines (Gua -24t/Gua -25t) is found in 99% of 186 promoters analyzed. Further, mutation of either guanine reduces promoter activity to ≤ 6 % the activity of a wild-type promoter19, and mutations in either arginine reduce DNA binding to ≤20% the binding activity of wild-type protein17.
Comparison with Region 4 of σ70-type factors
The structure of the RpoN domain-DNA complex enables the first structural comparison of σ54 polymerase subunit with the better-characterized σ70 factors. Despite lack of sequence homology between the C-terminal RpoN domain of σ54 and the C-terminal Region 4 domain of σ70 (PDB ID 1KU7) 11; 15, both domains form similar three-helical HTH motifs with an r.m.s.d. of 2.5 Å between the two structures over 44 amino acids (Figure 6A). The data presented here also show that the RpoN domain of σ54 functions similarly to Region 4 of σ70. Like Region 4, the RpoN domain binds specifically to the upstream consensus element (-24 element for σ54 -type proteins and the -35 element for the σ70-type proteins). Further, both proteins recognize their consensus element via a recognition helix inserted into the major groove 11; 15 (Figure 6A).
Figure 6.
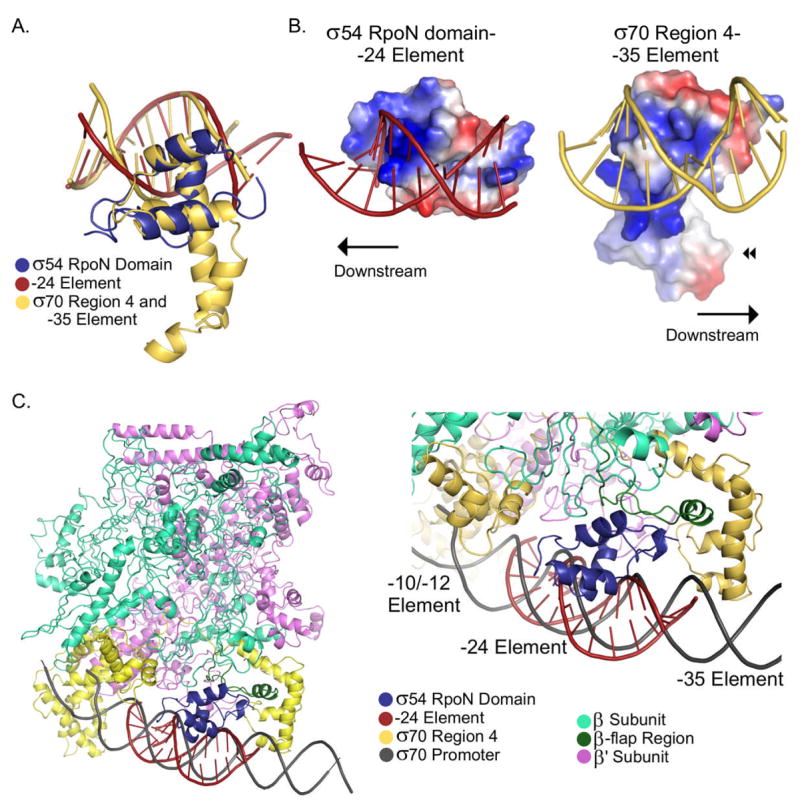
Comparison σ54 RpoN domain with σ70 Region 4 (A)Superposition of the CA backbone of the σ54 RpoN domain and σ70 Region 4. In all images, the RpoN domain and -24 element are in blue and red, respectively. Region 4 and the -35 element are in yellow. (B) Surface electrostatic potentials of the σ54 RpoN-DNA complex (left) and σ70 Region 4-DNA complex (right). Here proteins are rotated approximately −30°/−160° about the x/y-axes from the orientation in (A). (C)Model of σ54 RpoN-DNA complex on the σ70 -RNAP-holoenzyme-DNA complex. Left: The β and β' subunits are teal and violet; σ70 and its promoter are yellow and gray. Right: Close-up of the -24 region of the promoter showing the predicted interaction between the RpoN domain and the β-flap region (dark green).
A closer comparison of the σ54 RpoN domain-DNA and σ70 Region 4-DNA structures reveals significant differences between these DNA-binding domains. These structural differences affect how the domains interact with core RNAP and their promoter elements. First, the recognition helix of σ70 Region 4, which has six helical turns, is twice as long as the recognition helix of the RpoN domain, which has only three. Further, in Region 4 this long helix forms part of a hydrophobic pocket (Figure 6B:◀◀), which interacts with the flap tip helix of the β subunit of RNAP20. Instead of a hydrophobic pocket, the RpoN domain has a negatively charged surface on the face opposite the DNA-binding surface11; 15. Second, compared with the orientation of Region 4 on promoter DNA, the RpoN domain is rotated 180° about an axis parallel to the recognition helices (Figure 6B). Thus, the RpoN domain must interact with core RNAP via a different mechanism than σ70 Region 4's.
RpoN domain-DNA complex modeled onto RNAP-holenzyme-DNA structure
A different mode of interaction of σ54 with RNAP is not surprising given that the σ54 -24 element is approximately 10 basepairs downstream of the σ70 -35 element. To predict how the C-terminal domain of σ54 interacts with RNAP, we modeled the RpoN domain-DNA complex onto the x-ray crystal structure of the Thermus aquaticus RNAP-holoenzyme-DNA structure (PDB ID 1L9Z)21 by aligning the promoter DNA sequences (see Materials and Methods). This places the RpoN domain one major groove downstream of Region 4, where a small gap exists between RNAP and the DNA (Figure 6C). Although a small amount of steric clash exists between the RpoN domain and RNAP, the model correctly orients the RpoN domain on the DNA; the N-terminal end of the RpoN domain points towards the -12 promoter element, where the N-terminal half of σ54 is known to be located6.
In this model, the first loop of the RpoN domain interacts with the β-flap region of RNAP, specifically residues 781-795 and 716-719 (Figure 6C). Interestingly, Wigneshweraraj et al. (2003) found that removal of the β-flap (residues 757-786) weakens the affinity of σ54 for RNAP22. Further, the deletion mutant of RNAP was defective in initial DNA melting and properly orienting σ54 at the upstream –12 promoter element where melting occurs. Therefore, this model suggests a new role for the RpoN domain in transcription initiation: properly orienting the σ54-RNAP holoenzyme at the site of melting via its interaction with the β-flap region of RNAP. Future experiments are required to confirm this interaction and characterize the RpoN domain’s role in promoter melting.
Materials and Methods
Sample preparation of RpoN domain-DNA complex
The RpoN domain of σ54 from Aquifex aeolicus (residues 338–398) was cloned into the pSKB3 plasmid by PCR and expressed in E. coli BL21 (DE3) with Rosetta.pLysS plasmid, as previously described15. The protein fragment was purified by Ni affinity chromatography (Qiagen) and ion exchange chromatography (Heparin; Amersham Biosciences). The His-tag was cleaved with the tobacco etch virus (TEV) protease and removed by reloading the protein onto the Ni resin. Uniformly labeled 13C, 15N- and 15N-labeled lysate was prepared as previously described15. The DNA sequence used for structure determination was designed from the NirB promoter element in A. aeolicus: NirB-nontemplate 5'-TTTTGGCACGTTTG-3'; NirB-template 3'-AAAACCGTGCAAAG-5'. Oligonucleotides were prepared by the Yale DNA Synthesis Laboratory. They were purified by denaturing 20% PAGE, eluted by the “crush and soak” method, and desalted with Sep-Pak Cartridges (Waters Corporation).
NMR samples were created by mixing the protein and DNA in a 1:1 ratio in high salt (500 mM NaCl; 50 mM HEPES, pH 6.9; 2 mM EDTA). The sample was then diluted 2-fold and concentrated complex with an Amicon Ultra centrifugal concentrator (5-kDa cutoff; Milipore Corporation), for a final sample of ~ 1 mM protein-DNA in 250 mM NaCl; 25 mM HEPES, pH 6.9; 1 mM EDTA.
NMR spectroscopy and structure calculations
Samples studied for structure determination were: 13C, 15N- RpoN domain-DNA in 100% D2O; 13C, 15N- RpoN domain-DNA in 90% H2O, 10% D2O; and, 15N- RpoN domain-DNA in 90% H2O, 10% D2O. NMR data were collected at 303 K and 318 K on a Bruker DMX or Bruker Avance 600 MHz spectrometer. All data were processed with NMRPipe23 and analyzed with NMRView24. Protein backbone and side chain assignments were obtained using the 3D experiments HNCA, CBCA(CO)NH, 15N-NOESY-HSQC, 15N-TOCSY-HSQC, C(CO)NH, and HCCH-TOCSY, as well as the 2D proton DQF-COSY for the aromatic proton assignments. 1H DNA assignments were made using a 2D [F1,F2] 13C-filtered NOESY (55 ms mixing time) and a 2D [F1] 13C-filtered TOCSY recorded on the 100% D2O25. Exchangeable protons were assigned using a 2D NOESY with jump-return water suppression26 recorded on the 90% H2O sample.
Intermolecular protein distance restraints were obtained from 3D15N-NOESY-HSQC and 13C-NOESY-HSQC, both with 100-ms mixing times. Intermolecular protein-DNA distance restraints were identified with a 2D [F1] 13C-filtered NOESY25 and a 3D [F1] 13C-edited [F2] 13C, 15N-filtered HSQC-NOESY27. All these spectra were recorded with 100 ms mixing times. 3JHNHA-coupling constants were obtained from an HNHA spectrum and converted to dihedral angle restraints using the Karplus equation28. Hydrogen bond restraints for the protein were defined from slowly exchanging amide protons.
The structure of the RpoN domain was determined with the program CYANA29 using 707 manually assigned NOE restraints as input data. Starting with standard B-form DNA, the DNA was refined alone using all intramolecular NOE restraints. The structure of the RpoN domain-DNA complex was determined with the program XPLOR-NIH30 using the protocol described previously31. Briefly, the protein and DNA were randomly separated by 75 Å, creating 50 unique structures. Using only intermolecular protein-DNA NOE restraints, the protein was then docked onto the DNA with rigid-body minimization. Each of these 50 structures was then refined with simulated annealing using all NOE distant and dihedral restraints. Weak planarity restraints were applied to the six base pairs not involved in protein-DNA interactions. Loose torsion angle restraints that are consistent with A- and B- form DNA were applied to the phosphate backbone31. The simulated annealing protocol included internal torsion angle dynamics and conformational database potentials for protein and DNA dihedral angles and a DELPHIC base-base positioning database potential for the DNA32. At the end of refinement, four and six distant restraints were used to maintain Watson-Crick hydrogen bonding of A-T and G-C basepairs, respectively. The 20 structures with the lowest energy, no NOE violations > 0.5 Å, and no angle violations > 5º were chosen to represent the structure of RpoN domain-DNA complex.
To characterize further nonbonded interactions at the protein-DNA interface, the final 20 structures were then subjected to 20 ps of simulated annealing using the SANDER module of AMBER 7.033 with the 1994 force field (ff94) and the generalized Born solvent model. First, 0.5 ps of energy minimization was performed. Then simulated annealing was run from 300 K to 0 K using NMR distant and dihedral restraints, as well as a distance dependent dielectric and a nonbonding cutoff of 15 Å.
Modeling
The RpoN domain-DNA complex was modeled onto the σ70 -holoenzyme-DNA complex (PDB ID: 1L9Z) by aligning the nontemplate strands in each structure. The -24 region is approximately one major groove (nine basepairs) downstream from the -35 promoter element σ70 promoter. This aligns the -24 promoter element (5'-TTTTGGCACGTTTC'-3') with the sequence 5'-AAAAGTGTTAAATT-3' of the σ70 promoter in the σ70 -holoenzyme-DNA complex.
DNA binding assays
For gel shift assays, protein-DNA complexes were formed in 500 mM NaCl; 25 mM HEPES, pH 6.9; and, 10% glycerol. Samples were electrophoresed through a 12% polyacrylamide gel (70:1 acrylamide:bis-acrylamide) for approximately one hour at 100 V using 1X Tris-borate buffer. DNA was detected by silver-staining or SYBR Gold (Invitrogen) staining.
Binding constants were obtained by following the change in fluorescence anisotropy of labeled DNA upon titration with RpoN domain. The template strands were labeled at the 5' end with Oregon Green 488 (MWG-Biotech). Experiments were performed at 25º on a Spex Fluoromax-3 fluorimeter (JY Horiba) with Glan-Thomspon polarizers. Excitation and emission wavelengths were 494 nm and 523 nm, respectively. DNA was kept at 10 nM or 25 nM and titrated with RpoN domain to a final concentration of > 500 nM . At each time point, fluorescent emission from 9–12 scans was averaged to improve the signal-to-noise ratio. All experiments were performed in triplicate and at two different salt concentrations (60 mM and 250 mM NaCl). Binding curves were fit to a one site model.
Accession codes
Coordinates, restraints, and chemical shift assignments for the XPLOR-NIH and AMBER refined ensembles have been deposited in the PDB (http://www.rcsb.org/pdb) as accession numbers 2O8K and 2O9L, respectively. The GenPept accession numbers for the genes and gene produces mentioned in this paper are A. aeolicus RPON protein sequence (AAC06814); A. aeolicus NirB gene (AQ-206).
Supplementary Material
Acknowledgments
We thank Dr. Ann E. Maris for help with the DNA-binding assays and Dr. Junji Iwahara for help with protein-DNA docking. This work was supported by National Institutes of Health Grant GM62163 (to D. E. W.) and by a University of California fellowship (to M. D.). In addition, National Science Foundation Grants BBS8720134, 0119304 (to D. E. W.) and National Institutes of Health Grant RR15756 (to D. E. W.) provided support for the 600 and 800 Mhz spectrometers used in this research.
Abbreviations
- HTH
helix-turn-helix
- r.m.s.d
root mean square deviation
- RNAP
RNA polymermase
- s.d
standard deviation
- wHTH
winged-helix-turn-helix
Footnotes
Publisher's Disclaimer: This is a PDF file of an unedited manuscript that has been accepted for publication. As a service to our customers we are providing this early version of the manuscript. The manuscript will undergo copyediting, typesetting, and review of the resulting proof before it is published in its final citable form. Please note that during the production process errors may be discovered which could affect the content, and all legal disclaimers that apply to the journal pertain.
References
- 1.Young BA, Gruber TM, Gross CA. Views of transcription initiation. Cell. 2002;109:417–20. doi: 10.1016/s0092-8674(02)00752-3. [DOI] [PubMed] [Google Scholar]
- 2.Murakami KS, Darst SA. Bacterial RNA polymerases: the wholo story. Curr Opin Struct Biol. 2003;13:31–9. doi: 10.1016/s0959-440x(02)00005-2. [DOI] [PubMed] [Google Scholar]
- 3.Wedel A, Weiss DS, Popham D, Droge P, Kustu S. A bacterial enhancer functions to tether a transcriptional activator near a promoter. Science. 1990;248:486–90. doi: 10.1126/science.1970441. [DOI] [PubMed] [Google Scholar]
- 4.Rappas M, Bose D, Zhang X. Bacterial enhancer-binding proteins: unlocking sigma(54)-dependent gene transcription. Curr Opin Struct Biol. 2006 doi: 10.1016/j.sbi.2006.11.002. in press. [DOI] [PubMed] [Google Scholar]
- 5.Fisher MA, Grimm D, Henion AK, Elias AF, Stewart PE, Rosa PA, Gherardini FC. Borrelia burgdorferi sigma54 is required for mammalian infection and vector transmission but not for tick colonization. Proc Natl Acad Sci U S A. 2005;102:5162–7. doi: 10.1073/pnas.0408536102. [DOI] [PMC free article] [PubMed] [Google Scholar]
- 6.Correa NE, Lauriano CM, McGee R, Klose KE. Phosphorylation of the flagellar regulatory protein FlrC is necessary for Vibrio cholerae motility and enhanced colonization. Mol Microbiol. 2000;35:743–55. doi: 10.1046/j.1365-2958.2000.01745.x. [DOI] [PubMed] [Google Scholar]
- 7.Rappas M, Schumacher J, Beuron F, Niwa H, Bordes P, Wigneshweraraj S, Keetch CA, Robinson CV, Buck M, Zhang X. Structural insights into the activity of enhancer-binding proteins. Science. 2005;307:1972–5. doi: 10.1126/science.1105932. [DOI] [PMC free article] [PubMed] [Google Scholar]
- 8.Ray P, Hall RJ, Finn RD, Chen S, Patwardhan A, Buck M, van Heel M. Conformational changes of Escherichia coli sigma54-RNA-polymerase upon closed-promoter complex formation. J Mol Biol. 2005;354:201–5. doi: 10.1016/j.jmb.2005.09.057. [DOI] [PubMed] [Google Scholar]
- 9.Lane WJ, Darst SA. The structural basis for promoter -35 element recognition by the group IV sigma factors. PLoS Biol. 2006;4:e269. doi: 10.1371/journal.pbio.0040269. [DOI] [PMC free article] [PubMed] [Google Scholar]
- 10.Sorenson MK, Ray SS, Darst SA. Crystal structure of the flagellar sigma/anti-sigma complex sigma(28)/FlgM reveals an intact sigma factor in an inactive conformation. Mol Cell. 2004;14:127–38. doi: 10.1016/s1097-2765(04)00150-9. [DOI] [PubMed] [Google Scholar]
- 11.Campbell EA, Muzzin O, Chlenov M, Sun JL, Olson CA, Weinman O, Trester-Zedlitz ML, Darst SA. Structure of the bacterial RNA polymerase promoter specificity sigma subunit. Mol Cell. 2002;9:527–39. doi: 10.1016/s1097-2765(02)00470-7. [DOI] [PubMed] [Google Scholar]
- 12.Barrios H, Valderrama B, Morett E. Compilation and analysis of sigma(54)-dependent promoter sequences. Nucleic Acids Res. 1999;27:4305–13. doi: 10.1093/nar/27.22.4305. [DOI] [PMC free article] [PubMed] [Google Scholar]
- 13.Cannon W, Missailidis S, Smith C, Cottier A, Austin S, Moore M, Buck M. Core RNA polymerase and promoter DNA interactions of purified domains of sigma N: bipartite functions. J Mol Biol. 1995;248:781–803. doi: 10.1006/jmbi.1995.0260. [DOI] [PubMed] [Google Scholar]
- 14.Burrows PC, Severinov K, Ishihama A, Buck M, Wigneshweraraj SR. Mapping sigma 54-RNA polymerase interactions at the -24 consensus promoter element. J Biol Chem. 2003;278:29728–43. doi: 10.1074/jbc.M303596200. [DOI] [PubMed] [Google Scholar]
- 15.Doucleff M, Malak LT, Pelton JG, Wemmer DE. The C-terminal RpoN domain of sigma54 forms an unpredicted helix-turn-helix motif similar to domains of sigma70. J Biol Chem. 2005;280:41530–6. doi: 10.1074/jbc.M509010200. [DOI] [PubMed] [Google Scholar]
- 16.Gajiwala KS, Burley SK. Winged helix proteins. Curr Opin Struct Biol. 2000;10:110–6. doi: 10.1016/s0959-440x(99)00057-3. [DOI] [PubMed] [Google Scholar]
- 17.Wang L, Gralla JD. Roles for the C-terminal region of sigma 54 in transcriptional silencing and DNA binding. J Biol Chem. 2001;276:8979–86. doi: 10.1074/jbc.M009587200. [DOI] [PubMed] [Google Scholar]
- 18.Tucker-Kellogg L, Rould MA, Chambers KA, Ades SE, Sauer RT, Pabo CO. Engrailed (Gln50-->Lys) homeodomain-DNA complex at 1.9 A resolution: structural basis for enhanced affinity and altered specificity. Structure. 1997;5:1047–54. doi: 10.1016/s0969-2126(97)00256-6. [DOI] [PubMed] [Google Scholar]
- 19.Khan H, Buck M, Dixon R. Deletion loop mutagenesis of the nifL promoter from Klebsiella pneumoniae: role of the -26 to -12 region in promoter function. Gene. 1986;45:281–8. doi: 10.1016/0378-1119(86)90026-0. [DOI] [PubMed] [Google Scholar]
- 20.Vassylyev DG, Sekine S, Laptenko O, Lee J, Vassylyeva MN, Borukhov S, Yokoyama S. Crystal structure of a bacterial RNA polymerase holoenzyme at 2.6 A resolution. Nature. 2002;417:712–9. doi: 10.1038/nature752. [DOI] [PubMed] [Google Scholar]
- 21.Murakami KS, Masuda S, Campbell EA, Muzzin O, Darst SA. Structural basis of transcription initiation: an RNA polymerase holoenzyme-DNA complex. Science. 2002;296:1285–90. doi: 10.1126/science.1069595. [DOI] [PubMed] [Google Scholar]
- 22.Wigneshweraraj SR, Kuznedelov K, Severinov K, Buck M. Multiple roles of the RNA polymerase beta subunit flap domain in sigma 54-dependent transcription. J Biol Chem. 2003;278:3455–65. doi: 10.1074/jbc.M209442200. [DOI] [PubMed] [Google Scholar]
- 23.Delaglio F, Grzesiek S, Vuister GW, Zhu G, Pfeifer J, Bax A. NMRPipe: a multidimensional spectral processing system based on UNIX pipes. J Biomol NMR. 1995;6:277–93. doi: 10.1007/BF00197809. [DOI] [PubMed] [Google Scholar]
- 24.Johnson BA, Blevins BA. NMRView: A computer program for the visualization and analysis of NMR data. J Biomol NMR. 1994;4:603–614. doi: 10.1007/BF00404272. [DOI] [PubMed] [Google Scholar]
- 25.Iwahara J, Wojciak JM, Clubb RT. Improved NMR spectra of a protein-DNA complex through rational mutagenesis and the application of a sensitivity optimized isotope-filtered NOESY experiment. J Biomol NMR. 2001;19:231–41. doi: 10.1023/a:1011296112710. [DOI] [PubMed] [Google Scholar]
- 26.Pierre P, Gueron G. Exchangeable proton NMR without base-line distorsion, using new strong-pulse sequences. J Am Chem Soc. 1982;104:7310–7311. [Google Scholar]
- 27.Zwahlen C, Legault PFVSJ, Greenblatt J, Konrat R, Kay LE. Methods for measurement of intermolecular NOEs by multinuclear NMR spectroscopy: Application to a bacteriophage lambda N-peptide/boxB RNA complex. J Am Chem Soc. 1997;119:6711–6721. [Google Scholar]
- 28.Kuboniwa H, Grzesiek S, Delaglio F, Bax A. Measurement of HN-H alpha J couplings in calcium-free calmodulin using new 2D and 3D water-flip-back methods. J Biomol NMR. 1994;4:871–8. doi: 10.1007/BF00398416. [DOI] [PubMed] [Google Scholar]
- 29.Guntert P. Automated NMR structure calculation with CYANA. Methods Mol Biol. 2004;278:353–78. doi: 10.1385/1-59259-809-9:353. [DOI] [PubMed] [Google Scholar]
- 30.Schwieters CD, Kuszewski JJ, Tjandra N, Clore GM. The Xplor-NIH NMR molecular structure determination package. J Magn Reson. 2003;160:65–73. doi: 10.1016/s1090-7807(02)00014-9. [DOI] [PubMed] [Google Scholar]
- 31.Iwahara J, Iwahara M, Daughdrill GW, Ford J, Clubb RT. The structure of the Dead ringer-DNA complex reveals how AT-rich interaction domains (ARIDs) recognize DNA. Embo J. 2002;21:1197–209. doi: 10.1093/emboj/21.5.1197. [DOI] [PMC free article] [PubMed] [Google Scholar]
- 32.Kuszewski J, Schwieters C, Clore GM. Improving the accuracy of NMR structures of DNA by means of a database potential of mean force describing base-base positional interactions. J Am Chem Soc. 2001;123:3903–3918. doi: 10.1021/ja010033u. [DOI] [PubMed] [Google Scholar]
- 33.Case DA, Pearlman DA, Caldwell JW, Cheatham TE, III, Wang J, Ross WS, Simmerling CL, Darden TA, Merz KM, Stanton RV, Cheng AL, Vincent JJ, Crowley M, Tsui V, Gohlke H, Radmer RJ, Duan Y, Pitera J, Massova I, Seibel GL, Singh UC, Weiner PK, Kollman PA. AMBER 7.0 edit. University of California, San Francisco; San Francisco: 2002. [Google Scholar]
Associated Data
This section collects any data citations, data availability statements, or supplementary materials included in this article.