Abstract
This work focuses on the simultaneous analysis of β-blockers with multiple stereogenic centers using capillary electrochromatography–mass spectrometry (CEC–MS) with a vancomycin stationary phase. The critical mobile phase variables (composition of organic solvents, acid/base ratios) as well as column temperature and electric field strength, effecting enantioresolution and analysis time were first optimized sequentially. Next, to achieve global optimum a multivariate D-optimal design was used. Although multivariate approach did not improve enantioresolution any further, analysis time was significantly reduced. Under optimum CEC–MS conditions, all stereoisomers were resolved with resolution in the range 1.0−3.1 in less than 60 min with an average signal-to-noise (S/N) greater than 1000. The developed CEC–MS method has the potential to emerge as a screening method for analysis of multiple chiral compounds using a single protocol using the same column and mobile phase conditions, thus reducing the operation time and cost.
Keywords: Packed column CEC–MS, Vancomycin stationary phase, Simultaneous enantioseparations, Multistereogenic center β-blockers, Multivariate approach
1. Introduction
The simultaneous separation of multiple enantiomers in a single chromatographic run is a very useful approach, especially for pharmaceutical companies and clinical laboratories. Some of the advantages include: (1) the development of a single protocol for the chiral assay of structurally similar drugs using the same column and mobile phase conditions, which allows for the reduction of operation cost and time of analysis and (2) all structurally similar drugs and their chiral/achiral metabolites or intermediates can be simultaneously resolved [1].
Previous simultaneous enantioseparations have been carried out using immobilized or mobilized chiral selectors in high performance liquid chromatography (HPLC) [2–5], and capillary zone electrophoresis (CZE), respectively [4,6–13]. However, both of these methods exhibit some problems. In HPLC, there is reduced peak capacity due to poor separation efficiency. On the other hand, CZE lacks a true stationary phase, which in turn can provide lower achiral selectivity between structurally similar chiral analogs in certain cases. Furthermore, the use of low molecular weight chiral selectors often lead to source contamination when added to the mobile phase in CZE coupled to mass spectrometry (MS). The by-product of combining HPLC and CZE techniques is capillary electrochromatography (CEC) [1]. The technique of CEC when coupled to MS overcome the problems of HPLC and CZE by providing high efficiency with high selectivity [14–18], while the MS detection can provide very high sensitivity and structural information [18–20].
The CEC system can be conveniently coupled to the MS detector using an electrospray ionization (ESI) source. Therefore, to couple the CEC and MS systems a capillary with a tapered outlet side is most commonly used [21]. This taper is not the traditional, externally tapered capillary as reported by Lord et al. [22], but one that had an internal taper. The internal taper was fabricated using a method developed previously in our laboratory [23]. The internal taper has the advantages of ruggedness, improved electrospray stability with lower short-term noise. In addition, it allows for the use of much harsher mobile phases that were not usable with the externally tapered columns because of higher operating current and electrospray arcing [1,23].
Recently, there has been a trend to move away from separation strategies using sequential or univariate optimization. This is because many of the sequential optimization methods do not fully test the interactions between various experimental parameters. In addition, there is no guarantee of achieving a local optimum. For the optimization of CEC–MS conditions, the possibility that many parameters affect the separation and detection process renders an important complexity to the approach. To improve on this approach, many laboratories have adopted the use of a multivariate optimization strategy to explore all combinations of experimental variables in a reasonable amount of time with improved statistical accuracy [24–27]. For example, the tendency in recent years has been to perform sequential experiments to determine which factors are critical to the separation and analysis and over what range the factors should used to further fine-tune and explore multivariate optimization. Then, using these ranges a multivariate design of experiment (DOE) is set up to statistically explore all of the various interactions between these significant factors either fully or as a partial subset. Thus, DOE ascertains what the local optimum condition was within the ranges explored for the critical factors.
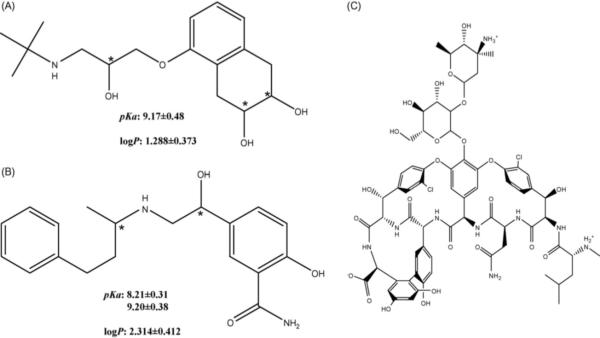
In this work, the simultaneous separation of two β-blockers (nadolol and labetalol, Fig. 1A and B) with multiple stereogenic centers was studied using a CEC–MS system. Both of these β-blockers are used to treat high blood pressure and heart disease by inhibiting the interactions of adrenaline with β-receptors in the heart. In addition, nadolol has uses in the treatment of angina, migraines, and anxiety [28], while the controlled lowering of blood pressure during anesthesia, is one of the other uses of labetalol [29]. Labetalol has two chiral centers giving four possible stereoisomers (R,R), (R,S), (S,S) and (S,R). Nadolol with three stereogenic centers would be expected to have eight stereoisomers. This is not the case because the two hydroxyl groups on the cyclohexane ring are conformationally locked in the cis-form by the bonding of the cyclohexane ring to the benzene [30]. This causes only four stereoisomers to be formed (RSR, SRS, RRS, and SSR).
Fig. 1.
Molecular structures of nadolol (A) and labetalol (B) and vancomycin (C) as stationary phase (ChemFinder, CambridgeSoft Corp ©2004). Chiral centers of nadolol and labetalol are denoted with an *. The log P and pKa values were obtained from SciFinder Scholar Version: 2006 (© 2005 American Chemical Society).
Previous work with HPLC coupled to MS and UV has had only partial success in the separation of the stereoisomers of nadolol and labetalol. In all cases of HPLC, the nadolol and labetalol are separated individually using different mobile phase conditions. Desai et. al was able to resolve all four stereoisomers of labetalol employing HPLC-UV in less than 30 min, but the researchers had to derivatize the enantiomers to achieve this [31]. In the case of nadolol, only partial resolution of three of the four isomers has been resolved by HPLC-MS in less than 25 min. by Sudhir and Wong [32].
There has been better success with employing CE-UV separations using β-cyclodextrin (β-CD) as chiral selector for both nadolol and labetalol. Bommart's lab was able to resolve all stereoisomers of both nadolol and labetalol within 30 min, but again they had to be done individually as the optimum separation conditions were different for each analyte [33]. Goel et al. [34] had much quicker separations of labetalol (less than 15 min) than Bommart's group, but they did not analyze nadolol. Our group has also used a combination of β-CD and polymeric surfactants as chiral selectors in order to simultaneously separate nadolol and labetalol stereoisomers in MEKC-UV [30]. In our case, we were able to separate almost all stereoisomers within 30 min.
Using these two β-blockers the CEC–MS system was first sequentially optimized with regards to the important parameters of mobile phase composition (including organic modifier and acid/base ratios) as well as column temperature and electric field strength. The type of sheath liquid additive was also explored. Next, using a multivariate approach, the most important mobile phase parameters (organic modifier and acid/base ratios), sheath liquid parameters (ratio of methanol-water, and percent acetic acid), and spray chamber parameters (drying gas temperature, drying gas flow rate and nebulizer pressure) were studied to maximize resolution and signal-to-noise (S/N) while minimizing run time of the nadolol and labetalol enantiomers. To the best of our knowledge, we demonstrate here for the first time the use of packed column CEC–MS for the simultaneous separation of all stereoisomers of nadolol and labetalol.
2. Materials and methods
2.1. Chemicals and samples
The 3 μm vancomycin, an 18 chiral center glycopeptide [35], chiral stationary phase (CSP) was donated by Advanced Separation Technologies, Inc. (Whippany, NJ). The racemic mixtures of nadolol and labetalol hydrochloride were purchased from Sigma–Aldrich (Milwaukee, WI). The structures nadolol, labetalol, and vancomycin stationary phase are shown in Fig. 1A–C, respectively. The HPLC grade organic solvents [acetonitrile (ACN) and methanol (MeOH)], as well as the acetic acid (HOAc), were all purchased from Fischer Scientific (Fair Lawn, NJ). Triethylamine (TEA) was purchased from Aldrich (99.5% Milwaukee, WI). The ammonium acetate (NH4OAc) was obtained from Sigma (St. Louis, MO) as a 7.5 M solution. All water used in the project was purified using a Barnstead Nanopure II Water System (Barnstead International, Dubuque, IA).
2.2. CEC–MS column fabrication
Fused silica capillaries (O.D. 363 μm × I.D. 75 μm) obtained from Polymicro Technologies, Inc. (Phoenix, AZ) were used to pack the vancomycin CSP. The first step involved the formation of an internal taper at the outlet end of the capillary that is 12 μm wide at its narrowest, which has been described elsewhere [23]. The internal taper column was slurry packed with vancomycin CSP [36,37] using a Knauer pneumatic pump (Wissenschaftliche Gerätebau, Dr. Ing. Herbert Knauer GmbH, Berlin, Germany). After the column was packed, an inlet frit was burned using a home-made frit burner.
2.3. CEC–ESI-MS instrumentation
The experiments were carried out using an Agilent capillary electrophoresis (Agilent Technologies, Palo Alto, CA) instrument hyphenated to an Agilent 1100 series single quadrupole MS. The interface of the CE to MS was made possible by a G1603A CE–MS adapter kit and a G1607 CE–ESI-MS sprayer kit also provided by Agilent Technologies. The sheath liquid was delivered to the ESI by an Agilent 1100 series HPLC pump equipped with a 1:100 splitter. All instrument controls and data analysis, including resolution calculations, was carried out using Agilent Chemstation and CE–MS add-on software (version 10.02).
2.4. Separation conditions
The capillary was first packed with the vancomycin stationary phase, then placed back on the pneumatic pump, and preconditioned for at least 2 h with the desired mobile phase. After pre-conditioning, the CEC column was placed into the CE instrument. Next, the outlet end of the capillary is inserted in the nebulizer and further conditioning was carried out by applying 12 bar of pressure to the inlet end and slowly increasing the voltage by 5 kV at 20 min intervals until reaching the maximum operating voltage of 25 kV (417 V/cm electric field strength) and a stable baseline. All injections were made electrokinetically at 6 kV for 3 s. During the separation, a 12 bar external pressure was applied to the inlet buffer vials in order to suppress bubble formation and maintain a stable current.
Based on our previous work the following ESI-MS conditions were used as a starting point for optimization [1]. The sheath liquid was MeOH/H2O (90:10, v/v) containing 50 mM NH4OAc delivered at 5.0 μL/min. ESI-MS was conducted in the positive ion mode, and the capillary voltage was +3000 V, fragmentor voltage was set at 80 V, drying gas flow rate was 5 L/min, drying gas temperature was 130 °C, and the pressure of the nebulizing gas was set at 4 psi. Because the β-blockers exist as cations in both solution and gas phases, positive [M + H]+ ions were monitored in the selective ion monitoring (SIM) mode with m/z 310.0 for nadolol and m/z 329.0 for labetalol.
All mobile phases consisted of various volumetric ratios of MeOH, ACN, HOAc, and TEA and were prepared fresh daily. The stock solutions of nadolol and labetalol analytes were prepared by dissolving in MeOH at a 1 mg/mL concentration. They were then diluted with MeOH to a running concentration of 0.1 mg/mL for each of the analytes.
2.5. Multivariate data analysis
All multivariate experimental design data analysis and calculations were carried out using Design Expert 7 software (Stat-Ease, Inc., Minneapolis, MN). This included generation of response surface models (RSM), analysis of regression coefficients at 95% confidence interval and prediction of optimum conditions of the experimental design based on the criteria of best resolution, minimum overall run time, and higher S/N.
3. Results and discussion
3.1. Sequential optimization
The stationary phase vancomycin is a glycopeptide antibiotic with 18 chiral centers and 3 shallow molecular cavities (Fig. 1C). The intermolecular interactions determining the chiral/achiral selectivity of vancomycin CSP using polar organic mode include steric interactions, hydrogen bonding, dipole interaction, ion exchange, and π–π interactions [38]. The purpose of the sequential optimization was to determine the best trade-off between resolution and analysis time.
3.1.1. Effect of organic solvents
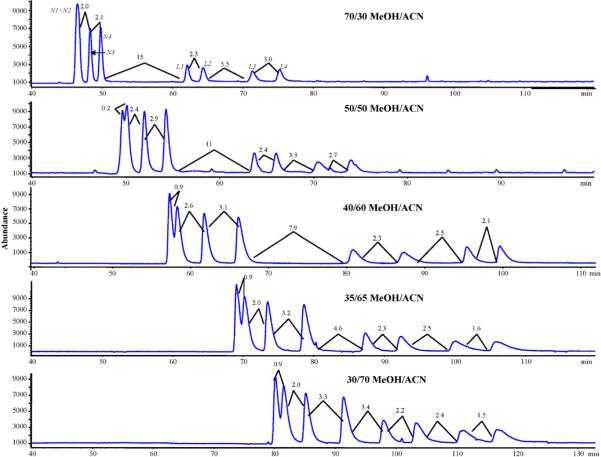
Sequential analysis began by first looking at variations in the organic modifier ratio of MeOH-to-ACN. In our previous work, we have shown how the electroosmotic flow (EOF) increases only slightly with increasing ACN fraction due to higher dielectric constant-to-viscosity ratio (εr/η) When ACN concentration was increased in the present work the retention times of both nadolol and labetalol increased, which is consistent with our previous study with other β-blockers [1]. This increasing retention is most likely due to the fact that the MeOH and ACN are competing for hydrogen bonding sites on the vancomycin CSP with the analytes. Because ACN is worse as a hydrogen bond donor than the MeOH [39], the competition with the analyte for the hydrogen bonding sites on the CSP is less at the lower amounts of MeOH. Thus, stereoisomers of both β-blockers are able to bond more strongly to the CSP by changing the MeOH/ACN from 70:30 to 30:70 while maintaining the amounts of HOAc and TEA at 1.6% and 0.2%, respectively (Fig. 2A). Several trends are noted for the enantiomeric and diastereomeric resolution of nadolol and labetalol. Increasing the retention the chiral resolution of the first two nadolol enantiomers (N1 and N2) increases from 0 to 0.9. On the other hand, the resolutions remain mostly the same between the first enantiomer pair of labetalol (L1 and L2). The second enantiomeric pair of nadolol (N3 and N4) is always baseline resolved over the range examined and resolution steadily increases as the amount of MeOH decreases and the ACN concentration increases. The opposite trend of decreasing resolution is observed for the second enantiomeric pair of labetalol (L3 and L4). However, the achiral resolution between the last eluting nadolol peak and the first eluting labetalol peak (N4/L1) also decreased as the amount of MeOH decreased. Moreover, the resolution of the critical enantiomeric pair N1 and N2 remains essentially constant by decreasing MeOH/ACN ratio from 40/60 to 70/30, but there is an increase in overall runtime by 20 min. Because 40/60 MeOH/ACN composition showed good resolution of peaks N1 and N2, and all other peaks are essentially baseline resolved with a relatively short analysis time it was chosen to be used in the next step of sequential optimization.
Fig. 2.
Sequential optimization of mobile phase composition for the simultaneous enantioseparation of nadolol (N1, N2, N3, N4) and labetalol (L1, L2, L3, L4). Mobile phase with variable amounts of methanol and acetonitrile with acetic acid and triethylamine held constant at 1.6 and 0.2% (v/v), respectively. Experimental conditions: 70 cm column (i.d. 75 μm) packed with 60 cm of VCSP; CEC electric field strength and temperature: 417 V/cm and 25 °C. Sheath liquid: 90/10 MeOH/ACN 50 mM NH4OAc; spray chamber: drying gas flow rate: 5 L/min, drying gas temperature: 130 °C, nebulizer pressure: 4 psi.
3.1.2. Effect of column temperature
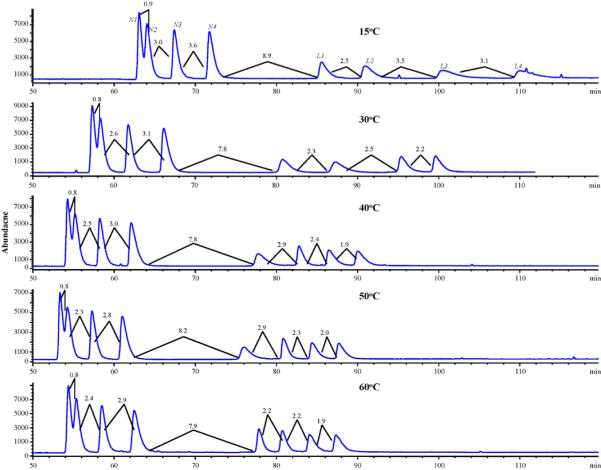
Using the mobile phase composition of 40/60/1.6/0.2 MeOH/ACN/HOAc/TEA, the next step explored the column temperature effect on the simultaneous separation of the nadolol and labetalol enantiomers. As seen in Fig. 3, the only real effects for retention times and resolutions were seen in the lower temperature range of 15−40 °C. As the temperature of the column is increased further from 40 to 60 °C, no substantial reduction in run time or improvement in resolution is seen. The best compromise between resolution and run time of nadolol and labetalol enantiomers was offered at 50 °C and this temperature was chosen as the optimized temperature.
Fig. 3.
Sequential optimization of CEC column temperature for the simultaneous enantioseparation of nadolol (N1, N2, N3, N4) and labetalol (L1, L2, L3, L4). All experimental conditions are the same as Fig. 2 except column temperature was increased from 15 to 60 °C with a mobile phase: 40/60/1.6/0.2 MeOH/ACN/HOAc/TEA % (v/v).
3.1.3. Effect of electric field strength
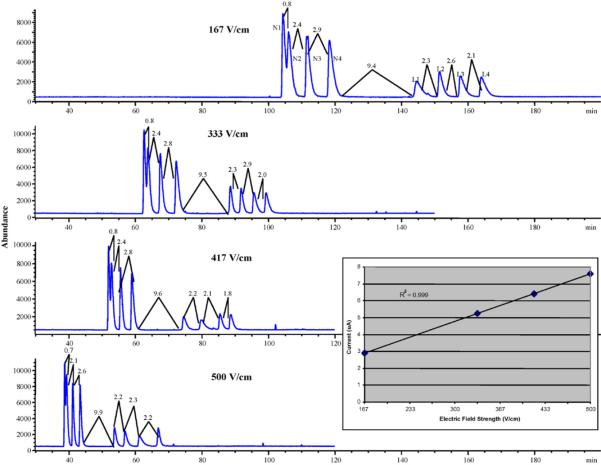
With the conditions determined from the previous two optimizations, the applied electric field strength was next examined in the range of 167−500 V/cm. Chromatograms in Fig. 4 show that the resolution of the first two enantiomers of nadolol was not affected significantly by the increase in electric field strength. On the other hand, the overall run time of the simultaneous enantioseparation of nadolol and labetalol was significantly decreased upon increasing the field strength from 167 to 500 V/cm. This decreasing runtime is expected because of the increase in electroosmotic mobility as the electric field strength is increased. The inset Ohm's law plot of Fig. 4 shows a very good linear relationship between the field strength and the current (R2 = 0.999), suggesting that there is no Joule heating effect. Because the enantiomeric resolution between N1 and N2 was decreased very slightly compared to the substantial decrease in analysis time, the electric field strength of 500 V/cm was chosen as optimum.
Fig. 4.
Sequential optimization of CEC column electric field strength for the simultaneous enantioseparation of nadolol (N1, N2, N3, N4) and labetalol (L1, L2, L3, L4). The inset shows current–electric field strength plot after measuring the current generated at each of the four field strengths studied. All other experimental conditions are the same as Fig. 2 except electrical field strength was varied from 167 to 500 V/cm at 60 °C.
3.1.4. Effect of acid–base ratio
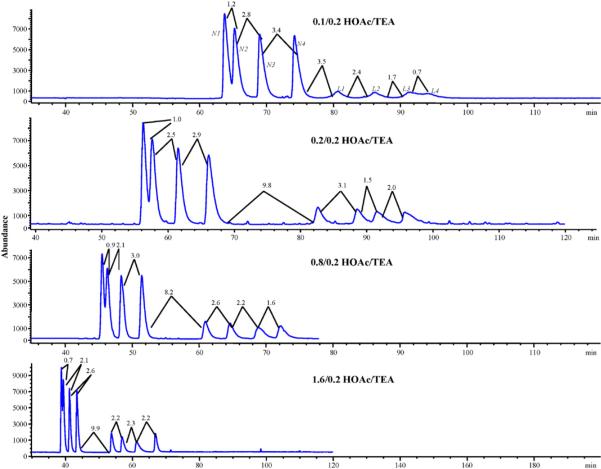
The acid–base ratio is also an important parameter in the separation of β-blockers using a vancomycin CSP [1]. Therefore, the next set of experiments tested the changes in the ratio of HOAc/TEA while holding the MeOH/ACN constant at 40/60 and the column temperature and electric field strength set at 50 °C and 500 V/cm, respectively. By varying the HOAc/TEA from 0.1/0.2 to 1.6/0.2, the chromatograms of Fig. 5 were obtained. In our previous study we saw that increasing the HOAc leads to a decrease in EOF due to the increase in salt concentration (ionic strength), which causes a decrease in zeta potential as well as an increase in mobile phase viscosity at higher salt concentration [1]. The overall trend seen in the chromatograms is that as the amount of HOAc increases, the overall run time and resolution of peaks N1 and N2 decreases. This decrease in retention is most likely due to the HOAc and TEA forming triethylammonium ions, which are competing with the analytes for weak cation exchange sites at the carboxylate groups on the vancomycin. As stated before, the increase in HOAc increases the ionic strength and thus the amount of triethylammonium ions present. Thus, the retention time of the β-blockers with the ion-exchange capability is decreased on the vancomycin CSP due to the increasing competition between the analytes and the triethylammonium ions at the carboxylate groups of the stationary phase [40]. The HOAc/TEA ratio of 0.1/0.2 showed the greatest resolution of the N1 and N2 enantiomeric pair but there was a significant loss in the resolution of the last two enantiomers of labetalol (i.e. L3 and L4). The ratio of HOAc/TEA 1.6/0.2 had a shorter overall runtime then the ratio of 0.8/0.2 but the critical resolution between peaks N1 and N2 was decreased using the former ratio. The HOAc/TEA at 0.8/0.2 was chosen as the optimum ratio because it has good resolution for the critical nadolol enantiomers N1 and N2, while all other peaks were still baseline resolved with an acceptable run time. Finally, the optimized conditions using sequential optimization were determined as follows: 40/60 MeOH/ACN containing 0.8% HOAc and 0.2% TEA; column temperature of 50 °C and applied electric field strength of +500 V/cm. With these operating conditions, simultaneous enantioseparation of nadolol and labetalol enantiomers was achieved in ∼75 min (Fig. 5, third chromatogram from top).
Fig. 5.
Sequential optimization of acid/base ratio for the simultaneous enantioseparation of nadolol (N1, N2, N3, N4) and labetalol (L1, L2, L3, L4). The mobile phase contains various ratios of acetic acid and triethylamine with methanol and acetonitrile held constant at 40/60% (v/v). All other conditions are the same as Fig. 4 except the electrical field strength was held constant at 500 V/cm.
3.2. Multivariate optimization of mobile phase parameters
Using the data from the sequential optimization, the ranges for the mobile phase optimization were determined to further reduce the analysis time. The multivariate optimization of the mobile phase was divided into the three most important factors: ratio of MeOH/ACN, percent HOAc and percent TEA. In Table 1 the high (+1) and low (−1) values for the design space are shown. These are the variable restraints between which all design points will be generated and evaluated. From these high and low values the complete set of design points corresponding to different experiments to be run are generated. Once these three parameters were input into the software, different types of experimental designs such as central composite, D-optimal and Box–Behnken were evaluated for quality and number of runs to determine the best design for the three important factors and ranges explored. This evaluation is done before running the experiments in order to determine the quality and adequacy of the possible designs. This quality determination was based on the models ability to detect effects, minimize correlation between factors, and adequately estimate coefficients for the model. The D-optimal design was chosen since it provided the same quality as the other designs but with fewer runs. The D-optimal design is one in which the design points are chosen by a D-optimality mathematical criteria which minimizes the integrated variation of the coefficients for the model, providing the most precise coefficients. Since the design points are not restrained to specific locations in the design space as they are with central composite design or Box–Behnken, the D-optimal design can sometimes provide fewer runs with equal quality as was the case here [41]. From the high and low values of Table 1, the experiments to be run were randomly generated as outlined in Table 2. Once the experiments were completed, the experimental responses (i.e., resolution and overall run time) of each experiment was calculated and input into the software for the statistical analysis.
Table 1.
Most important D-optimal experimental design factors showing high and low value restraints for the design space used for the optimization of mobile phase composition, sheath liquid composition, and spray chamber parameters
| Mobile phase optimization | Levels |
|
| Design factors |
+1 |
−1 |
| F1: methanol/acetonitrile (v/v) | 40/60 | 30/70 |
| F2: acetic acid (%) | 0.1 | 1.6 |
| F3: triethylamine (%) | 0.1 | 0.4 |
| Sheath liquid optimization | Levels |
|
| Design factors |
+1 |
−1 |
| F4: methanol/H2O (v/v) | 98/2 | 20/80 |
| F5: acetic acid (%) | 2.00 | 0.5 |
| Spray chamber optimization | Levels |
|
| Design factors |
+1 |
−1 |
| F6: drying gas flow rate (L/min) | 6 | 3 |
| F7: drying gas temperature (°C) | 220 | 120 |
| F8: nebulizer pressure (psi) | 5.0 | 2.0 |
Table 2.
The resolution and the total runtime data gathered for the D-optimal experimental design run order for multivariate optimization of mobile phase parameters
| Run | Expermental parameters |
Experimental responses |
|||||||||
|---|---|---|---|---|---|---|---|---|---|---|---|
| MeOH/CAN (%v/v) | %HOAc | %TEA | Resolution |
Run time (min) | |||||||
| N1-N2 | N2-N3 | N3-N4 | N4-L1 | L1-L2 | L2-L3 | L3-L4 | |||||
| 1 | 32.5 | 1.225 | 0.25 | 1.0 | 2.0 | 2.9 | 6.7 | 1.8 | 1.9 | 1.3 | 81 |
| 2 | 35 | 1.6 | 0.1 | 0.9 | 2.1 | 3.1 | 8.0 | 2.0 | 2.3 | 1.7 | 79 |
| 3 | 30 | 0.85 | 0.1 | 0.8 | 1.4 | 2.9 | 5.8 | 1.6 | 1.4 | 1.1 | 92 |
| 4 | 40 | 1.6 | 0.1 | 0.8 | 2.1 | 2.6 | 8.6 | 2.0 | 3.1 | 2.5 | 78 |
| 5 | 30 | 0.1 | 0.4 | 0.6 | 1.1 | 2.1 | 4.5 | 0.7 | 1.1 | 0.0 | 66 |
| 6 | 30 | 1.6 | 0.4 | 0.8 | 2.0 | 2.9 | 5.2 | 1.9 | 2.2 | 1.3 | 75 |
| 7 | 40 | 1.6 | 0.4 | 0.9 | 2.2 | 2.7 | 12 | 2.0 | 2.4 | 1.7 | 56 |
| 8 | 30 | 0.1 | 0.4 | 0.7 | 1.1 | 2.3 | 6.0 | 0.3 | 0.6 | 0.0 | 62 |
| 9 | 40 | 0.1 | 0.4 | 0.4 | 0.9 | 0.9 | 0.8 | 1.9 | 2.7 | 0.0 | 51 |
| 10 | 40 | 1.6 | 0.4 | 1.0 | 2.3 | 3.0 | 12 | 2.1 | 2.7 | 1.7 | 55 |
| 11 | 40 | 0.1 | 0.1 | 1.2 | 2.4 | 3.2 | 9.0 | 2.2 | 2.8 | 1.6 | 123 |
| 12 | 40 | 0.85 | 0.25 | 1.0 | 2.2 | 2.9 | 11 | 1.9 | 1.9 | 1.5 | 72 |
| 13 | 35 | 0.85 | 0.4 | 0.8 | 1.7 | 2.4 | 5.5 | 1.8 | 1.5 | 0.8 | 70 |
| 14 | 40 | 0.1 | 0.4 | 0.4 | 0.9 | 0.6 | 0.8 | 1.8 | 2.6 | 0.0 | 51 |
| 15 | 30 | 1.6 | 0.4 | 0.9 | 1.8 | 2.8 | 5.9 | 1.8 | 1.8 | 1.1 | 73 |
| 16 | 35 | 0.1 | 0.1 | 1.3 | 2.3 | 3.6 | 11 | 2.1 | 2.3 | 2.2 | 142 |
| 17 | 30 | 0.1 | 0.1 | 1.0 | 1.8 | 2.9 | 6.5 | 2.2 | 1.3 | 1.2 | 159 |
| 18 | 30 | 1.6 | 0.1 | 0.8 | 1.6 | 2.3 | 6.0 | 1.7 | 1.4 | 1.4 | 90 |
| 19 | 35 | 0.1 | 0.25 | 0.9 | 2.1 | 2.9 | 0.0 | 1.6 | 1.1 | 0.0 | 92 |
| 20 | 35 | 0.85 | 0.4 | 0.8 | 1.6 | 2.3 | 5.2 | 1.7 | 1.7 | 1.2 | 68 |
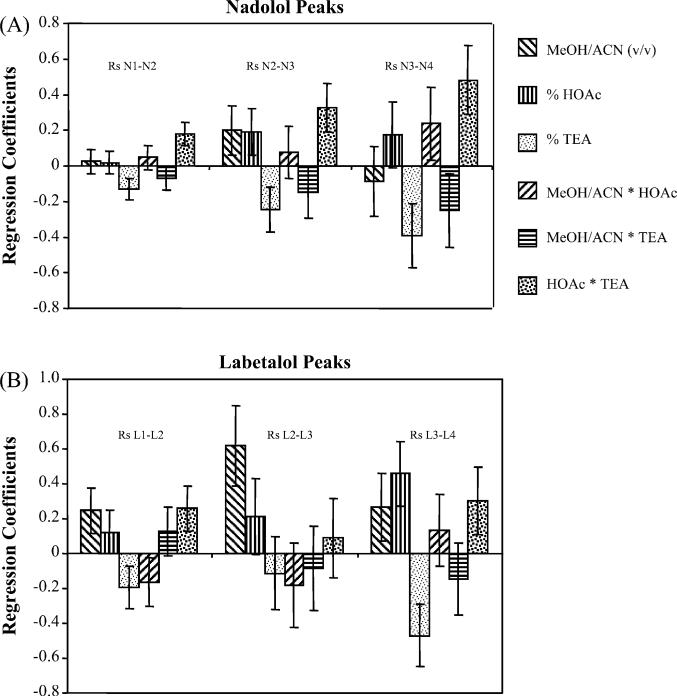
Fig. 6 represents the regression coefficient plots for the response variables with 95% confidence intervals. The size of the coefficient represents the variation in response (positive or negative) when a factor changes from 0 to +1 or 0 to −1 in coded units. If the error bars representing the 95% confidence interval are crossing the zero of the response plots than the effect of the response on the resolution is considered not significant. Looking at the bar plots (Fig. 6A andB) it can be seen that there is a difference in what affects the enantiomeric and diastereomeric resolutions. For instances, the enantiomeric resolution of N1–N2 and N3–N4 are affected most by the %TEA and the two factor cross product representing the combined effect of the TEA and HOAc together (Fig. 6A). Interestingly, the %TEA correlates negatively with the response of the enantiomeric resolution but the combined effect of HOAc and TEA correlates positively. The diastereomeric resolution (i.e. N2–N3) is affected by all of the main variables and the cross terms of the variables. In addition, the combined HOAc and TEA showed the largest positive effect. Moreover, as seen in Fig. 6B, the resolution responses of labetalol enantiomers vary both positively and negatively depending on the parameter. The diastereomeric resolution (L2–L3) was affected most by the MeOH/ACN ratio. However, the enantiomeric resolution (L1–L2) was affected most by the MeOH/ACN ratio as well as the combined effect of HOAc and TEA. In addition, the resolution of L3–L4 was dominated by the %TEA and %HOAc.
Fig. 6.
Regression coefficient plots of the response variables for resolution of the enantiomers of nadolol and labetalol at the optimum mobile phase conditions determined by the Design Expert software. Error bars showing 95% confidence interval.
The results from the D-optimal design are tabulated in Table 2. The resolution varies the least (i.e., from 0.4 to 1.3, and 0.3 to 2.2) for the first enantiomeric pairs of nadolol and labetalol, respectively. On the other hand, the variation in resolution of the second enantiomeric pairs were much higher (ΔRs = 3.0 and 2.5) for the same two β-blockers. It was also observed that lower enantiomeric resolution of both nadolol and labetalol were achieved in experiments where the base content is much higher than the acid (experiments 5, 8, 9, and 14). On the other hand, higher resolutions are seen for the nadolol and labetalol enantiomers where the acid content is higher or equal to the base content. Furthermore, in the experiments labeled as 11, 16 and 17, where the acid/base ratio are equal the longest run times are seen. A comparison between replicate experiments (labeled as 5 and 8, 7 and 10, 9 and 14 in Table 2) shows good repeatability of resolution and runtime.
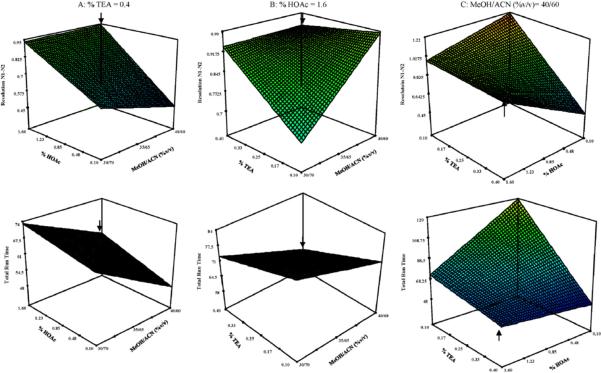
Using the Design Expert software an optimum mobile phase composition was chosen by allowing the software to minimize the overall run time while maximizing the resolution of the first critical enantiomeric pair of nadolol (N1 and N2). The resolutions of the other nadolol and labetalol stereoisomers and enantiomers were not considered for optimization in the software since in almost all of these cases baseline resolution was achieved (Table 2). From the software, an optimum mobile phase composition was described as 40/60/1.6/0.4 with a predicted resolution between peaks N1 and N2 of 0.89 and an overall runtime of 59 min. From the optimum mobile phase composition, the response surface models (RSM) of Fig. 7A–C were generated by varying two factors over the ranges tested in the experiments while holding the third factor constant at the value given by the predicted optimum. For example in Fig. 7A, the %HOAc and MeOH/ACN (%, v/v) are varied while holding the %TEA constant at 0.4%, the value generated by the software as the optimum %TEA. As illustrated in Fig. 7A, there is an increase in resolution as MeOH/ACN ratio varies from 30/70 to 40/60% and the %HOAc from 0.10 to 1.6%. A maximum resolution is obtained for N1/N2, in the presence of 40/60% MeOH/ACN and 1.6% HOAc. There is a decrease in runtime over this same range as seen in the lower plot of Fig. 7A. In Fig. 7B where the %HOAc is held constant at 1.6 and the %MeOH/ACN and %TEA are varied, there is an increase in resolution and a decrease in overall runtime as the %TEA increases and the MeOH/ACN goes from 30/70 to 40/60%. Fig. 7C shows the compromise that has to be made between runtime and resolution. In the upper plot of Fig. 7C, it can be seen that the optimum resolution would actually be at 0.1% of both HOAc and TEA. Comparing this condition on the lower plot of 7C shows that this would give a runtime of over 2 h. For this reason, a compromise between runtime and resolution at a composition of 0.4% TEA and 1.6% HOAc is chosen as a better optimum
Fig. 7.
Response surface plots of multivariate optimization of mobile phase parameters for the resolution of the first two enantiomers of nadolol and the overall run time. Optimum conditions shown by arrows of 40/60/1.6/0.4 MeOH/ACN/HOAc/TEA were determined from the Design Expert software. RSMs for resolution N1–N2 and overall runtime holding: (A) TEA constant at 0.4%, (B) HOAc constant at 1.6%, and (C) MeOH/ACN constant at 40/60% while varying the other two variables.
3.3. Multivariate optimization of ESI-MS parameters
3.3.1. Effect of the type and composition of sheath liquid
Using direct infusion of the analytes into the mass spectrometer, it is possible to test the effect of different additives to the sheath liquid. Both NH4OAc and HOAc were evaluated as sheath liquid additives in 90/10% MeOH/H2O. Replacing the NH4OAc with HOAc resulted in two- and three-fold higher mass abundance for the nadolol and labetalol, respectively (data not shown). Because of the increase in abundance, it was decided to carry out the optimization of the sheath liquid and spray chamber parameters using acetic acid.
Using the acetic acid as sheath liquid additive, a D-optimal design for two experimental factors – F4: Methanol/H2O (%, v/v) and F5: concentration of acetic acid (%, v/v), were studied to optimize the sheath liquid. The values that were entered at high (+1) and low (−1) levels as restraint for the design space for the experimental design for this part can be seen in rows 4 and 5 of Table 1. After performing 14 experiments in a random order with several replicates at +1 and −1 levels, the sheath liquid S/N ratio data was gathered as experimental responses (Table 3). The experimental responses seen in Table 3, show good reproducibility at the point where replicate experiments (labeled as runs 3 and 6, 5 and 8, 7 and 10, 9 and 13 in Table 3) were conducted. It also seems that as the MeOH/H2O ratio reaches the middle of its range (59/41%, v/v) and the %HOAc is at its lowest value (0.5%), the S/N ratio is at its lowest as seen in the experiment labeled number 11 in Table 3. Looking at experiments labeled 3, 5, 6 and 8 in Table 3, it seems that the highest S/N values occur when the percentage of MeOH is at its lowest of 20%. Unlike mobile phase optimization, there were only two factors to be explored for the sheath liquid optimization. Hence, there was no factor that was held constant.
Table 3.
The S/N ratios from the D-optimal experimental design run order for the multivariate optimization of sheath liquid parameters
| Run | Experimental parameters |
Experimental responses |
||||||||
|---|---|---|---|---|---|---|---|---|---|---|
| HOAc (%, v/v) | MeOH/H2O (%, v/v) | Signal-to-noise |
||||||||
| N1 | N2 | N3 | N4 | L1 | L2 | L3 | L4 | |||
| 1 | 1.25 | 98 | 69 | 59 | 50 | 49 | 15 | 13 | 11 | 10 |
| 2 | 0.875 | 78.5 | 129 | 109 | 112 | 108 | 41 | 39 | 31 | 30 |
| 3 | 0.5 | 20 | 149 | 112 | 101 | 102 | 57 | 51 | 43 | 41 |
| 4 | 1.625 | 78.5 | 44 | 36 | 34 | 35 | 15 | 15 | 10 | 12 |
| 5 | 2 | 20 | 184 | 197 | 142 | 142 | 74 | 66 | 53 | 54 |
| 6 | 0.5 | 20 | 150 | 110 | 100 | 101 | 56 | 50 | 42 | 40 |
| 7 | 0.5 | 98 | 94 | 89 | 76 | 82 | 24 | 21 | 14 | 19 |
| 8 | 2 | 20 | 183 | 195 | 142 | 142 | 72 | 67 | 53 | 52 |
| 9 | 2 | 59 | 64 | 57 | 55 | 51 | 25 | 23 | 18 | 18 |
| 10 | 0.5 | 98 | 90 | 89 | 77 | 83 | 24 | 21 | 16 | 17 |
| 11 | 0.5 | 59 | 32 | 29 | 26 | 27 | 14 | 12 | 10 | 10 |
| 12 | 1.25 | 20 | 96 | 77 | 70 | 73 | 31 | 27 | 21 | 26 |
| 13 | 2 | 59 | 65 | 59 | 56 | 51 | 24 | 21 | 17 | 17 |
| 14 | 1.25 | 39.5 | 90 | 86 | 72 | 76 | 37 | 29 | 25 | 25 |
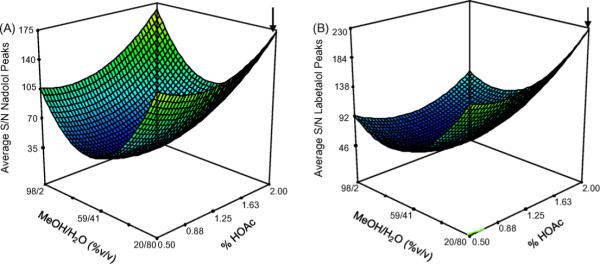
The S/N response surfaces for both nadolol and labetalol show curvature suggesting the prominence of quadratic terms and the existence of intermediate minimum. Seen in the figure the optimums for the S/N lie at the extremes of the different compositions. The presence of multiple points with significantly high S/N values seems to point to a lack of robustness for this portion of the analysis. This is most likely explained by the fact that the range over which the MeOH/H2O (%, v/v) ratio and %HOAc were analyzed was to broad leading to the appearance of other S/N ratios close to the optimum. An exploration over a narrower range of the critical factors here would have possibly shown only one distinct optimum. Therefore, the 20/80 MeOH/H2O 2.0% HOAc has a slightly higher S/N ratio than the other three highest responses at 98/2 MeOH/H2O, 0.5% HOAc, 20/80 MeOH/H2O, 0.5% HOAc and 98/2 MeOH/H2O, 2.0% HOAc for nadolol (Fig. 8A). On the other hand, the maximum S/N ratio for the labetalol peaks (Fig. 8B) corresponds to the highest composition of HOAc and the lowest composition of MeOH in the MeOH/H2O mixture.
Fig. 8.
Response surface models of multivariate optimization of sheath liquid parameters for the average S/N ratio for the (A) nadolol peaks and (B) labetalol peaks. Optimum conditions of 20/80 MeOH/H2O 2.0% HOAc (marked by arrows) was determined from the Design Expert software.
3.3.2. Effect of the drying gas flow rate, drying gas temperature and nebulizer pressure
To optimize the spray chamber parameters the D-optimal design was applied and 20 experiments were performed as constrained by the factors listed in rows 6−8 of Table 1. By allowing the software to maximize all of the S/N ratios for the eight different peaks, the optimum spray chamber parameters of nebulizer pressure of 3 psi, drying gas temperature of 220 °C, and a drying gas flow rate of 4.7 L/min was obtained. Again, there is good reproducibility of the experimental responses for the S/N ratios at replicate points (e.g. experiments 1 and 12, 4 and 7, 9 and 19 in Table 4) present in the design. The largest S/N ratio is seen in Table 4 in experiments 9 and 19 where the drying gas flow rate is low at 3 L/min, the drying gas temperature is at a middle value of 120 °C and the nebulizer pressure is high at 5 psi experiments for both the nadolol and labetalol peaks. As with the RSM for the mobile phase optimization, the RSM for the S/N optimization of the spray chamber parameters are shown with one factor held constant at the optimum while the other factors are varied over the tested range.
Table 4.
The S/N ratios from the D-optimal experimental design run order for the multivariate optimization of spray chamber parameters
| Run | Experimental Parameters |
Experimental responses |
|||||||||
|---|---|---|---|---|---|---|---|---|---|---|---|
| Drying gas flow rate (L/min) | Drying gas temperature (°C) | Nebulizer pressure (psi) | Signal-to-noise |
||||||||
| N1 | N2 | N3 | N4 | L1 | L2 | L3 | L4 | ||||
| 1 | 6 | 220 | 5 | 768 | 574 | 616 | 589 | 101 | 98 | 77 | 73 |
| 2 | 3 | 120 | 2 | 436 | 378 | 355 | 313 | 102 | 90 | 68 | 63 |
| 3 | 4.5 | 120 | 2 | 591 | 500 | 276 | 437 | 148 | 128 | 105 | 98 |
| 4 | 3 | 220 | 5 | 695 | 584 | 563 | 507 | 131 | 120 | 95 | 86 |
| 5 | 3.8 | 145 | 4 | 812 | 528 | 636 | 615 | 168 | 138 | 116 | 114 |
| 6 | 6 | 170 | 2 | 435 | 372 | 225 | 335 | 98 | 87 | 67 | 62 |
| 7 | 3 | 220 | 5 | 694 | 583 | 560 | 502 | 129 | 121 | 94 | 84 |
| 8 | 4.5 | 220 | 4 | 1270 | 1105 | 1062 | 988 | 271 | 245 | 199 | 185 |
| 9 | 3 | 120 | 5 | 1256 | 1131 | 1052 | 975 | 258 | 252 | 206 | 194 |
| 10 | 6 | 120 | 5 | 415 | 293 | 421 | 404 | 115 | 103 | 72 | 82 |
| 11 | 3 | 220 | 2 | 658 | 528 | 514 | 473 | 131 | 84 | 100 | 103 |
| 12 | 6 | 220 | 5 | 766 | 570 | 614 | 584 | 97 | 101 | 80 | 71 |
| 13 | 6 | 220 | 2 | 86 | 79 | 68 | 58 | 12 | 11 | 9 | 8 |
| 14 | 3 | 170 | 2 | 169 | 183 | 169 | 172 | 44 | 41 | 30 | 31 |
| 15 | 6 | 120 | 5 | 410 | 289 | 417 | 400 | 114 | 102 | 69 | 77 |
| 16 | 6 | 170 | 4 | 369 | 324 | 296 | 270 | 77 | 79 | 60 | 63 |
| 17 | 4.5 | 170 | 5 | 90 | 87 | 80 | 86 | 26 | 22 | 16 | 16 |
| 18 | 6 | 120 | 2 | 81 | 40.8 | 60 | 67 | 19 | 17 | 14 | 14 |
| 19 | 3 | 120 | 5 | 1260 | 1128 | 1054 | 972 | 260 | 249 | 203 | 190 |
| 20 | 4.5 | 170 | 5 | 86 | 92 | 78 | 80 | 23 | 21 | 15 | 17 |
Fig. 9A shows the effects of varying drying gas temperature and drying gas flow rate while holding the nebulizer pressure constant at 3 psi. Here a maximum S/N is obtained when the drying gas temperature is at 220 °C (the highest tested temperature), and the drying gas flow rate is at 4.7 L/min (the midrange value). In Fig. 9B, the S/N response surface shows the existence of intermediate optimum conditions for the drying gas flow rate (4.7 L/min) and nebulizer pressure (3 psi) to obtain maximum S/N. Finally, Fig. 9C shows that the S/N increases as drying gas temperature increases and reaches a saddle point at the intermediate of the nebulizer pressure. The arrows on each RSM plot indicate the maximum S/N ratio for the nadolol peaks. The RSM for the average S/N of the labetalol peaks have a similar shape as those for the nadolol (data not shown).
Fig. 9.
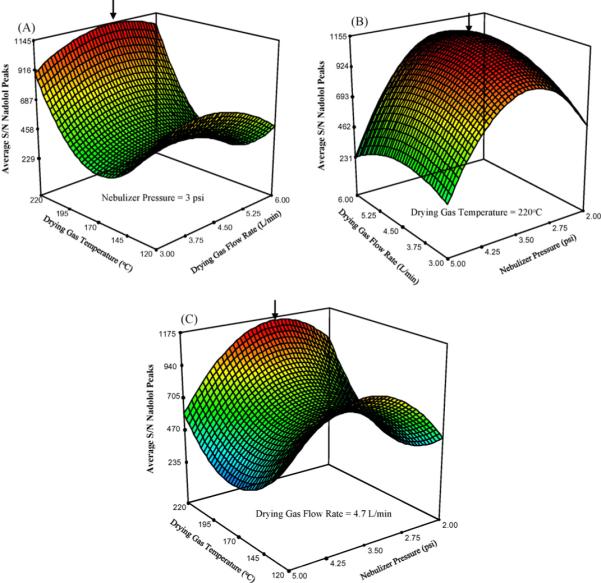
Response surface plots of multivariate optimization of spray chamber parameters for the average S/N ratio of nadolol peaks. The nebulizer pressure: 3 psi, drying gas temperature: 220 °C, and drying gas flow rate: 4.7 L/min were held constant in plot A, B and C, respectively.
3.3.3. Optimized CEC–MS
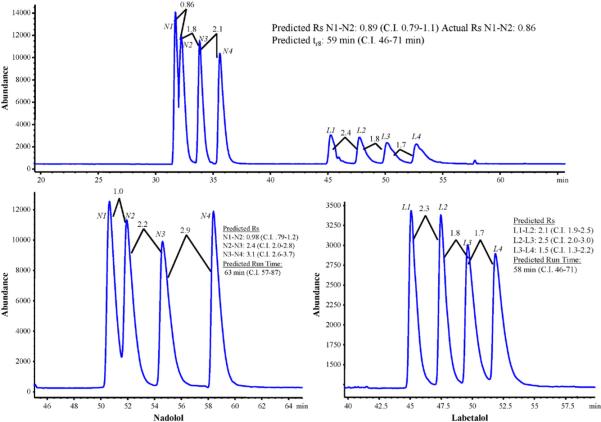
By completing runs at the suggested optimum, we can compare the actual values of run time and peak resolution to that predicted by the Design Expert software. As seen in Fig. 10, conditions for both simultaneous and independent separation of nadolol and labetalol enantiomers were identified at the suggested optimum mobile phase composition, sheath liquid composition and spray chamber parameters. The first condition includes 40/60 MeOH/ACN, 1.6 and 0.4% HOAc and TEA, respectively, which provided the actual resolution of 0.86 for peaks N1 and N2, which is very close to that of the predicted value of 0.89. However, the experimental overall runtime of 53 min was slightly shorter than the predicted value of 59 min. Nevertheless, all observed resolution and runtimes are inside the confidence intervals, which suggest the adequacy of the experimental design.
Fig. 10.
Optimum chromatograms for simultaneous (A) and individual separations of nadolol, (B) and labetalol (C). Comparisons between predicted and actual values are show in each inset with confidence intervals. Mobile Phase for (A) and (C) 40/60/1.6/0.4 MeOH/ACN/HOAc/TEA, (B) 40/60/1.6/0.1 MeOH/ACN/HOAc/TEA. Sheath liquid composition: 20/80 MeOH/H2O, 2.0% HOAc; drying gas flow rate: 4.7 L/min, drying gas temperature: 220 °C and nebulizer pressure: 3 psi.
It is also possible to find a compromise between resolution and analysis time of nadolol and labetalol enantiomers individually. Fig. 10B and C shows the optimum separations of nadolol and labetalol enantiomers for which the best results were obtained with 1.6 and 0.4% as well as 1.6 and 0.1% of HOAc and TEA, respectively. Again, there is a good agreement between the actual data and the predicted data. In both cases, the experimental runtime is shorter than the predicted value, while baseline resolution is achievable in all peaks except N1–N2. Upon comparison of all three chromatograms in Fig. 10, simultaneous or individual separation of multichiral center β-blockers within 1 h can be achieved.
4. Concluding remarks
By first using a sequential optimization, it is possible to obtain a narrow range for optimization of mobile phase parameters. A sequentially optimized simultaneous separation of nadolol and labetalol could be obtained with a binary mobile phase of 40/60 MeOH/ACN (%, v/v) containing 0.8% HOAc and 0.2% TEA; column temperature of 50 °C, and an applied electric field strength of 500 V/cm. This sequential optimization allowed the critical parameters for the simultaneous separation of nadolol and labetalol to be determined. Looking at the change in resolution between enantiomers and diastereomers and the overall runtime, it was concluded that the mobile phase composition played the largest role in the enantioseparation of nadolol and labetalol, more than the column temperature and the electric field strength. Hence, only the mobile phase composition was analyzed as part of the multivariate optimization of the simultaneous enantioseparation of the two analytes.
For the multivariate optimization of the mobile phase composition, the D-optimal design predicted an optimum mobile phase of 40/60 MeOH/ACN (%, v/v) containing 1.6% HOAc and 0.4% TEA. Comparing the sequentially optimized mobile phase composition to that of the multivariate one, it can be noted that the only difference is in the %HOAc and %TEA. For example, it was 0.8/0.2% HOAc/TEA for the sequentially optimized mobile phase. On the other hand, in the multivariate optimized mobile phase the percentages were 1.6/0.4% HOAc/TEA. This would seem to imply that adjustments in the amounts of HOAc and TEA were all that were needed for the further optimization of the separation system. This correlates well with our findings from the regression coefficient plots (Fig. 6), which show that the %HOAc and %TEA either separate or as a cross product had the most significant effects on almost all of the stereoisomer separations except for two exceptions. In the first exception, the effect of the MeOH/ACN ratio is equivalent to the effect of the cross product of %HOAc and %TEA for the enantiomeric separation of L1–L2. The second exception was the diastereomeric separation of L2–L3 where the MeOH/ACN ratio was the dominant factor effecting the separation. It is speculated that the first exception is due to the difference in analyte interactions with the organic portion of the mobile phase and the acid/base portion. The second exception is speculated due to differences between achiral separations of the L2–L3 diastereomers as compared to the chiral separations as seen in most other cases.
The direct infusion analysis showed that the replacement of NH4OAc with HOAc in the sheath liquid provided a two- and three-fold increase in signal abundance for nadolol and labetalol, respectively. Moreover, it was interesting to note that when performing on-line CEC–MS the highest S/N ratios were achieved when the %MeOH in the sheath liquid was at its lowest, and then the S/N dropped to its lowest value when the %MeOH was in the middle of the experimental range. The final optimized sheath liquid composition of 20/80 MeOH/H2O (%, v/v) with 2.0% HOAc provided significantly higher S/N ratios for the nadolol and labetalol peaks.
The optimization of the spray chamber parameters as predicted by the D-optimal design software for the maximization of all nadolol and labetalol peak S/N ratios showed that as we increase the drying gas temperature we see an increase in the average S/N ratio. The sharp incline of the RSM surface with the increase in drying gas temperature (Fig. 9A and C), seems to suggest that the actual optimum drying gas temperature may lie outside the experimental range that we tested. The predicted optimum of 220 °C may only be a local optimum value. On the other hand, the drying gas flow rate of 4.7 L/min and nebulizer pressure of 3 psi seem to be at global optimums due to the hyperbolic shape that is achieved in the surface of Fig. 9B, at the approximate midpoint of both drying gas flow rate and nebulizer pressure when the drying gas temperature is held constant at 220 °C.
Although multivariate can take more time, it is possible to use certain designs such as the D-optimal design, to reduce the number of runs necessary to explore a design space. In this case, the choice of the D-optimal over the central composite design equaled the saving of a week of experiment time, since the central composite design would require seven more runs then the D-optimal. With the D-optimal experimental design of mobile phase composition, it was possible to obtain optimized simultaneous enantioseparation of nadolol and labetalol with enantiomeric resolution in the range of 1.0−3.0 within 1 h. Furthermore, The D-optimal experimental design of the MS conditions of sheath liquid and spray chamber conditions provided good average S/N ratios greater than 1000. The multivariate optimization was able to reduce the overall run time for the simultaneous separation of nadolol and labetalol by 15 min. This is not a considerable savings with regard to a single run. However, when considered from the view point of multiple runs for high throughput analysis, the 15 min reduction can very quickly add up to substantial savings in number of runs performed each day. Looking at the individual separations of nadolol and labetalol, it can be seen that the resolutions can be improved somewhat when they are injected separately within the parameter ranges that we have tested.
Acknowledgement
Financial support for this project was provided by the National Institutes of Health (grant GM 062314).
Footnotes
This paper is part of the Special Issue ‘Enantioseparations’, dedicated to W. Lindner, edited by B. Chankvetadze and E. Francotte.
References
- 1.Zheng J, Shamsi SA. Electrophoresis. 2006;27:2139. doi: 10.1002/elps.200500874. [DOI] [PubMed] [Google Scholar]
- 2.Rustichell C, Ferioli V, Gamberii G. Chromatographia. 1997;44:477. [Google Scholar]
- 3.Uray G, Kosjeck B. Enantiomer. 2000;5:329. [PubMed] [Google Scholar]
- 4.Chankvetadze B, Kartozia I, Blaschke G. J. Pharm. Biomed. Anal. 2002;27:161. doi: 10.1016/s0731-7085(01)00553-2. [DOI] [PubMed] [Google Scholar]
- 5.Meyring M, Chankvetadze B, Blaschke G. J. Chromatogr. A. 2000;876:157. doi: 10.1016/s0021-9673(00)00156-4. [DOI] [PubMed] [Google Scholar]
- 6.Cherkaui S, Veuthey JL. J. Pharm. Biomed. Anal. 2002;27:615. doi: 10.1016/s0731-7085(01)00577-5. [DOI] [PubMed] [Google Scholar]
- 7.Zhou LL, Thompson R, French M, Ellison D, Wyvratt J. J. Sep. Sci. 2002;25:1183. [Google Scholar]
- 8.Chankvetadze B, Lomsadze K, Blaschke G. J. Sep. Sci. 2001;24:795. [Google Scholar]
- 9.Rudaz S, Cherkaoui S, Dayer P, Fanali S, Veuthey JL. J. Chromatogr. A. 2000;868:295. doi: 10.1016/s0021-9673(99)01257-1. [DOI] [PubMed] [Google Scholar]
- 10.Morin P, Dreux M, Usse S, Viaud MC, Guillaumet G. Electrophoresis. 1999;20:2630. doi: 10.1002/(SICI)1522-2683(19990901)20:13<2630::AID-ELPS2630>3.0.CO;2-9. [DOI] [PubMed] [Google Scholar]
- 11.Guo L, Lin SJ, Yang YF, Qi L, Wang MX, Chen Y. J. Chromatogr. A. 2003;998:221. doi: 10.1016/s0021-9673(03)00653-8. [DOI] [PubMed] [Google Scholar]
- 12.Chankvetadze B, Burjanadze N, Bergander K, Blaschke G. Electrophoresis. 2002;23:1906. doi: 10.1002/1522-2683(200206)23:12<1906::AID-ELPS1906>3.0.CO;2-#. [DOI] [PubMed] [Google Scholar]
- 13.Meyring M, Chankvetadze B, Blaschke G. Electrophoresis. 1999;20:2425. doi: 10.1002/(SICI)1522-2683(19990801)20:12<2425::AID-ELPS2425>3.0.CO;2-W. [DOI] [PubMed] [Google Scholar]
- 14.Murray RW. Anal. Chem. 1999;71:499a. doi: 10.1021/ac990564p. [DOI] [PubMed] [Google Scholar]
- 15.Simal-Gandara J. Cri. Rev. Anal. Chem. 2004;34:85. [Google Scholar]
- 16.Li Y, Xiang R, Wilkins JA, Honrath C. Electrophoresis. 2004;25:2242. doi: 10.1002/elps.200305920. [DOI] [PubMed] [Google Scholar]
- 17.Knox JH, Boughtflower R. Trends Anal. Chem. 2000;19:643. [Google Scholar]
- 18.Klampfl CW. J. Chromatogr. A. 2004;1044:131. doi: 10.1016/j.chroma.2004.04.072. [DOI] [PubMed] [Google Scholar]
- 19.Shamsi SA, Miller BE. Electrophoresis. 2004;25:3927. doi: 10.1002/elps.200406131. [DOI] [PubMed] [Google Scholar]
- 20.Que AH, Novotny MV. Anal. Chem. 2002;74:5184. doi: 10.1021/ac025781w. [DOI] [PubMed] [Google Scholar]
- 21.Choudhary G, Apffel A, Yin HF, Hancock W. J. Chromatogr. A. 2000;887:85. doi: 10.1016/s0021-9673(00)00530-6. [DOI] [PubMed] [Google Scholar]
- 22.Lord GA, Gordon DB, Myers P, King BW. J. Chromatogr. A. 1997;768:9. [Google Scholar]
- 23.Zheng J, Norton D, Shamsi SA. Anal. Chem. 2006;78:1323. doi: 10.1021/ac051480l. [DOI] [PubMed] [Google Scholar]
- 24.Mallampati S, Leonard S, De Vulder S, Hoogmartens J, Schepdael AV. Electrophoresis. 2005;26:4079. doi: 10.1002/elps.200500284. [DOI] [PubMed] [Google Scholar]
- 25.Martinez-Gomez MA, Villanueva-Camanas RM, Sagrado S, Medina-Hernandez MJ. Electrophoresis. 2005;26:4116. doi: 10.1002/elps.200500304. [DOI] [PubMed] [Google Scholar]
- 26.Gonzalez A, Foster KL, Hanrahan G. J. Chromatogr. A. 2007;1167:135. doi: 10.1016/j.chroma.2007.08.035. [DOI] [PubMed] [Google Scholar]
- 27.Williams AA, Fakayode SO, Huang X, Warner IM. Electrophoresis. 2006;27:4127. doi: 10.1002/elps.200600071. [DOI] [PubMed] [Google Scholar]
- 28.Nadolol Health Center [12-09-05]; http://www.medicinenet.com/nadolol/index.htm part of MedicineNet http://www.medicinenet.com/script/main/hp.asp.
- 29.Labetalol Hydrochloride [12-09-05]; http://www.tiscali.co.uk/lifestyle/healthfitness/health advice/netdoctor/archive/100001441.htmlpart of Tiscali website http://www.tiscali.co.uk/index first.html.
- 30.Rizvi S, Shamsi SA. Electrophoresis. 2004;25:853. doi: 10.1002/elps.200305762. [DOI] [PubMed] [Google Scholar]
- 31.Desai M, Gal J. J. Chromatogr. 1992;579:165. doi: 10.1016/0378-4347(92)80375-z. [DOI] [PubMed] [Google Scholar]
- 32.MacLeod SL, Sudhir P, Wong CS. J. Chromatogr. A. 2007;1170:23. doi: 10.1016/j.chroma.2007.09.010. [DOI] [PubMed] [Google Scholar]
- 33.Tamisier KSL, Stenger MA, Bommart A. Electrophoresis. 1999;20:2656. doi: 10.1002/(SICI)1522-2683(19990901)20:13<2656::AID-ELPS2656>3.0.CO;2-6. [DOI] [PubMed] [Google Scholar]
- 34.Goel TV, Nikelly JG, Simpson RC, Matuszewski BK. J. Chromatogr. A. 2004;1027:213. doi: 10.1016/j.chroma.2003.08.082. [DOI] [PubMed] [Google Scholar]
- 35. [12-09-05]; Chromatography Online, www.chromatography-online.org.
- 36.Zheng J, Shamsi SA. Anal. Chem. 2003;75:6295. doi: 10.1021/ac030193j. [DOI] [PubMed] [Google Scholar]
- 37.Zheng J, Shamsi SA. J. Chromatogr. A. 2003;1005:177. doi: 10.1016/s0021-9673(03)00886-0. [DOI] [PubMed] [Google Scholar]
- 38.Ekborg-Ott KH, Liu YB, Armstrong DW. Chirality. 1998;10:434. doi: 10.1002/(SICI)1520-636X(1998)10:5<434::AID-CHIR10>3.0.CO;2-0. [DOI] [PubMed] [Google Scholar]
- 39.Fanali S, Catarcini P, Quaglia MG. Electrophoresis. 2002;23:477. doi: 10.1002/1522-2683(200202)23:3<477::AID-ELPS477>3.0.CO;2-L. [DOI] [PubMed] [Google Scholar]
- 40.Svensson LA, Donnecke J, Karlsson KE, Karlsson A, Vessman J. Chirality. 2000;12:606. doi: 10.1002/1520-636X(2000)12:8<606::AID-CHIR2>3.0.CO;2-H. [DOI] [PubMed] [Google Scholar]
- 41.Anderson MJ, Whitcomb PJ. RSM Simplified: Optimizing Processes Using Response Surface Methods for Design of Experiments. Productivity Press; New York, NY: 2005. [Google Scholar]


