

Abstract
Purpose
Cross-contamination of cell lines is a serious but often unrecognized problem. We describe the authentication of a panel of transitional cell carcinoma cell lines using the short tandem repeat (STR) profiling technique to detect cross-contamination.
Methods
Genomic DNA was isolated from UM-UC-1, UM-UC-2, UM-UC-3, UM-UC-6, UM-UC-9, UM-UC-10, UM-UC-11, UM-UC-13, UM-UC-14, UM-UC-16, T24, and KU7 cell lines. STR loci (D3S1358, D16S539, vWA, FGA, TH01, TPOX, CSF1PO, D5S818, D13S317, and D7S820) and a segment of the X-Y homologous gene amelogenin were co-amplified by polymerase chain reaction. Profiling was carried out using a performance optimized polymer 4 (POP-4TM) with ABI PRISM1 310 genetic analyzer. DNA sequencing of TP53 and immunohistochemistry for p53 were performed on UM-UC-3 and UM-UC-3-green fluorescence protein (GFP).
Results
All cell lines had a unique STR profile except UM-UC-2 and T24, which were virtually identical. T24 STR profiles matched those of early passage number UM-UC-2. Stable transfection of the GFP marker gene did not alter UM-UC-6, UM-UC-14, or KU7 profiles; however, the STR profile for UM-UC-3-GFP was different from that of UM-UC-3. DNA sequencing showed a difference in TP53 between UM-UC-3 and UM-UC-3-GFP, confirming that UM-UC-3-GFP is not derived from UM-UC-3.
Conclusion
STR profiling provides a unique genetic signature of human cell lines that does not significantly change with passage or GFP transduction. Through STR profiling, we showed that the cell line UM-UC-2 is T24. DNA fingerprinting using STR profiling is an easy and reliable tool that can be used for verification of cell lines.
Keywords: DNA Profiling, Bladder Cancer, Cell Lines
Continuous cell lines established from human tissue are useful in advancing many areas of biomedical research. Cross-contamination of cell lines, defined as contamination of cell lines with unrelated cells from another cell line, is a frequent, long-standing, and recurring problem.1, 2 Nelson-Rees et al.3 reported one of the largest demonstrations of cross-contamination, finding widespread cross-contamination of many cell lines by HeLa. Since then, there have been an increasing number of published reports on the cross-contamination of cell lines. In 1984, Hukku et al.4 reported that of 275 cultures sent to their laboratory for analysis over an 18-month period, 35% of all cell lines and 36% of human cell lines were contaminated (25% by cells of another species and 11% by another human cell line). In 1999, there were high levels of cross-contaminants in a cell line bank of the DSMZ-German Collection of Microorganisms and Cell Cultures, affecting 45 of 252 human cell lines (18%) supplied by 27 (29%) of 93 original donors.5 Cell line cross-contamination may alter the results of research that are based on cell- culture experiments. Other consequences of cell line cross-contamination include the inability to compare research results between laboratories, reduced reproducibility of experiments, financial loss, and problems with drug licensing and patent filing.
Various methods of detecting cell line cross-contamination have been employed and include enzyme polymorphisms, HLA typing, karyotyping, DNA polymorphisms, and DNA fingerprinting.2 The concept of DNA fingerprinting was born following the discovery of hypervariable regions within DNA.6 Its use for cell authentication was first described in 1988 by Masters et al.7 and Thacker et al.8 The sensitivity of DNA fingerprinting for cell authenthication was improved by polymerase chain reaction (PCR)-based microsatellite typing first used by King et al.9 in 1994. The further development of short tandem repeat (STR) profiling techniques for human individual identification paved the way for its use in cell authentication and standardization, and this technique was suggested to provide an international reference standard for human cell lines.2, 10 DNA fingerprinting is currently the method of choice for cell line authentication.11
We previously established a panel of transitional cell cancer cell lines at the University of Michigan.12, 13, 14 Noting several inconsistencies between recent laboratory results and our prior reports led to systematic authentication of our cell lines. This report describes the DNA fingerprints of these cell lines and confirms that cross-contamination continues to be a serious and significant problem.
Material and Methods
Cell Culture
The transitional cell carcinoma cell lines UM-UC-1, UM-UC-2, UM-UC-3, UM-UC-6, UM-UC-9, UM-UC-10, UM-UC-11, UM-UC-13, UM-UC-14, UM-UC-16, T24 and KU7 were obtained from cryopreserved cells frozen over a span of more than 25 years. UM-UC-3 was also obtained from the American Type Culture Collection (ATCC; Manassas, VA, USA). The cells were maintained in Eagle’s minimum essential medium (Mediatech Inc., Herndon, VA, USA) supplemented with 2 mM L-glutamine, 10% fetal bovine serum, 100 U/ml penicillin, and 100 µg/ml streptomycin at 37°C in a humidified chamber with 5% CO2. Cells were passed with 0.25% trypsin in Hanks media (Sigma-Aldrich, St. Louis, MO, USA) when confluent. All cultures were free of bacterial, fungal, and mycoplasma contamination.
DNA Extraction and Sequencing
Genomic DNA was isolated from 2 × 10⁶ cells using a QIAamp DNA mini kit (QIAGEN Inc., Valencia, CA, USA). One nanogram of DNA for each cell line was used for STR profiling. DNA concentration was determined by light absorption at 260 nm. DNA samples from the cell lines were also sent for sequence analysis for the TP53 gene.
STR Amplification and Typing
Short tandem repeat loci and a segment of the X-Y homologous gene amelogenin were amplified using the AmpFlSTR Profiler Plus (detecting D3S1358, vWA, FGA, TH01, TPOX, CSF1PO, D5S818, D13S317, and D7S820 loci and amelogenin) and COfiler (detecting D3S1358, D16S539, TH01, TPOX, CSF1PO, and D7S820 loci) PCR amplification kits (Applied Biosystems, Foster City, CA, USA) according to the manufacturers’ instructions in the GeneAmp PCR system 9700 (Applied Biosystems). Electrophoretic analysis was carried out using a performance optimized polymer 4 (POP-4TM; Applied Biosystems) with ABI PRISM1 310 Genetic Analyzer (Applied Biosystems). The amplified DNA fragment lengths were determined by comparing them with an internal size standard GeneScanTM-500 ROX (Applied Biosystems). Each electrophoretic run was analyzed with the GeneScan Analysis software v.3.1.2 (Applied Biosystems) and compared with AmpFlSTR1Profiler Plus allelic ladders (Applied Biosystems). Each experiment was repeated at least once.
Immunohistochemical Staining of p53
UM-UC-6 (wild-type for p53 by sequencing and p53 negative by immunohistochemical [IHC]) analysis and UM-UC-14 (mutation for p53 by sequencing and p53 positive by IHC) were controls for immunohistochemistry. Primary anti-p53 antibodies (clone PAb 240 or clone PAb 1801) were used at a dilution of 1:200. The 240 antibody detects only mutant p53 protein, whereas the 1801 antibody detects wild-type (WT) and mutant (MUT) p53 proteins. Cultured cells were grown on sterile glass slides overnight at 37º C. The slides were washed with phosphate-buffered saline (PBS) and fixed for 5 minutes in -10º C methanol. After washing in PBS, the slides were incubated for 5 to 10 minutes in 0.1% to 1% hydrogen peroxide in PBS to quench endogenous peroxidase activity. The slides were blocked using 1% serum in PBS for 30 minutes before overnight incubation at 4oC, with each primary antibody diluted 1:200 in blocking solution. Primary antibodies were detected using their respective ABC Elite kits (Vector Laboratories, Burlingame, California). Color was developed with diaminobenzidine, and the sections were then counterstained with hematoxylin, dehydrated, and mounted. Using antibody 1801, p53 scoring was reported as no expression (−) or overexpression (+++), presumably representing a mutant form of the protein. Staining with antibody 240 was considered to indicate the presence of a mutant p53 protein.
Results
Each of the 12 urothelial carcinoma cell lines were analyzed by STR profiling at 2 to 5 different passages. The DNA fingerprinting profiles are shown in Figures 1 to 4. When we compared the cell line STR profiles, we found that UM-UC-2 and T24 cell lines had essentially identical profiles (Fig.1). This finding has been independently verified by the European Collection of Cell Cultures (ECACC, Salisbury, Wiltshire, UK). T24 STR profiles matched those of both early and intermediate passage number UM-UC-2, demonstrating that UM-UC-2 was contaminated with T24 at an early stage. The STR profiles of the other cell lines were distinct from each other (Fig. 2). Within each cell line, there was at least 90% concordance in their respective profiles at different passages. Examples of STR profiles at different passages are shown in Figures 1 and 4. Differences in heights of peaks at various loci were commonly seen at different passages.
Figure 1.


STR profiles of UM-UC-2 and T24 bladder cancer cell lines at different passages (HP – high passage, IP - intermediate passage, LP – low passage). STR loci are grouped as (A) black, (B) blue, and (C) green markers.
Figure 4.
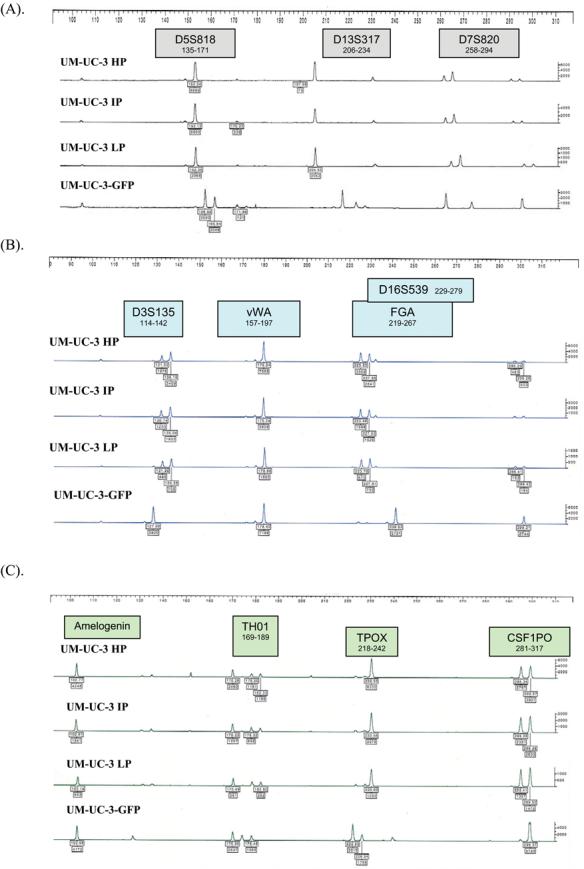
STR profiles of UM-UC-3 bladder cancer cell lines at different passages (HP – high passage, IP - intermediate passage, LP – low passage) compared to UM-UC-3-GFP. STR loci are grouped as (A) black, (B) blue, and (C) green markers.
Figure 2.

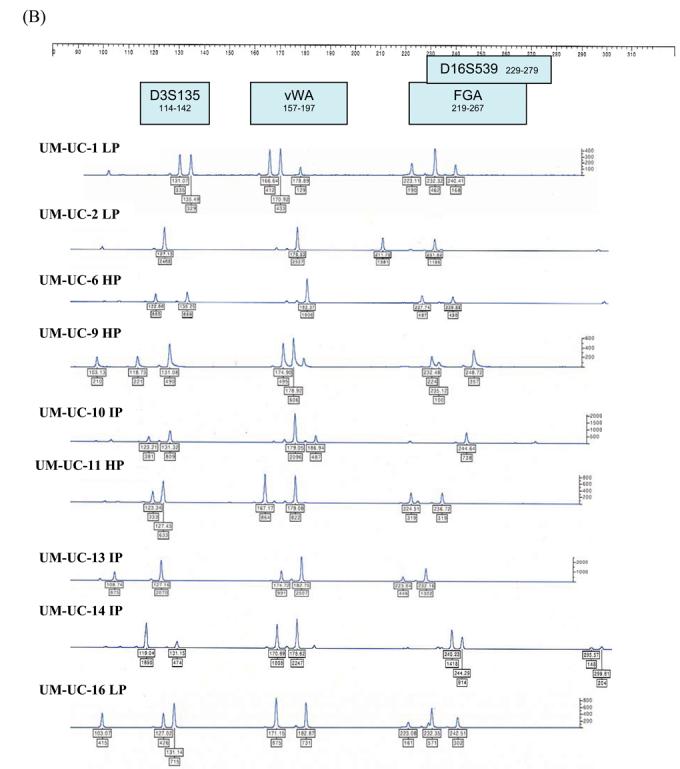
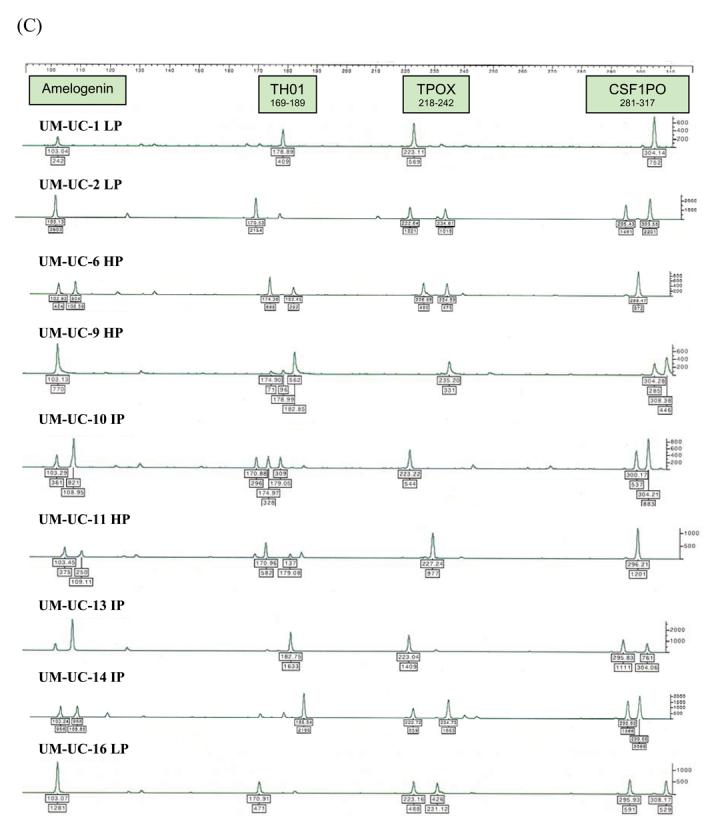
STR profiles of distinctly different bladder cancer cell lines (HP – high passage, IP - intermediate passage, LP – low passage). STR loci are grouped as (A) black, (B) blue, and (C) green markers.
Several of the cell lines had previously been transduced with the GFP marker gene.15 Transduction of UM-UC-6, UM-UC-14, and KU7 with GFP did not alter their STR profiles. The KU7 and KU7-GFP STR profiles are shown in Figure 3. We found a marked discordance between the STR profiles of UM-UC-3 and UM-UC-3-GFP (Fig. 4). To ascertain whether gene transduction altered the STR profile, we examined the TP53 status of UM-UC-3, which has described as having large deletions among exons 5/6 in TP53.14 In contrast to our previous report, DNA sequencing analysis for the p53 gene in UM-UC-3 from our laboratory and from the ATCC demonstrated that it is wild-type for exons 5–9 but has a missense substitution in exon 4, base substitution in exon 11, non-coding deletion in exon 9, and a non-coding deletion and substitution in intron 9. These features are also different from those of UM-UC-3-GFP, which only had a frameshift deletion in position 39 of exon 5, demonstrating that UM-UC-3-GFP is contaminated (Fig. 5). Furthermore, UM-UC-3 in contrast to our previous report demonstrates strong staining for p53 by immunochemical analysis using the 1801 and the 240 antibodies (Fig. 6).14 We also previously reported large deletions among exons 5/6 of TP53 in UM-UC-16.14 On reanalysis of this cell line, we found only a 7-bp frameshift deletion in exons 5 and 6 and a missense mutation in exon 4.
Figure 3.
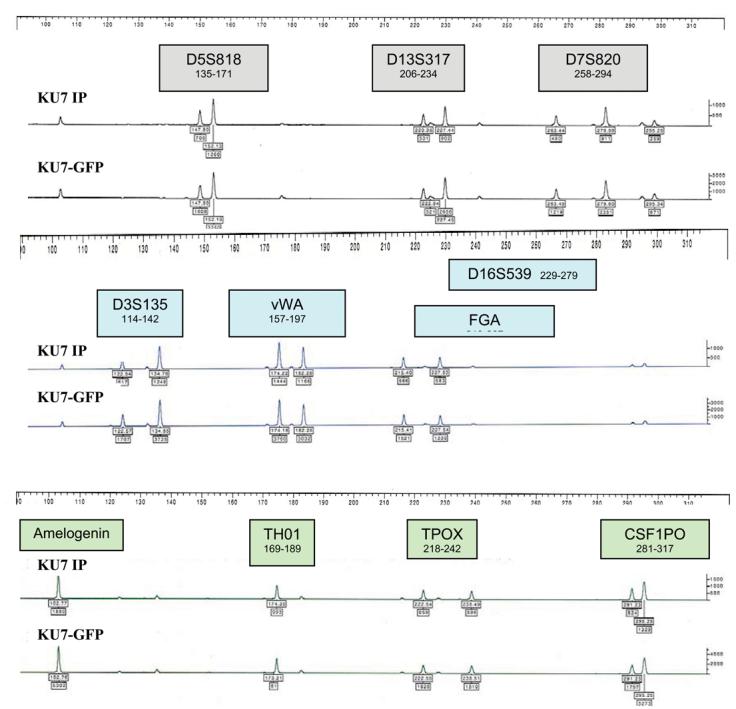
STR profiles comparing the KU7 bladder cancer cell line with KU7 transduced with the GFP marker.
Figure 5.
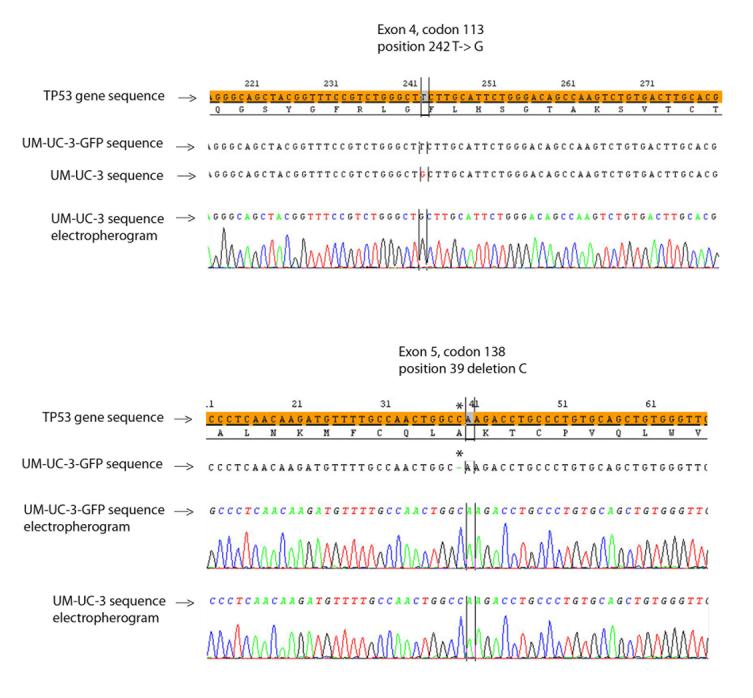
TP53 sequencing at exon 4, codon 113 demonstrates a T to G substitution at position 242 in UM-UC-3 but not UM-UC-3-GFP. Sequencing of exon 5, codon 138 demonstrates a C deletion at position 39 in UM-UC-3-GFP but not UM-UC-3.
Figure 6.
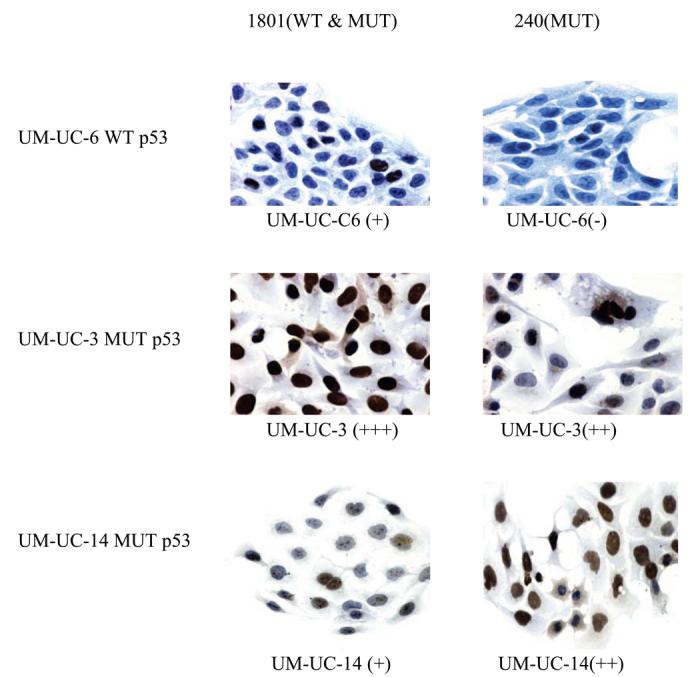
IHC analysis of UM-UC-3, UM-UC-6, and UM-UC-14 for p53 using antibodies 1801 and 240 (40X magnification).
In this study, we used 2 PCR amplification kits to determine the gene signature of the cell lines: the AmpFlSTR Profiler Plus (which detects 9 loci) and the COfiler (which detects 6 loci). Both kits detect 5 similar loci. We found that detecting only 6 loci (using the COfiler kit) was sufficient to determine the identity of the cell lines.
Discussion
It has been reported that 17% to 36% of cell cultures in use are cross-contaminated either by intraspecies contamination (unrelated cells from the same species) or interspecies contamination (cells from another species).1 Quality control for cell line cross-contamination is not regularly practiced in most laboratories, despite the obvious importance and frequency of the problem. This may be due to several factors, including: (1) failure to appreciate the occurrence of cross-contamination because it is often not visually recognizable, (2) unsuitability of detection methods for extensive cell-culture screening, and (3) lack of awareness of cross-contamination due to insufficient reporting [1].
Cell lines derived from urinary bladder carcinomas have frequently been found to be cross-contaminated with T24 cells.16-19 The ECV304 cell line, which was widely considered a model cell line for endothelial cells, has also been reported to be a subclone of the T24 cell line.20 Here, we also describe another bladder cancer cell line, UM-UC-2, which is actually T24 due to cross-contamination at the source.
The STR profiling technique uses fluorescence-based PCR and multiple dye technology to enable detection of loci with overlapping size ranges. This technique was developed to identify people for forensic purposes.10 Using this method, various polymorphic STR loci are amplified by PCR using commercial primers. The PCR products are then read against size standards by automated fluorescence detectors. The accuracy of this PCR technique is less than 1 bp.2 STR profiling has been investigated for its use in detecting cell line cross-contamination. It was shown to provide an efficient, rapid, and reliable means of authenticating cell lines.2 In a study that used this technique to evaluate cell lines obtained worldwide, STR profiling was also shown to provide a universal standard reference for human cell lines.2
In our study, 1ng of DNA was able to provide sufficient peak heights to evaluate the specific loci. Differences seen in peak heights within cell lines may be due to differential amplification efficiency of the loci, experimental variation, or the number of allele copies present. In normal human DNA, most STR loci have 2 alleles; however, the STR loci in cancer cells may have additional copies of the allele, due to genetic instability. Although it has been reported that long-term cultures and sub-cloning may result in alterations of DNA fingerprinting profiles that are divergent from their parental origin21, we have not verified this observation. UM-UC-3 cells were stable from different sources obtained over a period of more than 25 years. Some investigators have found that viral transformation or long-term exposure to chemotherapeutic agents may produce sublines that have different STR profiles 2 but tend to remain similar to the parental cell line.
The finding that UM-UC-2 was contaminated led us to reassess our previously reported cell lines. We found that UM-UC-3-GFP was also contaminated and had a markedly different STR profile than did UM-UC-3. This was confirmed by significant differences in TP53 mutation in the 2 cell lines. The other human bladder cancer cell lines had unique STR profiles that did not change with passage or GFP transduction. The STR profiles of our cell lines are summarized in Table 1. We also found differences in TP53 of UM-UC-3 and UM-UC-16 cells, and in IHC for p53 of UM-UC-3 compared to our prior report.14
Table 1.
The STR profiles of unique bladder cancer cell lines using the AmpFlSTR Profiler Plus and COfiler PCR amplification assays.
| Cell line | Amplifications within STR loci (bp) | |||||||||
|---|---|---|---|---|---|---|---|---|---|---|
| D5S818 135-171 bp |
D13S317 206-234 bp |
D7S820 258-294 bp |
D3S135 114-142 bp |
vWA 157-197 bp |
FGA 219-267 bp |
D16S539 229-279 bp |
TH01 169-189 bp |
TPOX 218-242 bp |
CSF1PO 281-317 bp |
|
| UM-UC-1 | 157 | 229 | 264, 276 | 131, 136 | 167, 171, 179 |
223, 232, 240 |
232, 240 | 179 | 223 | 304 |
| UM-UC-2 (T24) | 143, 152 | 221 | 272, 276 | 127 | 178 | 232 | 232 | 170, 178 | 223, 235 | 295, 303 |
| UM-UC-3 | 152 | - | 264, 268 | 131, 135 | 178 | 224, 228 | - | 170, 178, 182 |
231 | 295, 299 |
| UM-UC-6 | 148, 156 | 225, 228 | 272 | 123, 135 | 182 | 228, 240 | 240 | 174, 182 | 227, 235 | 299 |
| UM-UC-9 | 153 | 217, 225 | 268, 276 | 119, 131 | 175, 179 | 232, 235, 249 |
232, 235, 249 |
175, 179, 183 |
235 | 304, 308 |
| UM-UC-10 | 153 | 217, 221 | 280, 284 | 123, 131 | 179, 187 | 245 | 245 | 171, 175, 179 |
223 | 300, 304 |
| UM-UC-11 | 153 | 217, 229 | 265, 281 | 123, 127 | 167, 179 | 225, 237 | 237 | 171, 179 | 227 | 296 |
| UM-UC-13 | 139, 157 | 221 | 264, 268 | 127 | 175, 183 | 223, 232 | 232 | 183 | 223 | 296, 304 |
| UM-UC-14 | 148, 153 | 221,225 | 268, 280 | 119, 131 | 171, 179 | 240, 244 | 240, 244 | 186 | 223, 235 | 296, 300 |
| UM-UC-16 | 148, 153 | 217 | 276 | 127, 131 | 171, 183 | 223, 232, 243 |
232, 243 | 171 | 223, 231 | 296, 308 |
| KU7 | 148, 152 | 220, 227 | 263, 280 | 123, 135 | 174, 182 | 228 | - | 174 | 223, 238 | 291, 295 |
We found that using 6-loci detection screening (D3S1358, D16S539, TH01, TPOX, CSF1PO, and D7S820) was sufficient for authenticating our cell lines. While this approach is more cost effective for screening cell lines, additional confirmation can be obtained by 10-loci screening.
The profiles reported here can be used to verify the identity of our cell lines. These cell lines have been made available to non-commercial investigators through the ATCC and the ECACC.
Conclusion
STR profiling provides a unique genetic signature of human cell lines that does not change with passage or GFP transduction. We demonstrated through STR profiling, that UM-UC-2 is actually T24, due apparently to cross-contamination shortly after establishment of the cell line. STR profiling also demonstrated that UM-UC-3-GFP is not related to UM-UC-3. Investigators should be aware of the continuing problem of cell line cross-contamination. Our results demonstrate that DNA fingerprinting using a 6-loci STR profiling technique is an easy and reliable tool that can be used to identify cell lines.
Abbreviations / Acronyms
- STR
short tandem repeat
- GFP
green fluorescence protein
- DNA
Deoxyribonucleic acid
- WT
wild-type
- MUT
mutant
- PBS
phosphate-buffered saline
- PCR
polymerase chain reaction
- IHC
immunohistochemistry
- ATCC
American Type Culture Collection
References
- 1.Markovic O, Markovic N. Cell cross-contamination in cell cultures: the silent and neglected danger. Vitro Cell Dev Biol Anim. 1998;34:1. doi: 10.1007/s11626-998-0040-y. [DOI] [PubMed] [Google Scholar]
- 2.Masters JR, Thomson JA, Daly-Burns B, Reid YA, Dirks WG, Packer P, et al. Short tandem repeat profiling provides an international reference standard for human cell lines. Proc Natl Acad Sci U S A. 2001;98:8012. doi: 10.1073/pnas.121616198. [DOI] [PMC free article] [PubMed] [Google Scholar]
- 3.Nelson-Rees WA, Daniels DW, Flandermeyer RR. Cross-contamination of cells in culture. Science. 1981;212:446. doi: 10.1126/science.6451928. [DOI] [PubMed] [Google Scholar]
- 4.Hukku B, Halton DM, Mally M, Peterson WD., Jr. Cell characterization by use of multiple genetic markers. Adv Exp Med Biol. 1984;172:13. doi: 10.1007/978-1-4615-9376-8_2. [DOI] [PubMed] [Google Scholar]
- 5.MacLeod RA, Dirks WG, Matsuo Y, Kaufmann M, Milch H, Drexler HG. Widespread intraspecies cross-contamination of human tumor cell lines arising at source. Int J Cancer. 1999;83:555. doi: 10.1002/(sici)1097-0215(19991112)83:4<555::aid-ijc19>3.0.co;2-2. [DOI] [PubMed] [Google Scholar]
- 6.Jeffreys AJ, Wilson V, Thein SL. Individual-specific ‘fingerprints’ of human DNA. Nature. 1985;316:76. doi: 10.1038/316076a0. [DOI] [PubMed] [Google Scholar]
- 7.Masters JR, Bedford P, Kearney A, Povey S, Franks LM. Bladder cancer cell line cross-contamination: identification using a locus-specific minisatellite probe. Br J Cancer. 1988;57:284. doi: 10.1038/bjc.1988.61. [DOI] [PMC free article] [PubMed] [Google Scholar]
- 8.Thacker J, Webb MB, Debenham PG. Fingerprinting cell lines: use of human hypervariable DNA probes to characterize mammalian cell cultures. Somat Cell Mol Genet. 1988;14:519. doi: 10.1007/BF01535307. [DOI] [PubMed] [Google Scholar]
- 9.King BL, Lichtenstein A, Berenson J, Kacinski BM. A polymerase chain reaction-based microsatellite typing assay used for tumor cell line identification. Am J Pathol. 1994;144:486. [PMC free article] [PubMed] [Google Scholar]
- 10.Oldroyd NJ, Urquhart AJ, Kimpton CP, Millican ES, Watson SK, Downes T, et al. A highly discriminating octoplex short tandem repeat polymerase chain reaction system suitable for human individual identification. Electrophoresis. 1995;16:334. doi: 10.1002/elps.1150160155. [DOI] [PubMed] [Google Scholar]
- 11.Parson W, Kirchebner R, Mühlmann R, Renner K, Kofler A, Schmidt S, et al. Cancer cell line identification by short tandem repeat profiling: power and limitations. FASEB J. 2005;19:434. doi: 10.1096/fj.04-3062fje. [DOI] [PubMed] [Google Scholar]
- 12.Grossman HB, Wedemeyer G, Ren L. UM-UC-1 and UM-UC-2: characterization of two new human transitional cell carcinoma lines. J Urol. 1984;132:834. doi: 10.1016/s0022-5347(17)49883-1. [DOI] [PubMed] [Google Scholar]
- 13.Grossman HB, Wedemeyer G, Ren L, Wilson GN, Cox B. Improved growth of human urothelial carcinoma cell cultures. J Urol. 1986;136:953. doi: 10.1016/s0022-5347(17)45139-1. [DOI] [PubMed] [Google Scholar]
- 14.Sabichi A, Keyhani A, Tanaka N, Delacerda J, Lee IL, Zou C, Zhou JH, et al. Characterization of a panel of cell lines derived from urothelial neoplasms: genetic alterations, growth in vivo and the relationship of adenoviral mediated gene transfer to coxsackie adenovirus receptor expression. J Urol. 2006;175:1133. doi: 10.1016/S0022-5347(05)00323-X. [DOI] [PubMed] [Google Scholar]
- 15.Tanaka M, Gee JR, De La Cerda J, Rosser CJ, Zhou JH, Benedict WF, et al. Noninvasive detection of bladder cancer in an orthotopic murine model with green fluorescence protein cytology. J Urol. 2003;170:975. doi: 10.1097/01.ju.0000073209.65128.c1. [DOI] [PubMed] [Google Scholar]
- 16.Bubeník J. Cross-contamination of cell lines in culture. Folia Biol (Praha) 2000;46:163. [PubMed] [Google Scholar]
- 17.O'Toole CM, Povey S, Hepburn P, Franks LM. Identity of some human bladder cancer cell lines. Nature. 1983;301:429. doi: 10.1038/301429a0. [DOI] [PubMed] [Google Scholar]
- 18.Lin CW, Lin JC, Prout GR., Jr. Establishment and characterization of four human bladder tumor cell lines and sublines with different degrees of malignancy. Cancer Res. 1985;45:5070. [PubMed] [Google Scholar]
- 19.Christensen B, Hansen C, Debiec-Rychter M, Kieler J, Ottensen S, Schmidt J. Identity of tumorigenic human urothelial cell lines and ‘spontaneously’ transformed sublines. Br J Cancer. 1993;68:879. doi: 10.1038/bjc.1993.449. [DOI] [PMC free article] [PubMed] [Google Scholar]
- 20.Brown J, Reading SJ, Jones S, Fitchett CJ, Howl J, Martin A, Longland CL, et al. Critical evaluation of ECV304 as a human endothelial cell model defined by genetic analysis and functional responses: a comparison with the human bladder cancer derived epithelial cell line T24/83. Lab Invest. 2000;80:37. doi: 10.1038/labinvest.3780006. [DOI] [PubMed] [Google Scholar]
- 21.Parson W, Kirchebner R, Mühlmann R, Renner K, Kofler A, Schmidt S, et al. Cancer cell line identification by short tandem repeat profiling: power and limitations. FASEB J. 2005;19:434. doi: 10.1096/fj.04-3062fje. [DOI] [PubMed] [Google Scholar]