Abstract
The chiral nonaazamacrocyclic amine L, which is a reduction product of the 3+3 Schiff base macrocycle, wraps around the lanthanide(III) ions to form enantiopure helical complexes. These Ce(III), Pr(III), Nd(III), Eu(III), Gd(III), Tb(III), Er(III), Yb(III) and Lu(III) complexes have been isolated in enantiopure form and have been characterized by spectroscopic methods. X-ray crystal structures of the Ln(III) complexes with L show that the thermodynamic product of the complexation of the RRRRRR-isomer of the macrocycle is the (M)-helical complex in the case of Ce(III), Pr(III), Nd(III) and Eu(III). In contrast, the (P)-helical complex is the thermodynamic product in the case of Yb(III) and Lu(III). The NMR and CD spectra show that the (M)-helicity for the kinetic complexation product of the RRRRRR-isomer of the macrocycle is preferred for all investigated lanthanide(III) ions, while the preferred helicity of the thermodynamic product is (M) for the early lanthanide(III) ions and (P) for the late lanthanide(III) ions. In the case of the late lanthanide(III) ions, a slow inversion of helicity between the kinetic (M)-helical product and the thermodynamic (P)-helical product is observed in solution. For Er(III), Yb(III) and Lu(III) both forms have been isolated in pure form and characterized by NMR and CD. The analysis of 2D NMR spectra of the Lu(III) complex reveals the NOE correlations that prove that the helical structure is retained in solution. The NMR spectra also reveal large isotopic effect on the 1H NMR shifts of paramagnetic Ln(III) complexes, related to NH/ND exchange. Photophysical measurements show that LRRRRRR appears to favour an efficient 3ππ*-to-Ln energy transfer process taking place for Eu(III) and Tb(III), but these Eu(III)- and Tb(III)-containing complexes with LRRRRRR lead to small luminescent quantum yields due to an incomplete intersystem crossing (isc) transfer, a weak efficiency of the luminescence sensitization by the ligand, and/or efficient non-radiative deactivation processes. Circularly polarized luminescence on the MeOH solutions of Eu(III) and Tb(III) complexes confirms the presence of stable chiral emitting species and the observation of almost perfect mirror-image CPL spectra for these compounds with both enantiomeric forms of L.
Introduction
Both macrocyclic and helical structures continue to attract a lot of attention in inorganic and supramolecular chemistry. In some cases both structural motifs are combined1–6, e.g. when binding of metal ion forces a large macrocycle to adopt a twisted conformation2–4. In such a conformation the two halves of the macrocycle form a double helical system. Controlling the helicity at higher organizational order e.g. that of metal complex, supramolecular assembly, polymer or liquid crystal, is an important but difficult task.7 The chirality of metal complexes and inorganic supramolecular systems may be related e.g. to the spatial disposition of chelating ligands around the metal ion,7a formation of single, double or triple helices,8 helical twist of macrocyclic ligand,2–5 or rotation of the side arms of the macrocycle9. The chiralilty at higher hierarchical order may sometimes be controlled by the chirality of the molecular building blocks (e.g. ligands in inorganic systems, monomers in polymeric systems, dopants in liquid crystals or polymeric systems). Thus the enantiopure supramolecular assemblies and metal complexes can be obtained in diastereoselective synthesis by using non-racemic chiral ligands, which may determine the chirality of the supramolecular assembly or metal complex (e.g. the handedness of the helical structure). Generally, this strategy is successful when one of the possible diastereomers is thermodynamically favoured.9,10 In rare cases two diastereomeric structures of opposite helicity can be obtained for the same chirality of the molecular building blocks. Interconversion of such diastereomers corresponds to a helix inversion process. Helix inversion2,3a,11–15 between well-defined and well-characterized diastereomers is a very rare phenomenon and is related to the transformation of the normal right-handed B-DNA into the left-handed Z-DNA16, induced by high salt concentrations. Helicity induction and inversion are attracting a lot of attention in many areas of chemistry as general phenomena, related to functioning of biological systems, enantioselective catalysis and chiral recognition.
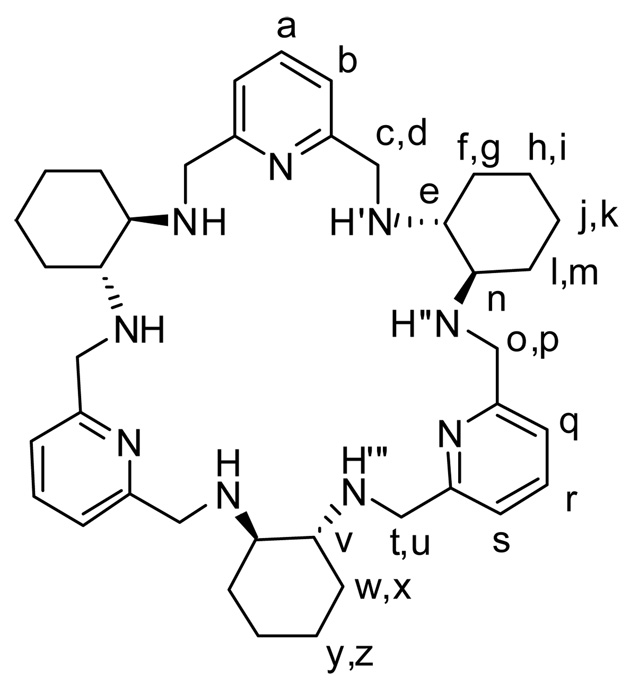
In a recent communication we have reported a new example of helical complexes based on nonaaza macrocycle L (Scheme 1), which is a reduced derivative of a 3+3 condensation product of 2,6-diformylpyridine and trans-1,2-diaminocyclohexane.2 This 3+3 macrocycle exhibits much higher helical twist in its Ln(III) complexes in comparison with the Ln(III) complexes of the related chiral 2+2 macrocycles3, or 3+3 macrocycle5 derived from 2,6-diformylphenol. The chiral ligand L can be obtained in enantiopure forms LRRRRRR and LSSSSSS, corresponding to all-R or all-S configuration of the diaminocyclohexane carbon atoms, respectively.17 We have also demonstrated helicity inversion between the kinetic and the thermodynamic complexation product in the Yb(III) complexes of L.
Scheme 1.
The macrocycle LRRRRRR and its labeling scheme
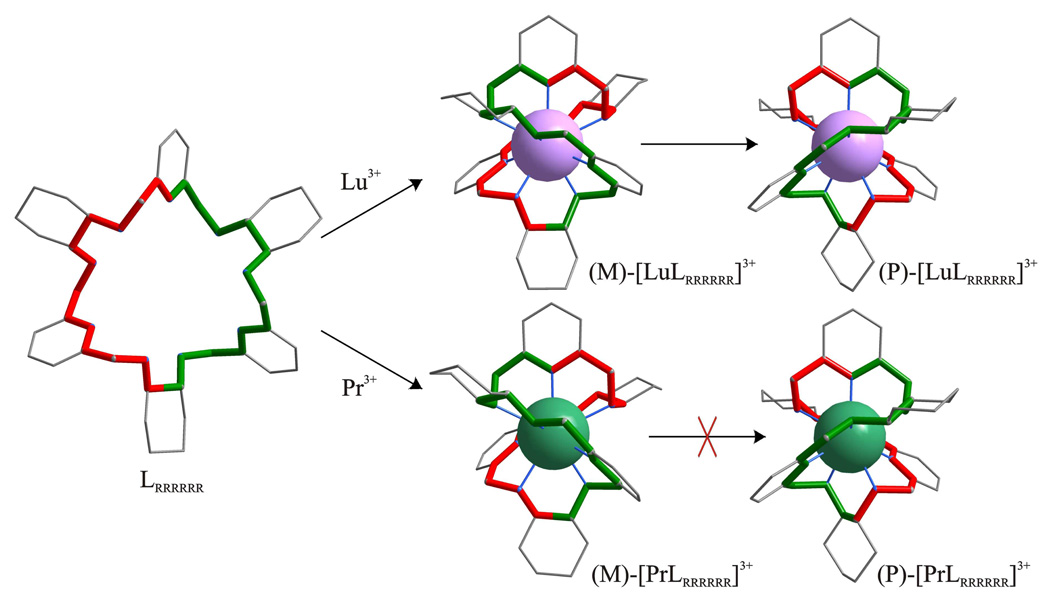
In this contribution we present the synthesis of new enantiopure Ln(III) complexes of L, as well as the influence of the size of Ln(III) ion on the relative stability of the (P)/(M) diastereomers and helicity inversion process (Scheme 2). We also present luminescence, circularly polarized luminescence (CPL) and NMR characterization of the complexes in solution and discuss the effect of NH/ND exchange on 1H NMR paramagnetic shifts.
Scheme 2.
Formation, helicity inversion and X-ray crystal structures of the [LnL]3+ complexes. The structures of (M)-[PrLRRRRRR]3+ and (P)-[LuLRRRRRR]3+ complex cations are based on crystallographic data reported in this work, the drawing of the macrocyle LRRRRRR is based on the crystallographic data of the protonated ligand17a and the drawing of (M)-[LuLRRRRRR]3+ is based on the crystallographic data of the isomorphic Yb(III) complex2.
Results and Discussion
Synthesis
The macrocycle Lwas synthesized previously in a direct 3+3 condensation of enantiopure trans-1,2-diaminocyclohexane and 2,6-diformylpyridine, followed by reduction of the obtained macrocyclic Shiff base.17b On the other hand, in a later report17a it was shown that in fact a mixture of macrocyclic products was formed in this 3+3 condensation, and that Cd(II) template was necessary for the isolation of the pure product. It should also be noted that the same condensation reaction run in the presence of Ln(III) template leads to 2+2 macrocycle.3 We have synthesized the macrocyclic amine LRRRRRR and its enantiomer LSSSSSS in a modified procedure. While it turned out that the Cd(II) ions are not necessary in the synthesis of L, short reaction times, higher dilution and recrystallization of the product are crucial for the isolation of the pure macrocycyle. The identity of L was confirmed by the X-ray crystal structure of its hydrochloride derivative, identical to that previously17a reported.
The [LnL](NO3)3 complexes exhibit good solubility in water and polar organic solvents, and often they are difficult to crystallize and to give pure products. On the other hand, the derivatives such as (M)-[EuLRRRRRR]2[Eu(NO3)5](NO3)4•2H2O, containing the complex counter-anions of the type [Ln(NO3)5]2−, exhibit lower solubility and higher tendency to crystallize.2 While the solution NMR studies of complexation of Ln(III) ions by L showed successful incorporation of the metal ion in the macrocycle in each case, the isolation of pure complexes presented some problems in the case of Tb(III) and Er(III) ions, which exhibit similar preference for the (P)- and (M)-diastereomeric forms of the ligand (vide infra). In the case of Er(III) and Lu(III), it was possible to obtain both diastereomeric complexes, i.e. (M)-[LnLRRRRRR](NO3)3 and (P)-[LnLRRRRRR](NO3)3 in enantiopure form. The isolation of the (P)-isomer was based on the longer reaction times and use of a 6.5% molar excess of the ligand L (method A) or use of the (M)-isomer as a substrate and extended heating time (method B). In the case of Eu(III) and Tb(III) complexes, the isolation of the pure (P)-[LnLRRRRRR](NO3)3 isomers was not possible, although method B together with fractional recrystallization allowed to obtain fractions of the complex mixtures enriched in isomer (P) (the molar ratio (M)/(P) equal to 1:1 and 1:0.8 for Eu(III) and Tb(III) complexes, respectively).
The identity of the complexes has been confirmed by elemental analyses and mass spectra. The positive-mode ESI-MS spectra (Supporting Fig. S1) of methanol solutions of the complexes show peaks at m/e corresponding to the presence of the cationic complexes [LnL]3+, in addition to ions {[LnL](NO3)}2+ and {[LnL](NO3)2}+ arising from the ion clusterisation (Supporting Figs. S1 and S2). Sometimes the peak of [LnL−H]2+ can also be observed (Fig. S1). The (M)-[LnLRRRRRR](NO3)3] and (P)-[LnLRRRRRR](NO3)3] diastereomers give rise to practically the same ESI-MS spectra, thus confirming their isomeric nature and similar chemical character (Supporting Fig. S2).
X-ray crystal structures – helical conformation of the [LnL]3+ complexes in solid state
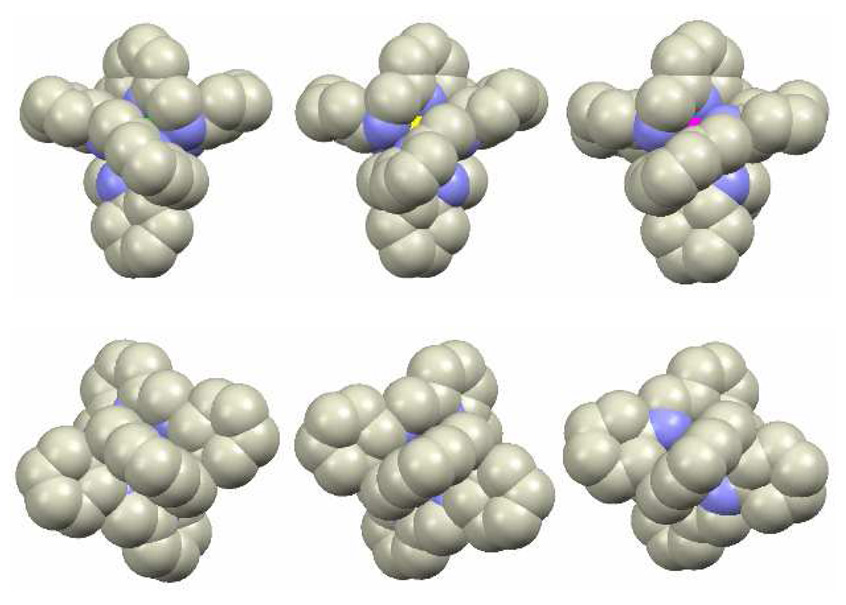
Since the cavity formed by the nine nitrogen atoms in the “open” conformation of L (observed in its protonated form17a) is far too large for a single metal ion, the macrocycle L has to wrap very tightly around the Ln3+ ion in a helical fashion in order to form a nine-coordinate complex. As a result of this twist, the two symmetry related halves of the macrocycle form a double helix system as observed in crystals of (M)-[PrLRRRRRR](NO3)3•3CH3CN•32/3H2O, (P)-[CeLSSSSSS](NO3)3•4CH3CN•3H2O and (P)-[LuLRRRRRR](NO3)3•17/8CH3CN•33/4H2O (Scheme 2, Fig. 1, Supporting Fig. S3).
Fig. 1.
Top: views along the direction perpendicular to the C2 axis of the structures of the (M)-[PrLRRRRRR]3+ (right), (P)-[CeLSSSSSS]3+ (middle) and (P)-[LuLRRRRRR]3+ (right) macrocyclic complexes. Bottom: views along the C2 axis of the same complexes.
Although the molecular structures of the (P)-[CeLSSSSSS]3+ and (P)-[LuLRRRRRR]3+ cationic complexes look similar at first sight (Fig. 1), they in fact belong to two types of complexes. The Type I of [LnL]3+ complexes corresponds to the series of (M)-[LnLRRRRRR]3+ complexes and their antipodes (P)-[LnLSSSSSS]3+, while the Type II corresponds to the series of (P)-[LnLRRRRRR]3+ complexes and their antipodes (M)-[LnLSSSSSS]3+. Thus the (M)-[PrLRRRRRR]3+ and (P)-[CeLSSSSSS]3+ complex cations constitute a quasi-enantiomeric pair of complexes and the mirror image of the (P)-[CeLSSSSSS]3+ cation is very similar to the (M)-[PrLRRRRRR]3+ cation.
The main difference between the two types of [LnL]3+ complex is the direction and extent of helical twist of the macrocycle. This twist is reflected by the angle formed by the C3-C38 and C18-C23 bonds (Supporting Fig. S3). For the Type I complexes and the LRRRRRR enantiomer of the ligand one observes the C3-C38-C18-C23 angle values equal to −172.6° for the Ce(III) complex, −174.4° for the Pr(III) complex, −186.8° and −185.5° for the two independent Eu(III) complex molecules2, respectively, and −192.5° and −193.8° for the two independent Yb(III) complex molecules2, respectively. The increase of the values of the C3-C38-C18-C23 angle with the decreasing radius of the metal ion indicates a tighter wrapping of the macrocycle L around the Ln(III) ion. For the Type II complexes the extent of helical twist of the macrocycle is larger. Importantly, the direction of the C3-C38-C18-C23 angle is opposite to that observed for the Type I complexes. The value of this angle is equal to 254.8° and 255.6° for the (P)-[LuLRRRRRR]3+ and (P)-[YbLRRRRRR]3+ cationic complexes, respectively. The positive value reflects the opposite helical twist sense of the LRRRRRR macrocycle in comparison with the Type I complexes. The Type I and Type II diastereomers differ also in the configuration18 at the amine nitrogen atoms. The three 2,6-substituted pyridine fragments of the macrocycle L in the [LuL]3+ complexes form propeller-like structure (Supporting Figs. S4, S5), similar to that observed in tris(dipicolinato)lanthanide anions19
The helical conformation of the ligand was clearly observed also in model structures of three other complexes of LRRRRRR (see Supporting Information). In total six X-ray crystal structures correspond to Type I complexes and three structures correspond to Type II complexes. Importantly all crystals of Type I complexes correspond to the lighter lanthanide(III) ions or complexes of heavier lanthanide(III) ions obtained using relatively short reaction times, while all the Type II structures correspond to crystal of complexes of the heavier Yb(III) and Lu(III) ions obtained using longer reaction times or crystals obtained from the Type I Yb(III) complex grown for an extended period of time. The discussed structures indicate the preferred (M)-helicity of the LRRRRRR ligand in the complexes with the lighter lanthanide ions and (P)-helicity of the ligand in the thermodynamic complexation product with the heavier Ln(III) ions.
Relative Stability of the (M)- and (P)- Diastereomers of the [LnL]3+ Complexes and the Helicity Inversion Process
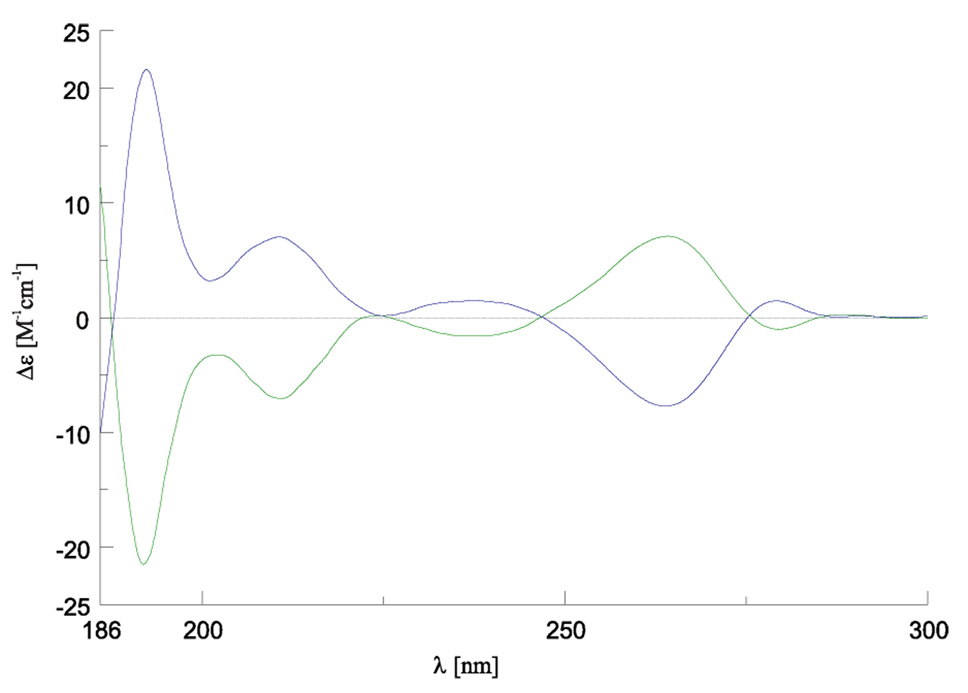
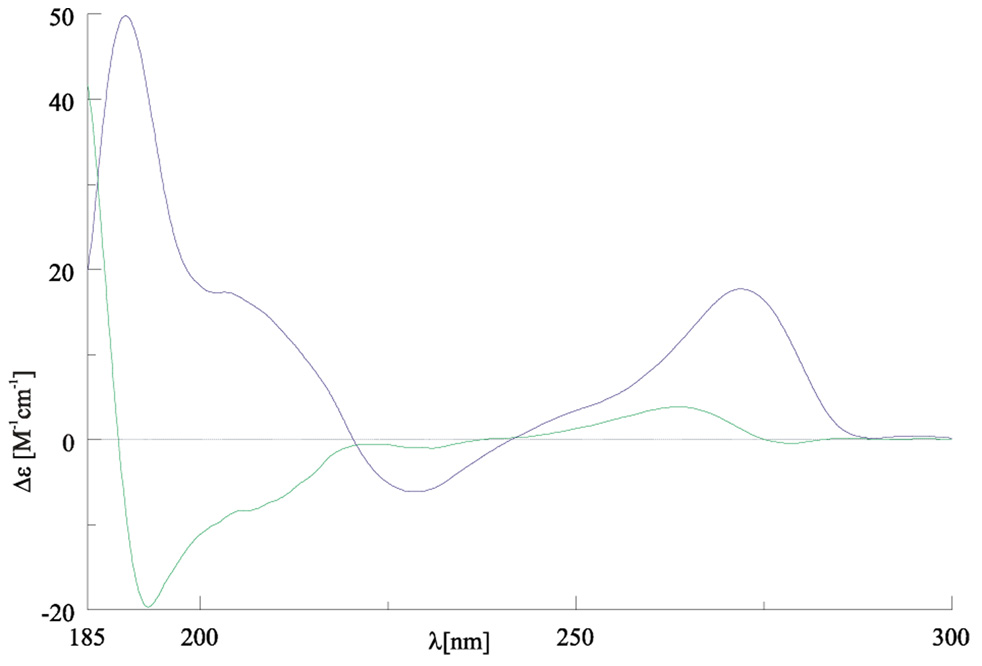
The crystalline Type I and Type II [LnL](NO3)3 complexes give rise to very distinct CD spectra, that are characteristic for each type. For example, the CD spectrum of (M)-[CeLRRRRRR]3+ is similar to that of the structurally characterized (M)-[YbLRRRRRR]3+ complex2, and the CD spectrum of the (P)-[LuLRRRRRR]3+ complex to that of the structurally characterized (P)-[YbLRRRRRR]3+ complex2. As expected the CD spectra of enantiomers are mirror images (Fig. 2, Supporting Fig. S8). Thus for a given Ln3+ ion both the two diastereomeric Type I and Type II complexes and the enantiomers within each pair of these diastereomeric complexes can be distinguished on the basis of their characteristic CD spectra (Fig. 2, Fig. 3, Supporting Figs. S8, S9). Although all four stereoisomers of [LnL]3+ complexes exhibit different CD spectra, the spectra of (P)-[LnLRRRRRR]3+ complexes resemble somewhat to those of the (P)-[LnLSSSSSS]3+ diastereomers and are very different when compared to the spectrum of the parent diastereomers (M)-[LnLRRRRRR]3+ (as is true for the other pair of diastereomers). This is in accord with the fact that the overall shape of the (P)-[LnLRRRRRR]3+ complex is similar to that of the (P)-[LnLSSSSSS]3+ diastereomer (Fig. 1). The above observations reflect the stronger influence of P/M helicity of these complexes on the CD spectra (e.g. via exciton-coupling mechanism) than the influence of R/S configuration at the cyclohexane fragments. The crystalline Type I and Type II [LnL](NO3)3 complexes give rise also to distinct 1H NMR spectra, particularly for paramagnetic lanthanide(III) complexes (see NMR section below). The different CD and NMR spectra allow easy identification of the two types of complexes, as well as monitoring of the conversion of the one type of complex to the other type in solution.
Fig. 2.
The CD spectra of the two enantiomeric [NdL](NO3)3•0.5H2O complexes in 1 × 10⁻³ M H2O solutions: (M)-[NdLRRRRRR]3+ (green ) and (P)-[NdLSSSSSS]3+ (blue).
Fig. 3.
The CD spectra of the two diastereomers of the Er(III) complexes with LRRRRRR in 1 × 10⁻³ M H2O solutions: (M)-[ErLRRRRRR]3+ (green) and (P)-[ErLRRRRRR]3+ (blue).
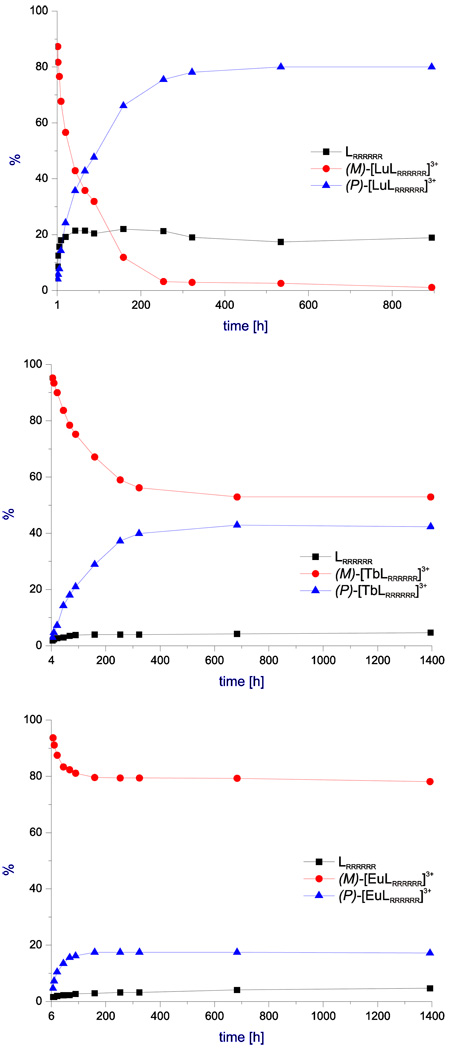
The [LnL]3+ complexes are relatively stable in solution at room temperature, as indicated by their NMR spectra (Fig. S10). However, the prolonged heating of the complexes in water solution results in partial ligand release (Fig. 4, Supporting Fig. S11 and Supporting Table S3). Generally, the (M)-[LnLRRRRRR]3+ isomers are more stable for the early and middle lanthanide(III) ions with the exception of the Ce(III) complex, which decomposes completely after heating for 87 h at 318 K. This latter observation indicates that the slow ligand release is caused by the hydrolysis of the dissociated Ln(III) ions in water solution. The irreversible hydrolysis of the free Ln(III) ions into hydroxides in water solution at elevated temperature results in a shift of the complex dissociation equilibrium. In the case of Ce(III), the hydroxide is irreversibly oxidized to Ce(IV) dioxide (observed in the long-standing samples) what further shifts the dissociation equilibrium. The (P)-[LnLRRRRRR]3+ diastereomers are more stable than the corresponding (M)-[LnLRRRRRR]3+ diastereomers. For instance, the D2O solutions of (P)-[YbLRRRRRR]3+ show no decomposition to the ligand after addition of three equivalents of HCl or NaOH (Fig. S12), while the (M)-[LnLRRRRRR]3+ diastereomers are quickly decomposed to Ln(III) hydroxides after addition of NaOH.
Fig. 4.
The dependence of the relative concentration of the (M)- and (P)-diastereomers on the heating time of 1 × 10⁻² M solutions of (M)-[LnLRRRRRR](NO3)3 complexes (D2O, 318K). The red, blue and black plots represent the (M)- and (P)-[LnLRRRRRR]3+ complexes, and the free ligand LRRRRRR, respectively.
The NMR and CD spectra indicate that the (M)-[LnLRRRRRR](NO3)3 isomers convert to the (P)-[LnLRRRRRR](NO3)3 isomers in solution. The conversion of (M)-diastereomers into (P)-diastereomers corresponds to helicity inversion and is strongly dependent on the size of the Ln(III) ion. The helicity inversion of [LnL]3+ complexes is a slow process, taking weeks at room temperature. This process was followed in more details by recording the 1H NMR spectra of the D2O solutions of the complexes heated at 318 K over a period of two months. At this temperature the apparent first-order rate constant have been estimated to be in the order of 10−6 s−1 (see Supporting Information). In the case of the smallest Ln(III) (Ln = Lu) ion, the (P)-isomeric form of the LRRRRRR ligand is thermodynamically preferred and the conversion of the (M)-isomer, which is a kinetic product of complexation, is practically complete after heating for two weeks at 318 K (Fig. 4, Supporting Table S3). The (P)-isomer is also clearly thermodynamically preferred for the Yb(III) and Er(III) complexes (Supporting Fig. S11), while the Tb(III) exhibits comparable preference for the two diastereomeric forms (Fig. 4). In the case of Eu(III) complexes, the kinetic (M)-[LnLRRRRRR]3+ product is also a thermodynamic product, with the equilibrium ratio of the concentrations of the (M)- and (P)-diastereomers equal to 5:1 (Fig. 4). Finally, only the (M)-form is practically observed for the larger Ln(III) ions (Ln = Ce and Pr, Supporting Fig. S11).
The observed variation for the preferred helix direction along the series of lanthanide(III) ions reflects true thermodynamic effect, i.e. different equilibrium constants for the (M)-[LnLRRRRRR]3+ ↔ (P)-[LnLRRRRRR]3+ reaction, rather than the incomplete conversion process. This is proved by the behavior of the fractions of the Eu(III) complex mixtures enriched in isomer (P) (Supporting Figs. S13 and S14) with the (M)/(P) ratio ranging from 1:1 to 2:1. These fractions were enriched in the less soluble (P)-isomer in the process of fractional recrystallization and do not correspond to the equilibrium concentrations. However, when these samples are kept in solution for 20 days at room temperature, the equilibrium ratio of (M)/(P) equal to 5:1 is restored (Supporting Fig. S14). This experiment indicates that the observed helicity inversion process in the [LnL]3+ complexes is reversible.
NMR spectroscopy – helical conformation of the [LnL]3+ complexes in solution and unusual isotope effect on 1H NMR shifts
The 1H NMR spectra of the isolated Ce(III), Pr(III), Nd(III), Eu(III), Tb(III), Er(III), Yb(III) and Lu(III) complexes correspond to the presence of 29 signals, out of which 3 signals of exchangeable protons gradually disappear in solvents such as D2O or CD3OD (Supporting Figs. S12, S15–S20). This number of lines indicates that the complexed macrocycle L adopts a conformation of C2 symmetry, in contrast to D3 symmetry of the free ligand (reflected in the observation of 10 1H NMR signals17a). In the case of the compounds with paramagnetic Ln(III) ions, the signals span a wide range, and the spectra of the two diastereomers, (M)-[LnLRRRRRR](NO3)3 and (P)-[LnLRRRRRR](NO3)3, are very different (Supporting Figs. S12, S18–S20). This reflects the high sensitivity of 1H NMR shifts of paramagnetic macrocyclic complexes to changes in complex structure.3,20 On the other hand, the difference between the spectra of the two diastereomers of the Lu(III) complex is small (Supporting Fig. S21).
In the case of (P)-[LuLRRRRRR](NO3)3 and (M)-[PrLRRRRRR](NO3)3 complexes, it was possible to assign all the 29 signals on the basis of 2D NMR spectra (Fig. 5, Supporting Figs. S22–S25, see Supporting Information for details).
Fig. 5.
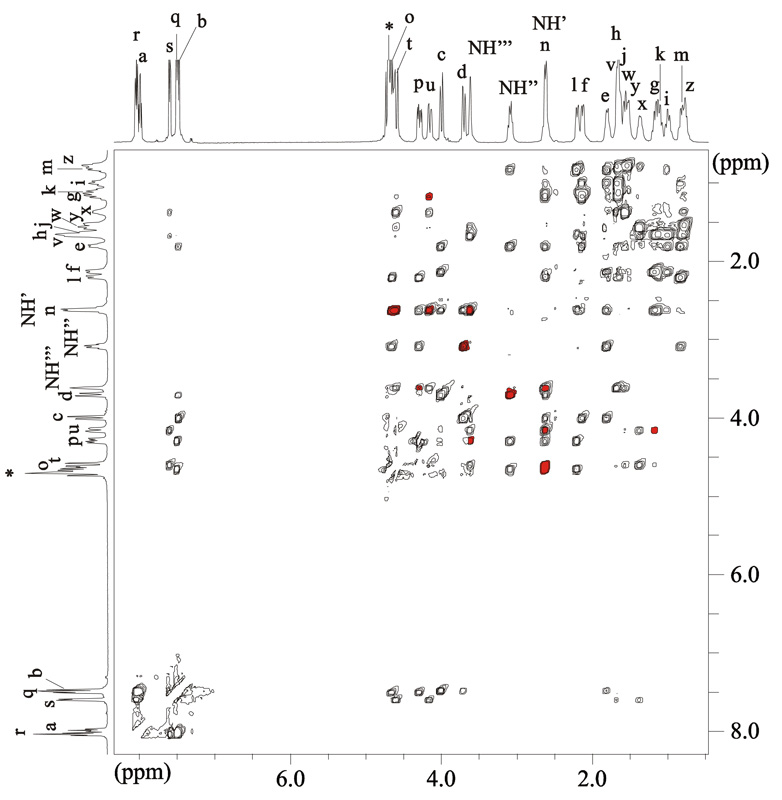
The ROESY spectrum of the (P)-[LuLRRRRRR](NO3)3•7H2O complex (D2O, 298K). Red color indicates the cross-peaks corresponding to short distances characteristic for the twisted form of the macrocycle (see text for details).
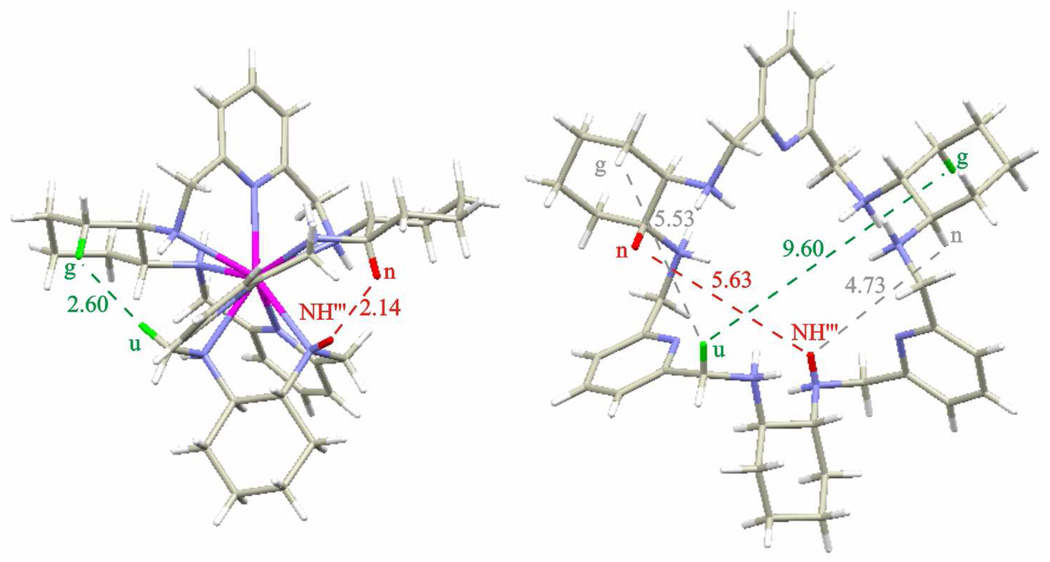
Apart from the crosspeaks, which are expected for the neighboring protons positioned close in space in ligand L, the ROESY spectra of the (P)-[LuLRRRRRR](NO3)3 complex exhibit additional crosspeaks corresponding to pairs of signals of protons tn, tNH’, pNH’”, ug, dNH”, nNH’”, un, and uNH’ (Fig. 5, see Scheme 1 for the labeling of the positions). In Scheme 1 these pairs do not correspond to protons that are close to each other. For the pairs ug, nNH’”, tn and tNH’ the inter-proton distances in the X-ray crystal structure7a of the hydrochloride derivative of L are longer than 4–5 Å, hence the crosspeaks corresponding to these pairs are not expected for the “open” conformation of the macrocycle present in its free protonated form (Fig. 6). Since in the “open” conformation these distances are too long to explain the observation of clear NOE-type correlations in the ROESY spectra, the observation of additional “long range” ROESY correlations firmly indicates that the macrocycle L is considerably squeezed in its Ln(III) complexes. On the other hand, the analysis of the X-ray crystal structure of the (P)-[LuLRRRRRR](NO3)3 complex shows that the distances between the protons corresponding to the pairs of signals tn, tNH’, pNH’”, ug, dNH”, nNH’”, un, and uNH’ are equal to 3.48, 3.60, 2.59, 2.60, 2.60, 2.14, 2.33 and 2.09 Å, respectively, and are fully consistent with the observation of the above NOE-type correlations (Fig. 6). As a result, the observation of the discussed additional ROESY crosspeaks proves that the helical conformation of the ligand, observed in the solid state, is retained in solution. The helical twist of the macrocycle is large enough to place closely in space protons that are positioned across the macrocycle in the “open” conformation. In other words, the two protons in each pair giving rise to additional ROESY correlations (tn, tNH’, pNH’”, ug, dNH”, nNH’”, un, and uNH’) belong to the two symmetry related halves of the macrocycle (Fig. 6).
Fig. 6.
The comparison of the inter-proton distances between the structures of (P)-[LuLRRRRRR]3+ complex (left) and the protonated free macrocycle (right). The two indicated coloured distances correspond to the same pairs of protons u-g (green) and NH’”-n (red).
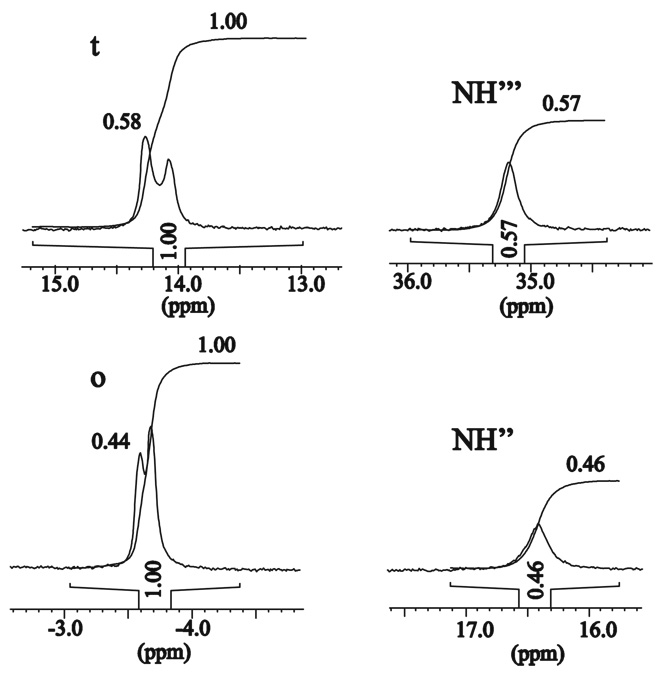
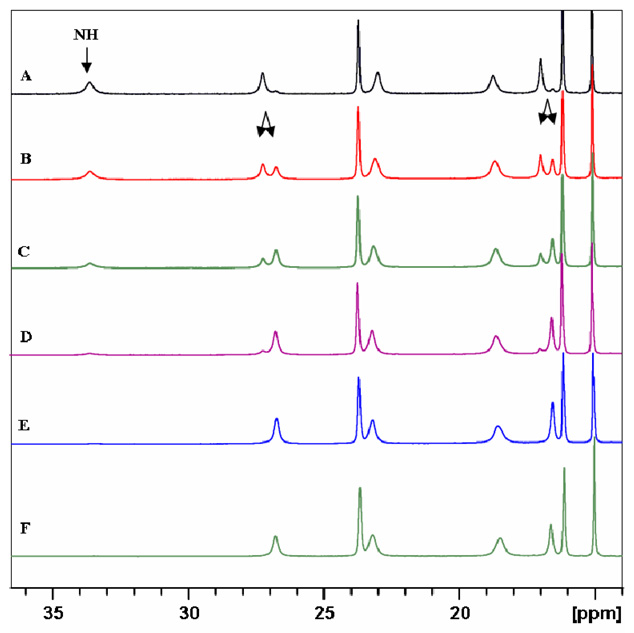
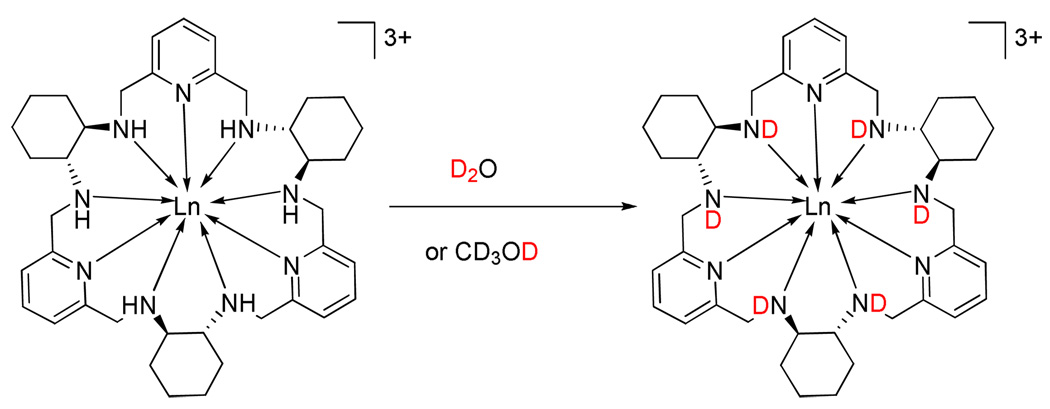
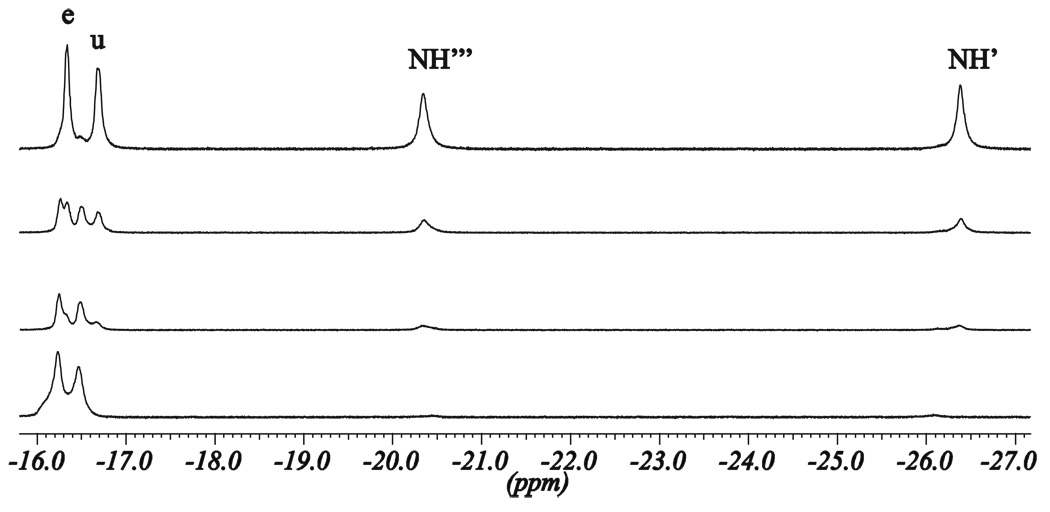
In addition to P/M helicity inversion process, which takes weeks at room temperature, another faster process is revealed by the 1H NMR spectra. The 1H NMR spectra of the D2O, CD3OD, or CD3OD/CDCl3 solutions of the (M)-[LnLRRRRRR](NO3)3 complexes with the paramagnetic lanthanide(III) ions exhibit rather unexpected behavior in time. For the freshly prepared solutions 29 signals are observed, as discussed above. With time a new set of lines gradually appears. The new lines are very close to the original signals, so apparent doubling of signals is observed (Fig. 7–Fig. 9, Supporting Figs. 20, 26). This doubling effect is most pronounced for the strongly paramagnetically shifted resonances, except the signals of the NH protons, which gradually disappear at the same time. Finally, all of the original resonances within each doublet gradually disappear, and a set of 26 lines remains. This unexpected effect is explained by the integration of signals. The changes in time of the relative intensity of the original signals and their gradually growing twin counterparts follow the trend of the disappearance of the amine NH signals (Fig. 7, Fig. 9, Supporting Fig. S26). This proves, that apparent doubling of the resonances is related to the NH/ND exchange (Scheme 3), i.e. the original set of lines corresponds to the complex isotopologue with non-deuterated amine, while the final set of lines corresponds to the complex isotopologue with deuterated amine positions.
Fig. 7.
The fragments of the 1H NMR spectrum (298K, CD3OD/CDCl3 1:2 v/v) of the partially deuterated (M)-[EuLRRRRRR](NO3)3•4H2O complex illustrating the doubling of the signals o and t, correlated to the changes of intensity of signals NH” and NH’”, respectively.
Fig. 9.
The fragments of the 1H NMR spectra (298K, CD3OD) of (P)-[YbLRRRRRR](NO3)3•6H2O complex, illustrating the disappearing of NH signal, doubling of the resonances due to isotope effect and the influence of added base. Traces A – E : spectra measured after 0.45 h, 1.45 h, 2.45 h, 4.45h, and 27h, respectively; trace F: spectrum of a sample containing 5 µL of N(C2H5)3 measured after 0.25 h.
Scheme 3.
The NH/ND exchange in the [LnL]3+ complexes.
This explanation is additionally supported by the fact that the largest shift differences between the original signal and the new signal are observed for the positions close to the amine nitrogen atoms, e.g. protons o, t, e and u (Fig. 7, Fig. 8). The observed apparent splitting of signals represent an interesting case of isotope effect, since the influence of deuteration of the nitrogen atoms on the 1H NMR shifts of the adjacent carbon-attached protons is very strong. The maximum differences between the shift values of the non-deuterated and deuterated isotopologues, Δ1H(D), amount to 460, 320, 190 and 280 ppb for the Yb(III), Tb(III), Eu(III) and Pr(III) Type I complexes, respectively.
Fig. 8.
The fragments of the 1H NMR spectra recorded over 27 h (298K, CD3OD/CD3CN) of the (M)-[PrLRRRRRR](NO3)3•H2O complex, illustrating the doubling of the resonances due to isotope effect. Spectra measured after (from top) 15 min, 2 h 30 min, 5 h and 27 h.
The discussed isotope effect is even larger for the Type II complex (P)-[YbLRRRRRR](NO3)3•6H2O, with the maximum Δ1H(D) value as high as 500 ppb (Fig. 9). The NH/ND exchange process is much faster than the P ↔ M helicity inversion process, as seen in Suppporting Fig. S26. For example, the apparent first-order rates for this exchange (CD3OD solutions, 298K) are equal to 1.54×10⁻⁴ s−1 and 1.65×10⁻⁴ s−1 for the two different NH positions of the (P)-[YbLRRRRRR](NO3)3•6H2O complex, 1.15×10⁻⁴ s−1 for the (M)-[PrLRRRRRR](NO3)3•H2O complex and 1.0×10⁻⁴ s−1 for the (M)-[YbLRRRRRR](NO3)3]•CHCl3•H2O complex (Figs. S33, S34). The deuteration of amine nitrogen atoms in the [LnL]3+ complexes is accelerated by bases such as triethylamine (Fig. 9, Supporting Fig. S27) and is inhibited by acids such as HNO3 (Supporting Fig. S27). This influence of acid/base on the NH/ND exchange is opposite to that expected for associative mechanism of deuteration of free amine ligand L, i.e. protonation of amine nitrogen atoms. The observed effects may be explained for instance by dissociative mechanism of deuteration of complexed amine (i.e. deprotonation of NH groups), with the amide type [LnL−H]2+ complexes as intermediates. As mentioned above, the [LnL−H]2+ species were observed in the ESI-MS spectra. The somewhat different rates of NH/ND exchange for the non-equivalent nitrogen positions in the same complex indicate that the deuteration process corresponds to intact complex and is not related to dissociation of the ligand.
Large isotope effects on the 1H NMR shifts were previously observed for some metalloproteins containing iron porphyrins21 and synthetic iron porphyrins22. In both cases, the magnitude of the shift difference is predominantly determined by the presence of paramagnetic metal ion, and the isotope effect arises from the change of the contact contribution to the isotropic shift. Large isotope effects on 1H NMR shifts are also observed in hydrogen-bonded systems.23 In our case, the observed unusually large isotope effect may reflect the sensitivity of dipolar shifts to subtle changes in the complex structure.
Photophysical and chiroptical properties
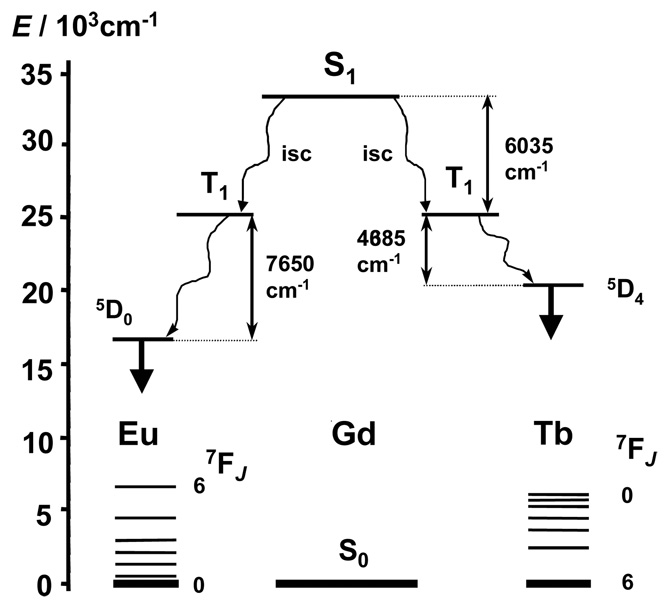
The intense band observed in the electronic spectrum of LRRRRRR at 37 585 cm−1 is only slightly red-shifted upon complexation with Ln(III) ions (ca. 815 cm−1, Table 1). On the other hand, ligand emission is observed for the complexes. Fluorescence from a short-lived 1ππ* state occurs for all complexes while ligand phosphorescence from a long-lived 3ππ* state is seen for the Gd(III) complex only, an efficient 3ππ*-to-Ln energy transfer process taking place for Eu(III) and Tb(III) and resulting in metal-centred emission exclusively (Supporting Fig. S28). The emission from the ligand 1ππ* state in the Eu(III) and Tb(III) complexes suggests an incomplete intersystem crossing (isc) from the singlet to the triplet state.
Table 1.
Ligand-centred absorptions in MeOH solutions (295 K), ligand-centred singlet- and triplet-state energies as determined from emission spectra of solutions 2–3 × 10⁻⁵ and 3–4 × 10⁻⁴ M in MeOH (295 and 77 K) for the ligand LRRRRRR and its Ln(III)-containing complexes, respectively.a
| Compound | E(x→π*)/cm−1b | E(1ππ*)/cm−1 | E(3ππ*)/cm−1 | |
|---|---|---|---|---|
| solutionc | solution | solid stated | solid stated | |
| LRRRRRR | 36 500 (4.10) sh | 33 615 | 29 585 (sh) | 24 905 |
| 37 585 (4.22) | 32 260 | |||
| [GdLRRRRRR]3+ | 35 750 (4.40) sh | 32 305 | 30 910 (sh) | 24 875 |
| 36 760 (4.57) | 32 155 | 27 960 (sh) | ||
| [EuLRRRRRR]3+ | 35 750 (3.94) sh | 32 305 | e | e |
| 36 770 (4.12) | ||||
| [TbLRRRRRR]3+ | 35 750 (4.00) sh | 32 305 | e | e |
| 36 770 (4.18) |
sh = shoulder
x = n or π
At the concentration used, the 1H-NMR spectra recorded at room temperature and 213 K show only one set of signals suggesting the presence of only one diastereomer in MeOH solution; Logε values are given between parentheses
Values given for frozen solutions in MeOH
Not observed because of the LRRRRRR-to-Ln energy transfer process
The very small fluorescence quantum yields of the free ligand (QF = 0.8%) and complexed ligand in the Gd(III) complex (QF = 0.7%) confirmed that LRRRRRR is weakly luminescent. The quantum yields of the metal-centred luminescence obtained upon ligand excitation are small, QLnL = 0.03 and 3.0% for Eu and Tb, respectively. They may be explained by the weak efficiency of the isc process, the emission from the 1ππ* is still visible on the emission spectra, and by the relative energies of the triplet state of the complexed ligand and of the excited 5D0 and 5D4 levels (Fig. 10 and S28).24 Another factor that may also largely contribute to the small quantum yields of the Eu(III) and Tb(III) complexes is the weak efficiency of the luminescence sensitization by the ligand (ηsens = 7 × 10⁻³, see Supporting Information). However, the presence of efficient non-radiative processes originated from the NH oscillators of the macrocyclic amine has a profound effect on the luminescence quantum yields. This effect is reflected in steady increase of luminescence intensity of the solutions of the (M)-[EuLRRRRRR](NO3)3•4H2O complex in CD3OD (Fig. S30). The time-scale of this increase corresponds to slow deuteration of the amine nitrogen atoms observed in the NMR spectra discussed above (Scheme 3). The effect of NH oscillators has also been confirmed by the measurement of the luminescence lifetimes of the Eu(III) complex with LRRRRRR in MeOH and CD3OD (τMeOH = 0.18 ms and τCD3OD = 0.90 ms). Insertion to these τ values to the modified equation25,26:
(where q is the number of coordinated water molecules, 1/A is a decay constant for the water molecule oscillators, γ is a decay constant for the amine NH oscillators, nNH is the number of NH groups and α is a correction for quenching by outer-sphere solvent molecules) gives negative q value of coordinated water molecules for the α, γ and A parameters taken from ref. 25 or 26. Since the NMR data for the Lu(III) complex indicate that the structure of the complex in solution corresponds to that in the solid state, most likely the structure of the (M)-[EuLRRRRRR]3+ cation in solution is also reflected by its X-ray crystal structure and water molecules are not bound to Eu3+ ion. Substitution of q = 0, nNH = 6 and α = 0 in the above equation yields γ value equal to 0.74 ms−1, which is smaller to that reported in ref. 25 (1.2 ms−1) and ref. 26 (0.99 ms−1). On the other hand, this γ value is similar to that of 0.759 ms−1 determined30 for NH oscillators in Eu(III) complexes of ethylenediamine. It should be noted that the number of studied cases is rather limited, and the differences in γ values may reflect the sensitivity of the quenching rate to the distance, as well as the influence of the possible H-bonds on the NH oscillators. Similarly, the lifetimes determined for the (M)-[TbLRRRRRR]3+ complex (τMeOH = 0.28 ms and τCD3OD = 0.31 ms) allow to calculate the γ constant for Tb(III) equal to 0.058 ms−1, in comparison to 0.073 ms−1 determined27 for the Tb(III) complexes of ethylenediamine.
Figure 10.
Schematic energy diagram for Eu(III)- and Tb(III)-containing complexes with LRRRRRR. Data for S1 and T1 are those of the Gd(III) complex in frozen MeOH solution at 77 K.
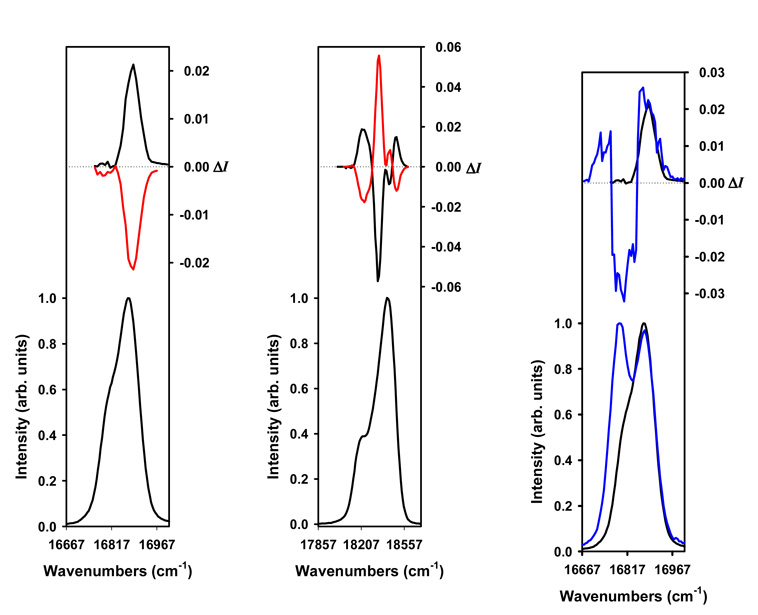
We have resorted to circularly polarized luminescence (CPL) to study the chiroptical properties of the Eu(III)- and Tb(III)-containing compounds. Generally speaking, CPL spectroscopy is the emission analog to circular dichroism (CD) spectroscopy. CD allows one to detect the differential absorption of left and right circularly polarized light, while CPL measures the difference in the emission intensity of left circularly polarized light versus right circularly polarized light. CPL has primarily been focused on studies aimed at investigating the chiral structures and solution dynamics of luminescent lanthanide complexes.10a, 28, 29 The CPL spectra of 1 × 10⁻² M solutions of the Eu(III) and Tb(III) complexes with each optical isomer of L, LRRRRRR and LSSSSSS, are plotted in Figure 11 in the spectral range of the 5D0→7F1 and 5D4→ 7F5 transitions, which are particularly well-suited for CPL measurements since they satisfy the magnetic-dipole selection rule, ΔJ = 0, ±1 (except 0↔0), respectively. The CPL spectra of each of these complex solutions were measured following excitation at 283–284 nm in MeOH at 295 K. As shown in Fig. 11, the detection of a CPL signal confirmed the presence of stable chiral emitting species on the luminescence time scale, and almost perfect mirror-image CPL spectra for the Eu(III) and Tb(III) complexes with both enantiomers, LRRRRRR and LSSSSSS, were obtained. It is common to report the degree of CPL in terms of the luminescence dissymmetry factor, glum(λ), which is defined as follows:
where IL and IR refer, respectively, to the intensity of left and right circularly polarized emissions. The glum values of the (M)-[LnLRRRRRR]3+ or (P)-[LnLSSSSSS]3+ (Ln = Eu and Tb) complexes amounted to +0.02 or −0.02 at 16 890 cm−1, and −0.01, +0.06, and −0.02 or +0.01, −0.06, and +0.02 at 18 495, 18 445, and 18 210 cm−1 in the spectral region of the 5D0→7F1 (Eu) and 5D4→7F5 (Tb), respectively. These CPL results suggest that the emitted light is polarized in a direction determined by the helicity of the Eu(III) and Tb(III) ions, which in turn is controlled by the absolute configuration at the diaminocyclohexane carbon centers.
Figure 11.
Circularly polarized luminescence (upper curve) and total luminescence (lower curve) spectra of (M)-[LnLRRRRRR]3+ (Ln = Eu, Tb, black) and (P)-[LnLSSSSSS]3+ (Ln = Eu, Tb, red) in 1 × 10⁻² M MeOH at 295 K, upon excitation at 283–284 nm, respectively. Left: 5D0→7F1 (Eu) transition, middle: 5D4→7F5 (Tb) transition, and right: 5D0→7F1 transition of (M)-[EuLRRRRRR]3+ (black) and a 3.5:1 (M)-[EuLRRRRRR]3+:(P)-[EuLRRRRRR]3+ complex solution (blue).
Although it was not possible to isolate the pure (P)- and (M)-diastereisomeric forms of the same Eu(III) or Tb(III) complex (i.e. [LnLRRRRRR]3+ or [LnLSSSSSS]3+), we have recorded the CPL spectrum of a 1 × 10⁻² M solution containing a mixture of the (M)-[EuLRRRRRR]3+ and (P)-[EuLRRRRRR]3+ isomers with a (M):(P) ratio of 3.5:1 in MeOH. By comparing it to the one of (M)-[EuLRRRRRR]3+ (see Fig. 11), the observed CPL spectrum of the 3.5:1 (M)-[EuLRRRRRR]3+:(P)-[EuLRRRRRR]3+ complex solution reveals several peaks corresponding to the contribution of each diastereoisomer present in solution. The CPL of the 3.5:1 (M)-[EuLRRRRRR]3+:(P)-[EuLRRRRRR]3+ complex solution shows that the weak single band, which is positive in sign, observed in the 16 665–16 835 cm−1 region of the CPL of (M)-[EuLRRRRRR]3+ is made up of two components – positive and negative in sign – with the latter being the most intense. These results clearly indicate that the observed CPL changes (i.e. sign, magnitude and/or shape) are due to the influence of the different local helicity ((M) and (P)) at the metal center for the two diastereoisomers present in solution. Otherwise, mirror-image CPL spectra would be observed if the polarization of the emitted light would be controlled by the absolute configuration at the diaminocyclohexane carbon centers, as shown for (M)-[LnLRRRRRR]3+ and (P)-[LnLSSSSSS]3+ in Fig. 11. The observation of one peak centred at 16 875 cm−1, and two peaks centred at 16 875 and 16 790 cm−1 in the Eu(III) total luminescence spectra of (M)-[EuLRRRRRR]3+ (or (P)-[EuLSSSSSS]3+) and of the 3.5:1 (M)-[EuLRRRRRR]3+:(P)-[EuLRRRRRR]3+ complex solution is also consistent with the presence of each diastereoisomeric form of [EuLRRRRRR]3+ in the latter complex solution, respectively (Fig. 11). It should be noted that the observed CPL changes between the CPL spectra of a 1 × 10⁻² M (M)-[TbLRRRRRR]3+ complex solution measured before and after the solution was heated at 328 K for three weeks also confirmed that the polarization of the emitted light is controlled by the (M)/(P) helicity at the metal center. As shown in Fig. S29, noticeable spectral changes were observed in the Tb(III) total luminescence and CPL spectra. In agreement with the fact that Eu(III) in theory has a simpler crystal field energy level pattern than Tb(III), the spectral changes observed are less obvious for the Tb(III) systems than for the Eu(III) complex solutions.
Conclusions
Both the X-ray crystal structures of the [LnL](NO3)3 complexes and ROESY spectra of the Lu(III) complex show that the large nonaaza macrocycle L has to wrap thightly around the Ln(III) ions in order to form [LnL]3+ complexes. In these complexes the two halves of the ligand form a double-helical system. Moreover, the [LnL](NO3)3 complexes can exist in two diasteromeric forms of opposite helicity, which have the same chirality at all stereogenic carbon centres and are synthesized from the same enantiomer of chiral ligand. For the all-R enantiomer of the ligand, the binding of the Ln(III) ions results in kinetic complexes of M-helicity, (M)-[LnLRRRRRR]3+. These M-helical complexes slowly convert in the helicity inversion process into the (P)-[LnLRRRRRR]3+ diastereomers. Unlike most known cases of helicity inversion11–15, the described process corresponds to conversion between well-defined, exact diastereomers, which enantiopure forms have been characterized on the basis of NMR, CD, ESI-MS and X-ray crystal data. The helicity inversion process in [LnL]3+ complexes is strongly dependent on the size of Ln3+ ion and is not observed for the lighter lanthanide(III) ions. Thus the (M)-[LnLRRRRRR]3+ complex is the theromodynamic product in the case of Pr(III) ion, while the (P)-[LnLRRRRRR]3+ complexes are the thermodynamic product in the case of Yb(III) and Lu(III) ions.
Finally, the CPL results (i.e. stable chiral emitting species and mirror image CPL spectra) are in line with the results of the CD and 1H NMR studies. As discussed above, the Ln(III) complexes are quite stable in solution at room temperature, while the conversion of (M)-diastereomer into (P)-diastereomer, corresponding to a helical inversion, is a slow process in methanol at room temperature (Supporting Fig. S10). On the other hand, the photophysical properties of the ligand L and its Ln(III) complexes demonstrate that the various energy conversion processes occurring in the former compounds are not optimum. In particular, an incomplete isc transfer, a weak efficiency of the luminescence sensitization by the ligand, and/or efficient non-radiative deactivation processes may largely contribute to the weak ligand- and metal-centered luminescent quantum yields.
Experimental
Measurements
The NMR spectra were taken on Bruker Avance 500 and AMX 300 spectrometers. The chemical shifts were referenced to the residual solvent signal or DSS. The gradient COSY, TOCSY, NOESY, ROESY and HMQC spectra were acquired using 512×1K data points and zero filled to 1K×1K matrix. Mixing times 25–200 ms were used in NOESY and ROESY experiments. The CD spectra were measured on Jasco J-715 Spectropolarimeter. The positive-mode electrospray mass spectra of ca. 1 × 10⁻⁶ M methanol solutions of the complexes were obtained using Bruker microOTOF-Q instrument. The elemental analyses were carried out on a Perkin-Elmer 2400 CHN elemental analyzer. Electronic spectra in the UV/Vis range were recorded at 295 K with a Varian Cary 50Bio spectrometer using 1.0 and 0.1 cm quartz cells. Fluorescence and phosphorescence spectra were recorded on a Varian Cary Eclipse and Perkin-Elmer LS-50B spectrometers equipped for low temperature (77 K) measurements. Luminescence lifetimes were measured on the Varian Cary Eclipse utilizing the short phosphorescence decay software package. Quantum yields were determined using the following equation:
where A is the absorbance at the excitation wavelength (λ), I is the intensity of the excitation light at the same wavelength, n is the refractive index, D is the integrated luminescence intensity, and the subscript “x” refers to the sample and “r” to the reference. The spectra were corrected for instrumental functions. Quantum yields of the ligand- and metal-centred emissions were measured relative to quinine sulfate in 0.05 M H2SO4 (QF = 54.6%)30 and [Ln(2,6-pyridine-dicarboxylate = DPA)3]3− in Tris buffer (0.1 M) for Eu (QEuL = 13.5%)30 and Tb (QTbL = 26.5%)31, respectively. CPL measurements were made on an instrument described previously, operating in a differential photon-counting mode.28c,29b
The crystallographic measurements were performed on κ–geometry Kuma KM4CCD automated four-circle diffractometers (ω–scan) with graphite–monochromatized MoKα radiation. The data for the crystals were collected at 100(2) K. The data were corrected for Lorentz and polarization effects, and analytical absorption correction was applied. Data collection, cell refinement, and data reduction and analysis were carried out with the KM4CCD software (Oxford Diffraction Poland): CrysAlis CCD and CrysAlis RED, respectively.32 The structures of complexes were solved by direct methods using the SHELXS-97 program.33 The crystals of (M)-[PrLRRRRRR](NO3)3•3CH3CN•32/3H2O, (P)-[CeLSSSSSS](NO3)3•4CH3CN•3H2O and (P)-[LuLRRRRRR](NO3)3•17/8CH3CN•33/4H2O were grown by slow evaporation of the methanol/acetonitrile solutions. Suitable crystals were cut from larger ones and mounted on a Kuma KM4 diffractometer. The structures were solved in a routine way (SHELXS97, SHELXL97)33, 34, using the SHELXTL35 program package. All figures were made with SHELXTL35, MERCURY36 and DIAMOND37 programs. The structures suffered from partial disorder of solvent (water and acetonitrile) molecules. In (P)-[LuLRRRRRR](NO3)3•17/8CH3CN•33/4H2O 2.75 water and 0.875 acetonitrile molecules per asymmetric part were disordered. In (M)-[PrLRRRRRR](NO3)3•3CH3CN•32/3H2O and (P)-[CeLSSSSSS](NO3)3•4CH3CN•3H2O all the water molecules were disordered and apart from that in (P)-[CeLSSSSSS](NO3)3•4CH3CN•3H2O a CH3CN molecule was disordered, too. The positions of C- and N-bonded H atoms were calculated from geometry, excluding disordered acetonitrile molecules. All ordered non-H atoms were refined anisotropically, the disordered ones were isotropic and the isotropic thermal vibration factors of the H atoms were 1.2 times the trace of the anisotropic factors of relevant adjacent C or N atoms. The occupation factors of the disordered molecules were chosen so to warrant maximum filling of the space and were not refined. The data pertinent to the data collection and refinement are given in Supporting Table S1.
Synthesis
LRRRRRR amine (or LSSSSSS amine)
The solution of 1 mmol (135.1 mg) of 2,6-diformylpyridine in 43 ml of methanol was combined with the solution of 1 mmol (114.2 mg) of trans-(1R,2R)-diaminocyclohexane (or trans-(1S,2S)-diaminocyclohexane) in 7 ml of methanol and stirred for 30 min. at room temperature. The formed mixture of Schiff base macrocyles was reduced on a water bath with 12 mmol (454 mg) of NaBH4, which was gradually added for 2 hrs. The stirring was continued for 2 hrs and the mixture was evaporated to dryness under reduced pressure. The residue was redissolved in 15 ml of water and solid NaOH was added until pH was ca. 14. The precipitated white solid was extracted with 3 × 5 ml of dichloromethane and the organic fractions were dried over anhydrous Na2SO4. The solution was filtered and evaporated to dryness. The crude product was purified by fractional recrystallization from dichloromethane/acetonitrile mixture. The obtained white product was filtered, washed with 1 ml of cold acetonitrile and dried. Yield 118.6 mg (54.58%). ESI-MS: m/z: 652.2 C39H58N9+; 674.2 C39H57N9Na+. 1H NMR (CDCl3) δ 7.59 (3H, t); 7.21 (6H, d); 4.00 (6H, d); 3.78 (6H, d); 3.47 (6H, broad); 2.31 (6H, m); 2.03 (6H, m); 1.99 (6H, m); 1.01 - 1,24 (12H. m). Anal. Calc. (found) for C39H58N9O0.5: C, 70.87 (70.98); H, 8.84 (8.57); N, 19.07 (19.17).
[LnL](NO3)3•nH2O complexes of the Type I (Ln = Ce, Pr, Nd, Eu, Gd, Tb)
The solution of 0.2 mmol (130.4 mg) of an appropriate enantiomer of macrocycle L in 8 ml of methanol was combined with the solution of 0.2 mmol of Ln(NO3)3•nH2O in 8 ml of methanol and the mixture was refluxed for 1 hr (30 min. in the case of Ce(III) complexes). The solution was evaporated to dryness and the residue was dissolved in a mixture of 2 ml of methanol and 8 ml of acetonitrile. The solution was concentrated on rotary evaporator until precipitate appeared. The mixture was left overnight in the freezer. The obtained precipitate was filtered, washed with small amounts of cold acetonitrile and dried.
(M)-[CeLRRRRRR](NO3)3•2H2O
Yield 137.3 mg (67.7%). ESI-MS: m/z: 263.8 [CeL]3+, 426.7 {[CeL](NO3)}+, 915.5 {[CeL](NO3)}2+. 1H NMR (500 MHz, D2O, 298K): δ −13.49, −8.64, −7.60, −1.81, −1.46, −1.46, −1.10, −0.73, −0.48, 0.29, 0.63, 1.13, 1.74, 1.93, 2.36, 2.43, 2.63, 2.83, 3.12, 3.12, 5.17, 6.38, 7.86, 8.29, 9.12, 9.23, 9.69, 10.04, 10.22. 1H NMR (500 MHz, CD3CN, 298K): δ −15.35, −10.13, −8.40, −2.42, −1.75, −1.38, −1.00, −0.97, −0.64, 0.25, 0.50, 1.07, 2.17, 2.29, 2.40, 2.46, 2.70, 3.13, 3.15, 3.37, 5.60, 7.74, 7.93, 8.53, 9.15, 9.46, 9.73, 10.25, 10.33. Anal. calc. (found) for CeC39H61N12O11: C, 46.19 (46.14); H, 6.06 (5.74); N, 16.57 (16.70). CD [H2O, 298K, λmax/nm (ε/M−1cm−1)]: 192 (−26), 201 (−3.3), 210 (−7.1), 227 (0.7), 239 (−0.7), 264 (6), 279 (−1.8).
(P)-[CeLSSSSSS](NO3)3•2H2O
CD [H2O, 298K, λmax/nm (ε/M−1cm−1)]: 192 (25), 200 (3.7), 209 (7.6), 227 (−0.7), 240 (0.6), 264 (−6), 279 (1.8).
(M)-[PrLRRRRRR](NO3)3•H2O
Yield 141.2 mg (70.8%). ESI-MS: m/z: 264.1 [PrL]3+, 427.2 {[PrL](NO3)}+, 916.4 {[PrL](NO3)}2+. 1H NMR (500 MHz, D2O, 298K): δ −25.38, −21.16, −16.66, −15.54, −4.23, −3.92, −2.50, −1.96, −0.56, −0.56, −0.56, −0.05, −0.05, −0.05, 0.01, 0.08, 0.70, 1.29, 1.36, 1.80, 4.56, 5.95, 6.69, 7.47, 9.20, 12.60, 16.42, 21.27, 21.64. 1H NMR (500 MHz, CD3CN, 298K): δ −28.05, −19.72, −17.41, −16.91, −4.46, −3.88, −2.70, −1.24, −0.52, −0.17, −0.15, −0.04, −0.03, 0.48, 1.27, 1.35, 1.69, 1.98, 3.6, 4.32, 6.41, 6.64, 7.92, 9.16, 12.48, 16.14, 20.90, 21.41. Anal. Calc. (found) for PrC41H72N13O15: C, 43.66 (43.60); H, 6.43 (6.13); N, 16.14 (16.21). CD [H2O, 298K, λmax/nm (ε/M−1cm−1)]: 192 (−25.3), 201 (−3.4), 209 (−6.2), 225 (1.1), 237 (−0.9), 267 (4.5) 280 (0.6), 284 (0.9).
(P)-[PrLSSSSSS](NO3)3•H2O
CD [H2O, 298K, λmax/nm (ε/M−1cm−1))]: 192 (24), 201 (3), 210 (6), 224 (−1), 238 (0.7), 266 (−4) 280 nm (−0.5), 284 (−1).
(M)-[NdLRRRRRR](NO3)3•0.5H2O
Yield of 150.7 mg (76.0%). ESI-MS: m/z: 396.2 [NdL−H]2+, 856.4 {[NdL−H](NO3)}+, 919.3 {[NdL](NO3)2}+. 1H NMR (500 MHz, D2O, 298K): δ −17.21, −11.77, −3.81, −1.12, −0.58, −0.25, −0.13, 0.03, 0.12, 0.62, 0.86, 0.94, 1.93, 2.24, 2.57, 2.84, 3.43, 4.11, 4.59, 5.15, 5.57, 6.32, 6.96, 7.93, 7.93, 8.84, 9.59, 11.16, 17.35. 1H NMR (500 MHz, CD3CN, 298K): δ −17.64, −11.40, −3.76, −0.88, −0.24, −0.24, −0.24, −0.08, 0.40, 0.70, 0.74, 0.90, 0.92, 2.12, 2.80, 3.21, 3.72, 3.90, 5.88, 6.71, 7.21, 8.10, 8.21, 8.63, 9.68, 11.08, 17.27. Anal. Calc. (found) for NdC39H58N12O10.5: C, 47.26 (47.20); H, 5.90 (5.68); N, 16.96 (16.92). CD [H2O, 298K, λmax/nm (ε/M−1cm−1)]: 192 (−22), 201 (−3.3), 210 (−6.6), 225 (0.4), 238 (−1.5), 264 (7), 279 (−1.2).
(P)-[NdLSSSSSS](NO3)3•0.5H2O
CD [H2O, 298K, λmax/nm (ε/M−1cm−1))]: 192 (22), 201 (3), 211 (−7), 225 (−0.5), 237 (1.0), 264 (−8), 279 (2.0).
(M)-[EuLRRRRRR](NO3)3•4H2O
Yield 160.8 mg (75.7%). NMR identical to that of the previously synthesized (M)-[EuLRRRRRR](NO3)3•CHCl3•2H2O complex2. Anal. Calc. (found) for EuC39H65N12O13: C, 44.11 (43.77); H, 6.17 (5.93); N, 15.83 (15.65). CD [H2O, 298K, λmax/nm (ε/M−1cm−1)]: 193 (−17), 200 (−5.8), 208 (−8.8), 228 (−0.5), 236 (−0.4), 263 (6), 278 (−0.9).
(P)-[EuLSSSSSS](NO3)3•4H2O
CD [H2O, 298K, λmax/nm (ε/M−1cm−1)]: 192 (−18), 201 (6.1), 208 (9.1), 227 (0.5), 236 (0.2), 264 (−5.4), 277 (−1.4).
(M)-[GdLRRRRRR](NO3)3•4H2O
Yield 136 mg (63.7%). ESI-MS: m/z: 269.8 [GdL]3+, 404.2 [GdL−H]2+. Anal. Calc. (found) for GdC39H65N12O13: C, 43.89 (43.55); H, 6.14 (6.28); N, 15.75 (15.70). CD [H2O, 298K, λmax/nm (ε/M−1cm−1))]: 194 (−19), 201 (−8.2) 208 (−11), 224 (−1.3), 229 (−1.7), 263 (6.6), 278 (−0.8).
(M)-[TbLRRRRRR](NO3)3•4H2O
NMR identical to that of the previously synthesized (M)-[TbLRRRRRR](NO3)3•CHCl3•2H2O complex2. Anal. Calc. (found) for TbC39H65N12O13: C, 43.82 (43.51); H, 6.13 (5.81); N, 15.72 (15.53). CD [H2O, 298K, λmax/nm (ε/M−1cm−1)]: 193 (−19), 201 (−8.6), 207 (−8.7), 226 (−0.4), 230 (−0.8), 264 (3.7), 277 (−0.6).
(P)-[TbLSSSSSS](NO3)3•4H2O
CD [H2O, 298K, λmax/nm (ε/M−1cm−1)]: 193 (−20), 202 (7.6), 207 (7), 225 (0.1), 229 (0.3), 264 (−3.3), 278 (0.8).
[LnL](NO3)3•CHCl3•nH2O complexes of the Type I (Ln = Er, Lu)
The solution of 0.2 mmol (130.4 mg) of an appropriate enantiomer of macrocycle L in 8 ml of chloroform was combined with the solution of 0.2 mmol of Ln(NO3)3•nH2O in 4 ml of methanol, and the mixture was refluxed for 40 min‥ The mixture was filtered, the volume of the filtrate was reduced to ca. 6 ml and 8 ml of chloroform was added. The solution was concentrated on rotary evaporator until precipitate appeared and left overnight in the freezer. The obtained precipitate was filtered, washed with small amounts of cold chloroform and dried under vacuum.
(M)-[ErLRRRRRR](NO3)3•CHCl3•2.5H2O
Yield 92.3 mg (39.5%). ESI-MS: m/z: 273.2 [ErL]3+, 440.2 {[ErL](NO3)}+, 943.6 {[ErL](NO3)}2+. 1H NMR (500 MHz, D2O, 298K): δ −41.41, −32.58, −10.95, −10.42, −8.99, −7.13, −6.27, −5.33, −2.76, −1.94, −1.17, −1.17, −0.46, −0.46, −0.46, 6.98, 6.98, 6.98, 8.07, 8.49, 14.29, 15.78, 15.78, 27.17, 37.08, 51.65, 68.96. Anal. Calc. (found) for ErC40H63N12O11.5Cl3: C, 41.08 (40.87); H, 5.43 (5.25); N, 14.37 (14.68). CD [H2O, 298K, λmax/nm (ε/M−1cm−1)]: 193 (−20), 206 (−8.4), 223 (−0.5), 231 (−1.0), 264 (3.9), 279 (−0.4).
(M)-[LuLRRRRRR](NO3)3•CHCl3•2H2O
Yield 127.3 mg (54.5%). ESI-MS: m/z: 275.5 [LuL]3+, 444.2 {[LuL](NO3)}+, 950.4 {[LuL](NO3)}2+. 1H NMR (500 MHz, D2O, 298K): δ 0.78, 0.84, 0.96, 0.96, 1.16, 1.32, 1.41, 1.59, 1.62, 1.66, 1.77, 1.95, 2.15, 2.35, 2.55, 2.78, 3.30, 3.78, 3.98, 4.00, 4.22, 4.64, 4.52, 4.67, 7.48, 7.49, 7.57, 7.98, 8.04. Anal. Calc. (found) for: LuC40H62N12Cl3O11 C, 41.12 (41.11); H, 5.35 (5.52); N, 14.39 (14.69). CD [H2O, 298K, λmax/nm (ε/M−1cm−1)]: 193 (−21), 223 (0.2),230 (−0.4), 264 (4.0) (−1).
[LnL](NO3)3•nH2O complexes of the Type II
Method A (Ln =Lu). (P)-[LuLRRRRRR](NO3)3•7H2O
The solution of 138.9 mg (0.213 mmol) of LRRRRRR in 5 ml of methanol was combined with 0.2 mmol (83 mg) of Lu(NO3)3•3H2O in 5 ml of methanol and the mixture was refluxed for 2 hrs. The solution was cooled down, 30 ml of acetonitrile was added in portions, the volume was reduced on a rotary evaporator until a precipitate appeared, and the mixture was left to stand in the freezer overnight. The obtained product was filtered, washed with cold acetonitrile and dried under vacuum. Yield 127.8 mg (57%). ESI-MS: m/z: 275.5 [LuL]3+, 444.2 {[LuL](NO3)}+, 950.5 {[LuL](NO3)}2+. 1H NMR (500 MHz, D2O, 298K): δ 0.78, 0.85, 1.02, 1.12, 1.19, 1.38, 1.54, 1.58, 1.67, 1.67, 1.67, 1.81, 2.14, 2.21, 2.26, 2.26, 3.09, 3.62, 3.71, 4.00, 4.16, 4.30, 4.60, 4.64, 7.48, 7.50, 7.60, 7.99, 8.04. 13C NMR (500 MHz, D2O, 298K): δ 26.62, 26.92, 27.24, 33.07, 33.31, 33.73, 50.98, 53.88, 54.49, 62.09, 65.46, 67.57, 125.23, 126.03, 127.39, 144.48, 144.64, 159.43, 160.43, 163.16. Anal. Calc. (found) for LuC39H69N12O15: C, 41.99 (41.79); H, 6.20 (6.20); N, 15.19 (14.99). CD [H2O, 298K, λmax/nm (ε/M−1cm−1)]: 191 (51), 203 (16), 227 (−6.7), 271 (16).
Method B (Ln = Er, Lu)
0.1 mmol of an appropriate [LnL](NO3)3•CHCl3•nH2O complex was dissolved in a mixture of 10 ml of acetonitrile and 4 ml of water. The solution was refluxed (120 hrs for Er(III) complex and 2 hrs for Lu complex), evaporated to dryness and redissolved in a mixture of 2 ml of methanol and 8 ml of acetonitrile. The solution was concentrated on rotary evaporator to ca. 5 ml, until precipitate appeared and was left overnight in the freezer. The obtained precipitate was filtered, washed with small amounts of cold acetonitrile and dried under vacuum.
(P)-[ErLRRRRRR](NO3)3•7H2O
Yield 43.1 mg (38.1%). ESI-MS: m/z: 273.2 [ErL]3+, 440.8 {[ErL](NO3)}+, 943.8 {[ErL](NO3)}2+. 1H NMR (500 MHz, D2O, 298K): δ −67.05, −18.89, −16.10, −16.10, −14.37, −12.12,−10.98, −8.75, −2 to 4.3 seven overlapped broad signals, 6.32, 6.87, 7.75, 9.94, 9.97, 10.20, 15.82, 23.36, 38.87, 72.43, 88.72, 157.10. Anal. Calc. (found) for ErC39H71N12O16: C, 41.41 (41.31); H, 6.33 (6.12); N, 14.86 (14.76). CD [H2O, 298K, λmax/nm (ε/M−1cm−1)]: 190 (49), 203 (18), 227 (−6.1), 272 (18).
(P)-[LuLRRRRRR](NO3)3•4.5H2O
Yield 67.3 mg (61.5%). Anal. Calc. (found) for LuC39H66N12O13.5: C, 42.82 (42.87); H, 6.08 (5.73); N, 15.36 (15.19).
The (M)-[YbLRRRRRR](NO3)3•CHCl3•H2O, (M)-[YbLRRRRRR]2[Yb(NO3)5](NO3)4•4H2O, (P)-[YbLRRRRRR](NO3)3•6H2O complexes have been obtained as described previously2.
Supplementary Material
Description of X-ray crystal structures, 1H NMR signal assignment, luminescence sensitization determination, kinetic analysis of P/M helicity inversion and H/D exchange processes. Figures S1–S34 (ESI MS, 2D NMR, 1H NMR, CPL and CD spectra, views of molecular structures). Tables S1–S3 (crystal data and structure refinement details, selected bond lenhts, equilibrium distributions of the (M)- and (P)-diastereomers) as well as X-ray crystallographic information in CIF format. This material is available free of charge via the Internet at http://pubs.acs.org.
Acknowledgement
This work was supported by MNiSW grant 1 T09A 143 30. G.M. thanks the National Institutes of Health Minority Biomedical Research Support (2 S06 GM008192-24A1) and Research Corporation Cottrell Science Award (CC6624) for their financial support. We thank Prof. T. Lis for help with the determination of the X-ray crystal structures.
Contributor Information
Gilles Muller, Email: gilles.muller@sjsu.edu.
Jerzy Lisowski, Email: jurekl@wchuwr.chem.uni.wroc.pl.
References
- 1.For selected examples of helical “figure eight” macrocycles see: Shimizu S, Cho W-S, Sessler JL, Shinokubo H, Osuka A. Chem. Eur. J. 2008;14:2668–2678. doi: 10.1002/chem.200701909. Karle IL, Venkateshwarlu P, Nagaraj R, Sarma AVS, Vijay D, Sastry NG, Ranganathan S. Chem. Eur. J. 2007;13:4253–4263. doi: 10.1002/chem.200601393. Katayev EA, Pantos GD, Reshetova MD, Khrustalev VN, Lynch VM, Ustynuk YA, Sessler JL. Angew. Chem. Int. Ed. 2005;44:7386–7390. doi: 10.1002/anie.200502393. Werner A, Michels M, Zander L, Lex J, Vogel E. Angew. Chem. Int. Ed. 1999;38:3650–3653. doi: 10.1002/(sici)1521-3773(19991216)38:24<3650::aid-anie3650>3.0.co;2-f. Sessler JL, Weghorn SJ, Lynch V, Johnson M-R. Angew. Chem. Int. Ed. 1994;33:1509–1512.
- 2.Gregoliński J, Lisowski J. Angew. Chem. Int. Ed. 2006;45:6122–6126. doi: 10.1002/anie.200602464. [DOI] [PubMed] [Google Scholar]
- 3.(a) Gregoliński J, Ślepokura K, Lisowski J. Inorg. Chem. 2007;46:7923–7934. doi: 10.1021/ic700831z. [DOI] [PubMed] [Google Scholar]; (b) Radecka-Paryzek W, Patroniak V, Lisowski J. Coord. Chem. Rev. 2005;249:2156–2175. [Google Scholar]; (c) Lisowski J, Ripoli S, Di Bari L. Inorg. Chem. 2004;43:1388–1394. doi: 10.1021/ic0353918. [DOI] [PubMed] [Google Scholar]; (d) Lisowski J, Starynowicz P. Inorg. Chem. Comm. 2003;6:593–597. [Google Scholar]; (e) Lisowski J, Mazurek J. Polyhedron. 2002;21:811–816. [Google Scholar]; (f) Bligh SWA, Choi N, Evagorou EG, McPartlin M, White KN. J. Chem. Soc. Dalton Trans. 2001:3169–3172. [Google Scholar]; (g) Lisowski J, Starynowicz P. Polyhedron. 1999;18:443–450. [Google Scholar]; (h) Lisowski J, Starynowicz P. Polyhedron. 2000;19:465–469. [Google Scholar]; (i) Bligh SWA, Choi N, Evagorou EG, Li W-S, McPartlin M. Chem. Commun. 1994:2399–2400. [Google Scholar]
- 4.For selected examples of helical macrocyclic complexes, see: Hutin M, Schalley CA, Bernardinelli G, Nitschke JR. Chem. Eur. J. 2006;12:4069–4076. doi: 10.1002/chem.200501591. Houjou H, Iwasaki A, Ogihara T, Kanesato M, Akabori S, Hiratani K. New J. Chem. 2003;27:886–889. Meskers SCJ, Dekkers HPJM, Rapanne G, Sauvage J-P. Chem. Eur. J. 2000;6:2129–2134. doi: 10.1002/1521-3765(20000616)6:12<2129::aid-chem2129>3.0.co;2-p. Comba P, Fath A, Hambley TW, Kühner A, Richens DT, Vielfort A. Inorg. Chem. 1998;37:4389–4401. doi: 10.1021/ic980216q. Fenton DE, Matthews RW, McPartlin M, Murphy BP, Scowen IJ, Tasker PA. J. Chem. Soc., Chem. Commun. 1994:1391–1392. Matthews RW, McPartlin M, Scowen IJ. Chem. Commun. 1996:309–310.
- 5.Paluch M, Lisowski J, Lis T. Dalton Trans. 2006:381. doi: 10.1039/b502863a. [DOI] [PubMed] [Google Scholar]
- 6.For selected recent examples of helical metallamacrocyclic complexes, see: Li G, Yu W, Cui Y. J. Am. Chem. Soc. 2008;130:4582–4583. doi: 10.1021/ja078317n. Li G, Yu W, Ni J, Liu T, Liu Y, Sheng E, Cui Y. Angew. Chem. Int. Ed. 2008;47:1245–1249. doi: 10.1002/anie.200704347. Fukuda M, Sekiya R, Kuroda R. Angew. Chem. Int. Ed. 2008;47:706–710. doi: 10.1002/anie.200703162. Heo J, Jeon Y-M, Mirkin CA. J. Am. Chem. Soc. 2007;129:7712–7713. doi: 10.1021/ja0716812. Funeriu DP, Rissanen K, Lehn J-M. Proc. Natl. Acad. Sci. USA. 2001;98:10546–10551. doi: 10.1073/pnas.191362998.
- 7.(a) Knof U, von Zelewsky A. Angew. Chem. Int. Ed. 1999;38:302–322. doi: 10.1002/(SICI)1521-3773(19990201)38:3<302::AID-ANIE302>3.0.CO;2-G. [DOI] [PubMed] [Google Scholar]; (b) Mateos-Timoneda MA, Crego-Calama M, Reinhoudt DN. Chem. Soc. Rev. 2004;33:363–372. doi: 10.1039/b305550g. [DOI] [PubMed] [Google Scholar]; (c) Cornelissen JJLM, Rowan AE, Nolte RJM, Sommerdiijk NAJM. Chem. Rev. 2001;101:4039–4070. doi: 10.1021/cr990126i. [DOI] [PubMed] [Google Scholar]
- 8.For selected examples see: Xu J, Raymond KN. Angew. Chem. Int. Ed. 2006;45:6480–6485. doi: 10.1002/anie.200602060. Yeh RM, Raymond KN. Inorg. Chem. 2006;45:1130–1139. doi: 10.1021/ic0515711. Zeckert K, Hamacek J, Senegas J-M, Dalla-Favera N, Floquet S, Bernardinelli G, Piguet C. Angew. Chem. Int. Ed. 2005;44:7954–7958. doi: 10.1002/anie.200503040. Baylies CJ, Riis-Johannessen T, Harding LP, Jeffery JC, Moon R, Rice CR, Whitehead M. Angew. Chem. Int. Ed. 2005;44:6909–6912. doi: 10.1002/anie.200502571. Bassett AP, Magennis SW, Glover PB, Lewis DJ, Spencer N, Parsons S, Williams RM, De Cola L, Pikramenou Z. J. Am. Chem. Soc. 2004;126:9413–9424. doi: 10.1021/ja048022z. Cantuel M, Bernardinelli G, Muller G, Riehl JP, Piguet C. Inorg. Chem. 2004;43:1840–1849. doi: 10.1021/ic035292u. Bowyer PK, Cook VC, Gharib-Naseri N, Gugger PA, Rae AD, Swiegers GF, Willis AC, Zank J, Wild SB. Proc. Natl. Acad. Sci. USA. 2002;99:4877–4882. doi: 10.1073/pnas.072640699. Hasenknopf B, Lehn J-M, Boumediene N, Leize E, Van Dorsselaer A. Angew. Chem. Int. Ed. 1998;37:3265–3268. doi: 10.1002/(SICI)1521-3773(19981217)37:23<3265::AID-ANIE3265>3.0.CO;2-B. Albrecht M. Chem. Rev. 2001;101:3457–3497. doi: 10.1021/cr0103672. Piguet C, Bernardinelli G, Hopfgartner G. Chem. Rev. 1997;97:2005–2062. doi: 10.1021/cr960053s. Woods CR, Benaglia M, Siegel JS, Cozzi F. Angew. Chem. Int. Ed. 1996;35:1830–1833.
- 9.(a) Parker D. Chem. Soc. Rev. 2004;33:156–165. doi: 10.1039/b311001j. [DOI] [PubMed] [Google Scholar]; (b) Di Bari L, Pescitelli G, Sherry AD, Woods M. Inorg. Chem. 2005;44:8391–8398. doi: 10.1021/ic0511118. [DOI] [PMC free article] [PubMed] [Google Scholar]; (c) Woods M, Kovacs Z, Zhang S, Sherry AD. Angew. Chem. Int. Ed. 2003;42:5889–5892. doi: 10.1002/anie.200352234. [DOI] [PubMed] [Google Scholar]; (d) Dickins RS, Howard JAK, Lehmann CW, Moloney J, Parker D, Peacock RD. Angew. Chem. Int. Ed. 1997;36:521–523. [Google Scholar]; (e) Dickins RS, Aime S, Batsanov AS, Beeby A, Botta M, Bruce JI, Howard JAK, Love CS, Parker D, Peacock RD, Puschmann H. J. Am. Chem. Soc. 2002;124:12697–12705. doi: 10.1021/ja020836x. [DOI] [PubMed] [Google Scholar]
- 10.For examples of diastereoselective formation of lanthanide helical complexes see: Petoud S, Muller G, Moore EG, Xu J, Sokolnicki J, Riehl JP, Le UN, Cohen SM, Raymond KN. J. Am. Chem. Soc. 2007;129:77–83. doi: 10.1021/ja064902x. Leonard JP, Jensen P, McCabe T, O’Brien JE, Peacock RD, Kruger PE, Gunnlaugsson T. J. Am. Chem. Soc. 2007;129:10986–10987. doi: 10.1021/ja073049e. Lama M, Mamula O, Kottas GS, Rizzo F, De Cola L, Nakamura A, Kuroda R, Stoeckli-Evans H. Chem. Eur. J. 2007;13:7358–7373. doi: 10.1002/chem.200700324. Albrecht M, Schimid S, Dehn S, Wickleder C, Zhang S, Basset AP, Pikramenou Z, Fröhlich R. New J. Chem. 2007;31:1755–1762. Jeong KS, Kim YS, Kim YJ, Lee E, Yoon JH, Park WH, Park YW, Jeon S-J, Kim ZH, Kim J, Jeong N. Angew. Chem. Int. Ed. 2006;45:8134–8138. doi: 10.1002/anie.200603622. Mamula O, Lama M, Telfer SG, Nakamura A, Kuroda R, Stoeckli-Evans H, Scopelitti R. Angew. Chem. Int. Ed. 2005;44:2527–2531. doi: 10.1002/anie.200500094.
- 11.For controlled helicity inversion in inorganic systems see: Miyake H, Hikita M, Itazaki M, Nakazawa H, Sugimoto H, Tsukube H. Chem. Eur. J. 2008;14:5393–5396. doi: 10.1002/chem.200800625. Miyake H, Kamon H, Miyahara I, Sugimoto H, Tsukube H. J. Am. Chem. Soc. 2008;130:792–793. doi: 10.1021/ja0768385. Miyake H, Sugimoto H, Tamiaki H, Tsukube H. Chem. Commun. 2005:4291–4293. doi: 10.1039/b506130j. Miyake H, Yoshida K, Sugimoto H, Tsukube H. J. Am. Chem. Soc. 2004;126:6524–6525. doi: 10.1021/ja049130o. Hutin M, Nitschke J. Chem. Commun. 2006:1724–1726. doi: 10.1039/b601012a. Zahn S, Canary JW. Science. 2000;288:1404–1407. doi: 10.1126/science.288.5470.1404. Zahn S, Das D, Canary JW. Inorg. Chem. 2006;45:6056–6063. doi: 10.1021/ic060660q. Biscarini P, Kuroda R. Inorg. Chim. Acta. 1988;154:209–214.
- 12.For examples of controlled helicity inversion in organic polymeric systems see: Okoshi K, Sakurai S-i, Ohsawa S, Kumaki J, Yashima E. Angew. Chem. Int. Ed. 2006;45:8173–8176. doi: 10.1002/anie.200603663. Sakurai S-i, Okoshi K, Kumaki J, Yashima E. J. Am. Chem. Soc. 2006;128:5650–5651. doi: 10.1021/ja061238b. Maeda K, Mochizuki H, Watanabe M, Yashima E. J. Am. Chem. Soc. 2006;128:7639–7650. doi: 10.1021/ja060858+. Tang H-Z, Novak BM, He J, Polavarapu PL. Angew. Chem. Int. Ed. 2005;44:7298–7301. doi: 10.1002/anie.200501977. Tang H-Z, Boyle PD, Novak BM. J. Am. Chem. Soc. 2005;127:2136–2142. doi: 10.1021/ja0453533. Tang K, Green MM, Cheon KS, Selinger JV, Garetz BA. J. Am. Chem. Soc. 2003;125:7313–7323. doi: 10.1021/ja030065c.
- 13.(a) Meudtner RM, Hecht S. Angew. Chem. Int. Ed. 2008;47:4926–4930. doi: 10.1002/anie.200800796. [DOI] [PubMed] [Google Scholar]; (b) Hembury GA, Borovkov VV, Inoue Y. Chem. Rev. 2008;108:1–73. doi: 10.1021/cr050005k. [DOI] [PubMed] [Google Scholar]; (c) Hofacker AL, Parquette JR. Angew. Chem. Int. Ed. 2005;44:1053–1057. doi: 10.1002/anie.200460943. [DOI] [PubMed] [Google Scholar]; (d) Borovkov VV, Hembury GA, Inoue Y. Angew. Chem. Int. Ed. 2003;42:5310–5314. doi: 10.1002/anie.200352493. [DOI] [PubMed] [Google Scholar]
- 14.For examples of controlled helicity inversion in supramolecular polymeric aggregates see: Johnson RS, Yamazaki T, Kovalenko A, Fenniri H. J. Am. Chem. Soc. 2007;129:5735–5743. doi: 10.1021/ja0706192. Ajayaghosh A, Varghese R, George SJ, Vijayakumar C. Angew. Chem. Int. Ed. 2006;45:1141–1144. doi: 10.1002/anie.200503142. Lohr A, Lysetska M, Würthner F. Angew. Chem. Int. Ed. 2005;44:5071–5074. doi: 10.1002/anie.200500640.
- 15.(a) Pijper D, Jongejan MGM, Meetsma A, Feringa BL. J. Am. Chem. Soc. 2008;130:4541–4552. doi: 10.1021/ja711283c. [DOI] [PubMed] [Google Scholar]; (b) Vicario J, Katsonis N, Serrano Ramon B, Bastiaansen CWM, Broer DJ, Feringa BL. Nature. 2006;440 doi: 10.1038/440163a. [DOI] [PubMed] [Google Scholar]; (c) ter Viel MKJ, Van Delden RA, Meetsma A, Feringa BL. J. Am. Chem. Soc. 2003;125:15076–15086. doi: 10.1021/ja036782o. [DOI] [PubMed] [Google Scholar]
- 16.Belmont P, Constant J-F, Demeunynck M. Chem. Soc. Rev. 2001;30:70–81. [Google Scholar]
- 17.(a) Gonzalez-Alvarez A, Alfonso I, Lopez-Oritz F, Aguirre A, Garcia-Granda S, Gotor V. Eur. J. Org. Chem. 2004:1117–1127. [Google Scholar]; (b) Kuhnert N, Rossignolo GM, Lopez-Periago A. Org. Biomol. Chem. 2003;1:1157–1170. doi: 10.1039/b212102f. [DOI] [PubMed] [Google Scholar]
- 18.As a consequence of the Cahn-Ingold-Prelog sequence rules, the R configuration at coordinated nitrogen atom corresponds to the S configuration of the respective form of the free macrocycle L.
- 19.Tancrez N, Feuvrie C, Ledoux I, Zyss J, Toupet L, Le Bozec H, Maury O. J. Am. Chem. Soc. 2005;127:13474–13475. doi: 10.1021/ja054065j. [DOI] [PubMed] [Google Scholar]
- 20.Lisowski J, Sessler JL, Lynch V, Mody TD. J. Am. Chem. Soc. 1995;117:2273–2285. [Google Scholar]
- 21.(a) Du W, Xia Z, Dewilde S, Moens L, La Mar GN. Eur. J. Biochem. 2003;270:2707–2720. doi: 10.1046/j.1432-1033.2003.03638.x. [DOI] [PubMed] [Google Scholar]; (b) Lecomte JTJ, La Mar GN.J. Am. Chem. Soc 19871097219–7220.; [Google Scholar]; (c) Thanabal V, de Ropp JS, La Mar GN. J. Am. Chem. Soc. 1988;110:3027–3035. [Google Scholar]
- 22.Medforth CJ, Shiau F-Y, La Mar GN, Smith KM. J. Chem. Soc., Chem. Commun. 1991:590–592. [Google Scholar]
- 23.Marzilli LG, Polson SM, Hansen L, Moore SJ, Marzilli PA. Inorg. Chem. 1997;36:3854–3860. [Google Scholar]
- 24.Steemers FJ, Verboom W, Reinhoudt DN, van der Tol EB, Verhoeven JW. J. Am. Chem. Soc. 1995;117:9488–9414. [Google Scholar]
- 25.Beeby A, Clarkson IM, Dickins RS, Faulkner S, Parker D, Royle L, de Sousa AS, Williams JAG, Woods M. J. Chem. Soc., Perkin Trans. 1999;2:493–504. [Google Scholar]
- 26.Supkowski RM, Horrocks WDeW. Inorg. Chim. Acta. 2002;340:44–48. [Google Scholar]
- 27.Wang Z, Choppin GR, Di Bernardo P, Zanonato P-L, Portanova R, Tolazzi M. J. Chem. Soc. Dalton Trans. 1993:2791–2796. [Google Scholar]
- 28.(a) Riehl JP, Muller G. In: Handbook on the Physics and Chemistry of Rare Earths. Gschneidner KA, Bunzli J-CG, Pecharsky VK, editors. Vol. 34. Amsterdam: North-Holland Publishing; 2005. [Google Scholar]; (b) Do K, Muller FC, Muller G. J. Phys. Chem. A. 2008;112:6789–6793. doi: 10.1021/jp804463e. [DOI] [PMC free article] [PubMed] [Google Scholar]; (c) Lunkley JL, Shirotani D, Yamanari K, Kaizaki S, Muller G. J. Am. Chem. Soc. 2008;130:13814–13815. doi: 10.1021/ja805681w. [DOI] [PMC free article] [PubMed] [Google Scholar]
- 29.For selected recent examples of Ln(III)-based CPL studies, see: Seitz M, Moore EG, Ingram AJ, Muller G, Raymond KN. J. Am. Chem. Soc. 2007;129:15468–15470. doi: 10.1021/ja076005e. Bonsall SD, Houcheime M, Straus DA, Muller G. Chem. Commun. 2007:3676–3678. doi: 10.1039/b704346e. Leonard JP, Jensen P, McCabe T, O’Brien JE, Peacock RD, Kruger PE, Gunnlaugsson T. J. Am. Chem. Soc. 2007;129:10986–10987. doi: 10.1021/ja073049e. Pedziwiatr M, Kosareff NM, Muller G, Koposov AY, Nemykin VN, Riehl JP, Legendziewicz J. J. Alloys Compnds. 2008;451:251–253. doi: 10.1016/j.jallcom.2007.04.224. Montgomery CP, New EJ, Parker D, Peacock RD. Chem. Commun. 2008:4261–4263. doi: 10.1039/b810978h.
- 30.Meech SR, Phillips DC. J. Photochem. 1983;23:193–217. [Google Scholar]
- 31.Chauvin A-S, Gumy F, Imbert D, Bünzli J-CG. Spectroscopy Lett. 2004;37:517–532. [Google Scholar]
- 32.ver. 1.171 Oxford Diffraction Poland. 1995–2003. KM4CCD software: CRYSALIS CCD and CRYSALIS RED. [Google Scholar]
- 33.Sheldrick GM. Program for the Solution of Crystal Structures. Göttingen (Germany): University of Göttingen; 1997. SHELXS-97. [Google Scholar]
- 34.Sheldrick GM. Program for the Refinement of Crystal Structures. Göttingen (Germany): University of Göttingen; 1997. SHELXL-97. [Google Scholar]
- 35.Sheldrick GM. Version 6.10. Madison, WI, USA: Bruker AXS; 2000. SHELXTL. [Google Scholar]
- 36.Ver. 1.4.1, Program for Crystal Structure Visualization and Exploration. CCDC Cambridge University; MERCURY. [Google Scholar]
- 37.Brandenburg K. DIAMOND Crystal Imact GbR. Germany: Bonn; 2006. [Google Scholar]
Associated Data
This section collects any data citations, data availability statements, or supplementary materials included in this article.
Supplementary Materials
Description of X-ray crystal structures, 1H NMR signal assignment, luminescence sensitization determination, kinetic analysis of P/M helicity inversion and H/D exchange processes. Figures S1–S34 (ESI MS, 2D NMR, 1H NMR, CPL and CD spectra, views of molecular structures). Tables S1–S3 (crystal data and structure refinement details, selected bond lenhts, equilibrium distributions of the (M)- and (P)-diastereomers) as well as X-ray crystallographic information in CIF format. This material is available free of charge via the Internet at http://pubs.acs.org.


