

Abstract
The hypothalamus coordinates autonomic responses in part through arginine vasopressin (AVP) released in medial nucleus tractus solitarius (NTS). However, the mechanisms and sites of AVP action within NTS pathways are uncertain. In brainstem slices, we activated solitary tract (ST) primary afferents to release glutamate and tested whether AVP modulated synaptic transmission to second-order neurons. NTS neurons were classified as second order by ST synaptic characteristics or the presence of anterograde tracers from peripheral baroreceptor afferents. Stimulus recruitment curves indicated ST-EPSCs on individual neurons were evoked by stimulation of single ST axons. Variance–mean (V–M) analysis of ST-EPSCs in individual neurons revealed uniformly high release probability (p ∼ 0.9) from an average of 19 release sites (N) and a quantal size (q) of 34.0 ± 4.7 pA. In 26 of 49 neurons, AVP inhibited afferent synaptic transmission. In most neurons, AVP reduced ST-EPSC amplitudes (n = 20) by decreasing p to 0.65, whereas q, N, and conduction times were unaffected. The V1a antagonist SR49059 alone decreased ST-EPSC V and increased M, suggesting tonic AVP actions, and blocked exogenous AVP action (n = 4). In other neurons with identical ST release properties, AVP induced synaptic failures and increased conduction time without altering the V–M relationship of successful ST-EPSCs (n = 6). Interestingly, frequency-depressed ST-EPSCs were not affected by AVP. AVP failed to alter holding or voltage-dependent potassium currents. Thus, AVP regulates NTS neurons by two distinct novel and state-dependent mechanisms: one, an analog, graded presynaptic inhibition of terminal glutamate release and the other, a binary, extraterminal block of conducted excitation.
Keywords: capsaicin, potassium channels, synaptic plasticity, brainstem, nucleus tractus solitary (solitarius), release probability, sensory neurons, synaptic transmission, glutamate, voltage clamp, AVP, paraventricular hypothalamus
Introduction
Neuropeptides including arginine vasopressin (AVP) are released in many CNS areas by hypothalamic projections and are crucial modulators of autonomic function during stress (Herman et al., 2003). Stressors activate neurons within hypothalamus including the paraventricular hypothalamic nucleus, the projections of which then release AVP within specific regions of the brainstem, which include the nucleus of the solitary tract (NTS) (Sofroniew and Schrell, 1981; Sawchenko and Swanson, 1982; White et al., 1984; Landgraf et al., 1990; Charmandari et al., 2005). NTS is the first stage of processing for cranial primary afferent from the viscera that control critical homeostatic reflexes (Andresen and Kunze, 1994; Saper, 2002). For example, baroreceptor visceral afferents enter the CNS via the solitary tract (ST) and release glutamate to activate autonomic reflex pathways that control cardiac output, heart rate, and vascular tone. Within the NTS, neurally released AVP orchestrates cardiorespiratory adjustments during stress (Michelini and Bonagamba, 1988; Dufloth et al., 1997; Michelini and Morris, 1999), which ensure a matching of cardiac function with behavioral and physical challenges (Matsuguchi et al., 1982; Pittman and Franklin, 1985; Landgraf et al., 1990). In the parabrachial nucleus, AVP inhibits evoked glutamatergic synaptic currents (Chen and Pittman, 1999), and in spinal cord, AVP modulates important postsynaptic ion channels such as voltage-dependent potassium currents (IKAs) (Kolaj and Renaud, 1998a,b). In contrast, the mechanisms of AVP action within NTS are poorly understood, although AVP receptors have been associated with central terminals of visceral afferents (Phillips et al., 1990; Gao et al., 1992).
We hypothesized that AVP could modify afferent synaptic transmission at either presynaptic or postsynaptic targets. To test this hypothesis, we identified second-order NTS neurons in horizontal brainstem slices by the characteristics of EPSCs evoked by ST stimulation or by the presence of fluorescently labeled baroreceptor terminals (Doyle and Andresen, 2001). Because our approach to ST activation in horizontal slices evokes unitary responses (Andresen and Yang, 1995), these ST-EPSCs represent single functional synaptic units (FSUs) in each neuron (i.e., one afferent axon and all its associated release sites on an individual neuron). Using variance–mean (V–M) analysis, we assessed the neurotransmitter release properties of individual FSUs by estimating the quantal size (q), number of functional release sites (N), release probability (p) (Clements and Silver, 2000; Silver, 2003; Foster and Regehr, 2004) and examined whether AVP altered these fundamental presynaptic characteristics. Using this approach, we identified two distinct modes by which AVP inhibits afferent transmission in separate groups of second-order NTS neurons: either an analog mode that reduced terminal p or a binary mode at extraterminal sites that blocked action potential invasion of the afferent release sites.
Materials and Methods
NTS slices and recordings
Hindbrains of male Sprague Dawley rats (150–350 g; Charles River, Boston, MA) were prepared as described previously (Doyle et al., 2004). All animal procedures were approved by the Institutional Animal Care and Use Committee in accordance with the United States Public Health Service Policy on Humane Care and Use of Laboratory Animals and the National Institutes of Health Guide for the Care and Use of Laboratory Animals. Brains were removed from deeply anesthetized (isoflurane) rats and placed in cold (0–2°C) artificial CSF (ACSF) composed of (in mm): 125 NaCl, 3 KCl, 1.2 KH2PO4, 1.2 MgSO4, 25 NaHCO3, 10 dextrose, 2 CaCl2, and bubbled with 95% O2/5% CO2, pH 7.4. Slices (250 μm) were microtome cut (VT-1000S; Leica, Nussloch, Germany) in a quasi-horizontal orientation using a sapphire knife (Delaware Diamond Knives, Wilmington, DE). Electrodes (1.8–3.5 MΩ) were filled with a solution composed of (in mm): 10 NaCl, 130 K gluconate, 11 EGTA, 1 CaCl2, 2 MgCl2, 10 HEPES, 1.0 Na2ATP, 0.1 NaGTP, pH 7.3, 295 mOsm. ACSF used for recording was identical to that used for brain slicing procedures in ACSF. In some experiments, ACSF Ca2+ was reduced and the decrement replaced by twice the amount of Mg2+ to minimize loss of charge shielding and avoid activation of presynaptic nonselective cation channels (Smith et al., 2004). Neurons medial to the ST and <250 μm from obex were identified using infrared differential interference contrast (DIC) optics (Axioskop FS2+; Zeiss, Oberkochen, Germany). Voltage-clamp recordings were made at 32–34°C with a Multiclamp 700B or Axoclamp 2A/B amplifier and pClamp 9 software (Molecular Devices, Union City, CA). No leak subtractions, liquid junction potentials, or series resistance compensations were performed. Input resistance was monitored throughout recordings. Experiments were discarded if series or input resistance was not stable.
Synaptic characterization
Synaptic currents were triggered with a concentric bipolar stimulating electrode placed on the ST 1–3 mm from recording electrode. Bursts of five stimuli at 50 Hz were generated at 3 s intervals (Master-8; A.M.P.I., Jerusalem, Israel). ST shock intensity was gradually increased until an EPSC was evoked. Stimulation intensity was set at two to five times threshold for subsequent testing. Only second-order NTS neurons were studied identified by low jitter (<200 μs) and minimal failures (Doyle and Andresen, 2001). Second-order neurons with baroreceptor afferents were anatomically identified via fluorescent dye (1,1′-dioctadecyl-3,3,3′,3′-tetramethylindo-carbocyanine perchlorate; Invitrogen, San Diego, CA) anterogradely transported from peripheral aortic depressor nerve (Doyle and Andresen, 2001; Doyle et al., 2004).
Drugs
AVP, [deamino-Pen1, O-Me-Tyr2, Arg8]-vasopressin (SR49059; V1a antagonist), 1,2,3,4-tetrahydro-6-nitro-2,3-dioxo-benzo quinoxaline-7-sulfonamide, and tetrodotoxin (TTX) were obtained from Sigma (St. Louis, MO). Capsaicin (CAP) was obtained from Tocris Cookson (Ballwin, MO).
Data collection and analysis
Monosynaptic ST-EPSCs.
The directness of the synaptic coupling of each neuron to the ST was determined by analyzing the variation in the onset latency of EPSC1. The latency jitter was calculated as the SD of >30 ST-evoked EPSC1s, and jitters >200 μs were considered to be polysynaptic, indirect pathways from ST to the recorded neuron. ST synaptic failures were noted when no ST-EPSC could be detected (excursion > noise level) within 1 ms of the characteristic latency of that neuron. This time window constraint minimized contamination by spontaneous EPSCs. Failures were measured in each neuron in each condition as a percentage of the total ST shocks delivered. Changes in ST-EPSC latency within neurons during treatments were assessed as an indication of changes in pathway conduction velocity.
Variance mean analysis of ST-EPSCs.
V–M analysis distinguishes between presynaptic and postsynaptic mechanisms of modulation (Clements, 2003). For each recording, the release probability, number of functional release sites, and quantal size were estimated by determining the dependence of EPSC variance on mean amplitude under conditions that alter release (Clements, 2003; Silver, 2003; Foster and Regehr, 2004). In its simplest form, the relationship between V and M can be described by the following equation: V = qM − M2/N. ST-EPSC amplitudes were measured as the peak current minus the mean baseline current immediately preceding each stimulus shock (averaged over 10 ms). V was calculated as the square of SD of 30–80 successive ST-EPSCs amplitudes in each condition. V values were not corrected for baseline variance because the SD of the noise accounted for <1% of ST-EPSC amplitude. For each neuron, we calculated M and V during each recording condition for each of ST-EPSC within 50 Hz trains of five shocks (identified as EPSC1, EPSC2, etc.). M and V changes during treatments were calculated from ST-EPSCs recorded within a 2–3 min period centered on peak responses. Although infrequent, failures were included for all V and M calculations unless noted.
We constructed V–M relationships for steady-state ST-EPSCs in 2, 0.5, and 0.25 mm extracellular Ca2+. V–M data from each of eight second-order NTS neurons were fit with a least squares method using the following equation: y = K1x + K2x2, where y is the variance in EPSC amplitude, x is the mean amplitude, and K1 and 1/K2 are q and −N, respectively. All relationships closely followed parabolic regression fits (Igor Pro 5; WaveMetrics, Lake Oswego, OR). Because such fits predicted a narrow range of release probabilities (0.89–0.96), we used p = 0.9 for V–M analyses across the remainder of studies of NTS neurons. In a subset of neurons with second-order ST-EPSC characteristics, mEPSCs were measured in 1 μm TTX and cumulative distributions of their amplitude and frequency compared using the Kolmogorov–Smirnov (K–S tests) nonparametric analysis between control and 3 μm AVP using Mini-Analysis 5.0 software (Synaptosoft, Decatur, GA).
For neurons treated with AVP, V–M relationships were constructed assuming p = 0.9 for EPSC1 in standard control conditions (2 mm Ca2+). Using the measured EPSC1 amplitude and variance, we estimated the maximal EPSC amplitude (EPSCmax), and this, together with the theoretical constraints of the minimal release characteristics (0 V at 0 M), allowed calculation of a full V–M relationship for each neuron. This parabolic fit predicts average q and N for each neuron. Aggregate data normalized V and M by dividing by EPSCmax within neurons under control conditions before generating aggregate mean values. Similar procedures were used for AVP antagonist studies.
Potassium currents.
Transient IKAs and sustained steady-state outward currents (IKVs) were evoked and measured as described previously (Bailey et al., 2002). IKA was calculated as the peak early transient current minus the IKV current. IKA and IKV currents were compared before and after AVP application.
Statistical testing.
Statistical comparisons were made using paired Student’s t test, repeated-measures (RM) ANOVA, one- or two-way ANOVA, Fisher’s PLSD post hoc analysis, and K–S test where appropriate (Statview 4.57; Abacus Concepts, Calabasas, CA). All summary data are presented as means ± SEM. p values <0.05 indicated significant differences.
Results
Unitary EPSCs from cranial visceral afferents
Stimulus shocks were delivered to the ST 1–3 mm from the recorded neuron (Fig. 1) and evoked ST-EPSCs with minimally variant latencies and amplitudes. ST shocks rarely (<0.1%) failed to evoke an EPSC in such neurons (Fig. 1C). Stimuli delivered as bursts of five shocks (50 Hz) each 3 s evoked a series of ST-EPSCs in which amplitudes were progressively depressed as the burst proceeded. This frequency-dependent depression (FDD) is a prominent characteristic of synaptic transmission found at all ST–NTS synapses (Doyle and Andresen, 2001). EPSC responses were quite consistent from burst to burst at this stimulation rate, and this allowed repeated sampling of ST-EPSCs over time (Scheuss et al., 2002). Axons from single cranial visceral afferents exit the ST as they approach cell bodies within NTS and then branch extensively to distribute terminals that are concentrated on the soma and proximal dendrites of single postsynaptic neurons (Anders et al., 1993). This afferent branching pattern means that, in horizontal slices, ST stimulation evokes a simple, all-or-none synaptic event and there is a binary relationship between ST shock intensity and the amplitude of the evoked EPSC (Fig. 1E). These relationships for each neuron had sharp intensity thresholds and threefold to fivefold increases in stimulus intensity did not further increase EPSC amplitude. The stimulus–recruitment relationships for each of the five EPSCs within the burst sequence (i.e., EPSC1, EPSC2, EPSC3, etc.) (Fig. 1E) had identical thresholds. Such relationships support the conclusion that ST shocks activated a single afferent axon and its associated release sites on individual NTS neurons (i.e., a single FSU). Here, we selected for further testing 57 neurons that displayed the minimal ST-EPSC latency jitter (<200 μs) and stimulus–recruitment profiles that are consistent with single afferent FSUs at individual second-order NTS neurons (Doyle and Andresen, 2001). This group (Table 1) included seven baroreceptive neurons (Fig. 1B) that were additionally identified by fluorescent, aortic nerve anterograde label of boutons on their soma (Doyle et al., 2004).
Figure 1.
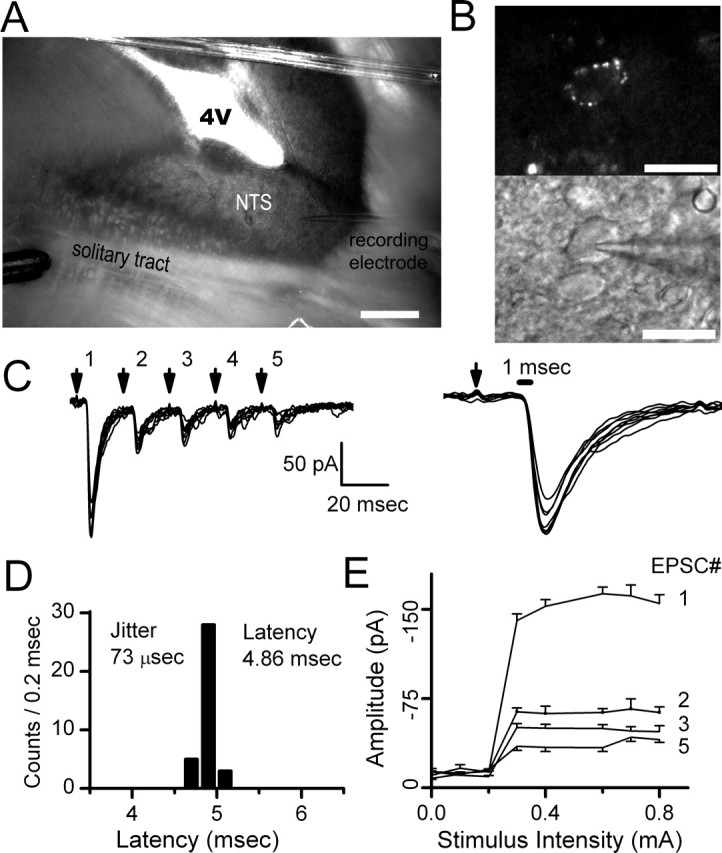
ST shocks activate EPSCs evoked in horizontal brainstem slices. A, Horizontal slices of the brainstem permit placement of the stimulating electrode (bottom left) on ST distant from the recorded NTS neuron (electrode on bottom right). B, Dye placed on the aortic depressor nerve identified fluorescent baroreceptor terminals on neuron soma (top) and guided recording pipette placement (bottom) under infrared DIC. C, Bursts of five shocks to ST (arrows), repeated every 3 s, evoked consistent trains of EPSCs. D, Closely spaced (20 ms) stimuli-depressed EPSCs substantially indicating frequency-dependent depression of ST-EPSC latency varied minimally and identified second-order neurons with jitter (SD of latency) of <200 μs. E, Increasing stimulus intensity activated all EPSCs within a train (EPSC1, EPSC2, etc.) at a single threshold intensity and further increases failed to alter EPSC amplitude (n = 20 trials; EPSC4 excluded for clarity). These timing and recruitment characteristics are consistent with activation of a single afferent axon. Scale bars: A, 400 μm; B, 40 μm.
Table 1.
Summary of solitary tract synaptic responses of NTS neurons
| Neuron type | Amplitude EPSC1 (pA) | Latency (ms) | Jitter (μs) | Percentage failures EPSC1 | N EPSC1 | q EPSC1 (pA) |
|---|---|---|---|---|---|---|
| Total second order (n = 57) | 345 ± 31 pA (64–880) | 5.5 ± 0.3 (2.3–11.9) | 104 ± 7 (34–177) | 0.2 ± 0.1 (0–3.0) | 18.6 ± 2.3 (1.4–54) | 34.0 ± 4.7 (7–140) |
| Ca2+ cells (n = 8)a | 313 ± 56 pA (95–569) | 5.1 ± 0.5 (2.9–7.4) | 102 ± 11 (57–135) | 0.2 ± 0.2 (0–1.7) | 18.4 ± 2.8 (4.4–32.5) | 24.0 ± 9.0 (7–81) |
| AVP sensitive (n = 26) | 381 ± 49 pA (82–880) | 5.7 ± 0.3 (2.6–11.9) | 101 ± 7 (34–177) | 0.1 ± 0.1 (0–1.0) | 18.0 ± 2.8 (2–54) | 38.0 ± 6.4 (10–140) |
| Nonfailure type (n = 20) | 429 ± 60 pA (82–880) | 5.5 ± 0.4 (2.6–11.9) | 105 ± 8 (50–177) | ±0.1 (0–1.0) | 19.9 ± 3.6 (2–54) | 38.0 ± 8.0 (10–89) |
| Failure type (n = 6) | 214 ± 56 pA (115–465) | 6.6 ± 0.3 (5.3–7.8) | 93 ± 16 (34–120) | 0% (0–0) | 10.7 ± 1.7 (3–14) | 39.8 ± 12.0 (12–94) |
| AVP resistant (n = 23) | 284 ± 44 pA (64–755) | 5.1 ± 0.4 (3.1–9.6) | 98 ± 8 (34–149) | 0.2 ± 0.2 (0–3.0) | 15.0 ± 3.5 (1.4–40.7) | 36.9 ± 9.8 (7–201) |
| Baroreceptive (n = 7) | 337 ± 56 pA (150–554) | 4.6 ± 0.7 (2.3–7.3) | 110 ± 9 (76–135) | 0.1 ± 0.1 (0–1.0) | 15.4 ± 4.1 (6.0–30.1) | 29.4 ± 9.5 (12–80) |
aTwo of these neurons received anatomically identified aortic baroreceptor terminals.
AVP inhibits synaptic transmission in the NTS
Application of AVP inhibited ST–NTS transmission in 26 of 49 neurons (Fig. 2). These AVP-sensitive neurons (n = 26) and AVP-resistant neurons (n = 23) had indistinguishable (p > 0.3) synaptic characteristics including amplitudes, latencies, and jitters (Table 1). However, AVP reversibly inhibited transmission in two distinct ways. Most commonly (n = 20), AVP reduced ST-EPSC amplitudes (Fig. 2A) by 30± 0.3%. In a smaller subset of other second-order NTS neurons (n = 6), AVP induced intermittent failures of EPSCs (Fig. 2B). In cases with EPSC failures, the subsequent successful EPSC showed no FDD (Fig. 2B, middle, red current traces). AVP effects reversed readily after wash in control solution (Fig. 2A,B). Despite these substantial actions on synaptic transmission, AVP did not alter the holding current, indicating that AVP did not affect the basal channel activity. The two patterns of synaptic response to AVP, one expressed as a graded reduction in EPSC amplitude and the other as an increased incidence of EPSC failures, are consistent with two distinct actions of AVP. We hypothesized that the graded inhibition resulted from a reduction in release from nerve terminals, whereas the induction of failures was caused by AVP acting at extraterminal, axonal sites (Fig. 2, diagrammatic insets).
Figure 2.

Two distinct modes of AVP action to inhibit ST transmission. AVP (3 μm) either depressed ST-EPSC amplitudes (A) or induced intermittent ST-EPSC failures (B, arrows). Synaptic transmission rarely failed in control conditions (far left panels, 2 different second-order NTS neurons A and B). The different responses appear mutually exclusive such that increases in ST-EPSC failures had no amplitude changes and vice versa. In failure-type responses, full amplitude EPSC2s were observed when EPSC1 failed during AVP, indicating no previous activation of release sites (B, red current traces). Return to control solution (Wash) reversed AVP actions. These two modes of AVP action are consistent with afferent inhibition either at a presynaptic intraterminal action [A, inset; AVP receptor as gray square directly on an ST terminal (triangle)] or at extraterminal AVP receptors distant from the terminal release site (B, inset). EPSC characteristics: A, 4.3 ms latency, 114 μs jitter; B, 7.8 ms latency, 51.5 μs jitter. Each trace in A and B displays eight consecutive sweeps overlaid in each condition. Calibration: 10 ms, 100 pA.
In graded responses to AVP, the inhibition of EPSC1 was clearly greater than for subsequent EPSCs. This is demonstrated by the records in Figure 3A, in which EPSC1 was inhibited by >80%, whereas, surprisingly, EPSC5 was unaltered (Fig. 3A). Furthermore, AVP markedly increased the amplitude variability for EPSC1 (Fig. 3A). Plots of EPSC1 versus EPSC2 showed that AVP disrupted the normally tight relationship between EPSC1 and EPSC2 (Fig. 3B) but readily reversed on washing. ST-EPSC latency, a measure of conduction time (Fig. 3C), was not altered by AVP in this or other AVP-sensitive neurons with graded responses (p > 0.33; n = 20). Together, these observations indicated that AVP actions depended on the release properties of the synapse. To examine this more directly, we initiated a series of studies using fluctuation analysis to characterize the neurotransmitter release properties of ST–NTS synapses.
Figure 3.
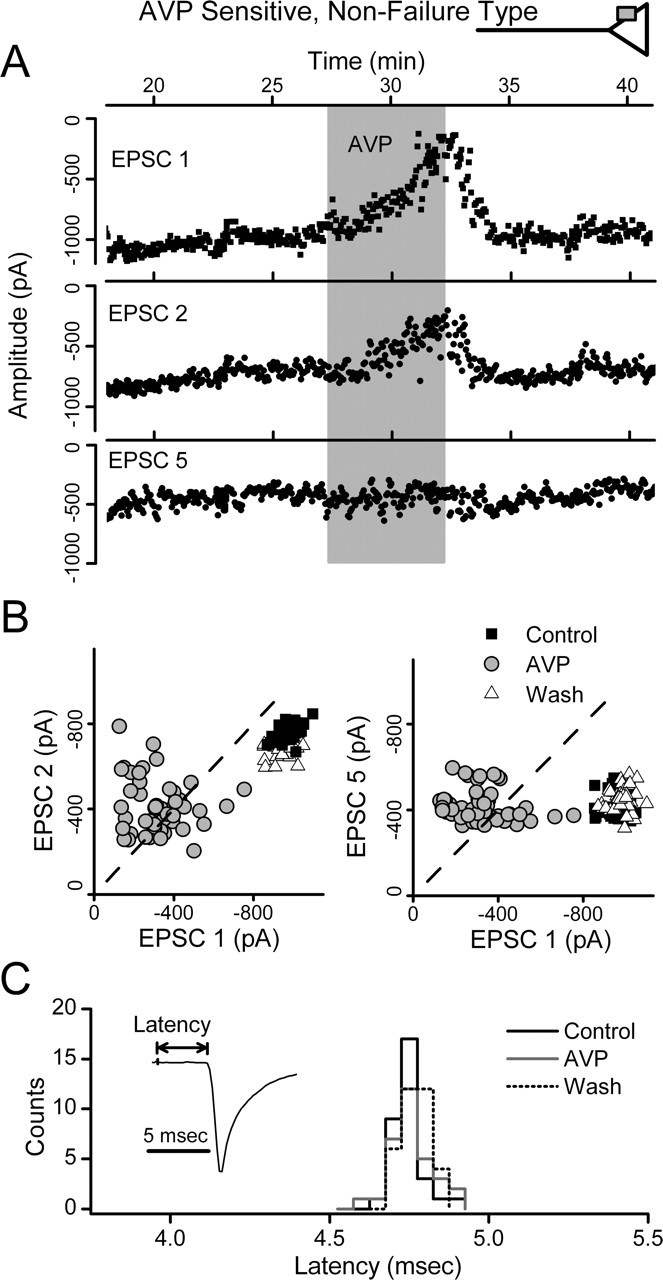
AVP depresses ST-EPSC amplitudes and increases amplitude variability. AVP depressed ST-EPSCs in a graded manner without changes in conduction time in nonfailure, AVP-sensitive NTS neurons. A, AVP (3 μm; shaded bar) reduced EPSC1 and EPSC2 amplitudes but did not alter EPSC5. AVP effects rapidly reversed in control solutions (Wash; results from neuron in Fig. 2A). B, Paired values of EPSC1–EPSC2 and EPSC1–EPSC5 varied minimally in control (gray triangles) and fell below the line of identity (dashed line), consistent with depression of EPSCs after EPSC1. AVP scattered EPSC1–EPSC2 values to generally smaller average amplitudes (open circles) but with much greater variability. EPSC1–EPSC5 values declined in the x dimension (EPSC1) only. Note that many paired points shifted to above the line of identity during AVP, reflecting reversal normal ordered pair relationship (i.e., EPSC2 or EPSC5 > EPSC1). Wash (black squares) restored values to overlap controls. C, Histogram distribution of individual ST-EPSC response latencies in control, AVP, and wash for the neuron in A and B. The response latencies in each condition were similar with overlapped distributions. These AVP responses are consistent with presynaptic actions to decrease terminal glutamate release (top inset). The lack of effect of AVP on depressed ST-EPSCs indicates a preferential action of AVP at an ST–NTS synapse primed for high release.
V–M analysis indicates high release probability
To identify the site of inhibition by AVP, we first characterized the transmitter release properties for the ST–NTS synapse. At a given synapse, p, N, and q can be estimated by determining the dependence of EPSC variance on mean amplitude under conditions that alter release (Clements, 2003; Silver, 2003; Foster and Regehr, 2004). In its simplest form, the relationship between V and M can be described by the following equation: V = qM − M2/N. In these experiments, we altered release by changing extracellular concentration of Ca2+.
Lowering the extracellular Ca2+ from 2 to 0.5 mm decreased the mean amplitude of EPSC1 while increasing V (Fig. 4A, insets). Reducing Ca2+ to 0.25 mm further decreased amplitude but decreased V (Fig. 4A). Reducing the amount of glutamate released had no effect on the relative shapes of the rising or falling phases of EPSC1 (Fig. 4B), results consistent with minimal glutamate spillover (DiGregorio et al., 2002) or receptor saturation at 2 mm Ca2+ (Wadiche and Jahr, 2001). All V–M relationships for individual neurons (each point representing ≥60 EPSC measurements at each Ca2+ level) were well fit by the parabolic function (r2 = 0.99± 0.01; n = 8) (Fig. 4D,E). The estimates of q based on the initial slope averaged 24.0± 9.0 pA, whereas N was estimated as 18.4± 2.8 sites (Table 1). The normalized summary V–M plot for eight neurons was similarly well represented by a simple parabolic relationship (Fig. 4E). The point of intersection of the parabolic curve and the x-axis was used to calculate the EPSCmax for individual neurons. Release probability at a given Ca2+ concentration was calculated as EPSC1 divided by EPSCmax. The release probability at 2 mm Ca2+ was high and remarkably consistent across different neurons (range, 0.89–0.96), and two of these neurons were identified as baroreceptive through anterograde dye labeling. Using a conservative estimate of release probability of 0.9, we investigated the actions of AVP on ST terminal release properties using V–M analysis.
Figure 4.

Variance–mean analysis of ST–NTS synapses: high release. V–M analysis of ST-evoked EPSCs used a range of external Ca2+ concentrations to alter release probability. A, Exposure to 2, 0.5, and 0.25 mm Ca2+ altered M and V in a characteristic manner with V maximal at intermediate M (8 consecutive traces of ST-EPSC bursts, EPSC1–5) from a representative neuron. The thick black line is average current. The expanded current trace (bottom insets) highlights peaks of EPSC1 in each Ca2+. B, Lowering Ca2+ from 2 to 0.5 mm did not alter the shape of the average normalized EPSC1 traces. Trace normalization divided by peak of EPSC1 (bottom). The lack of EPSC kinetic changes indicates minimal glutamate spillover or receptor saturation. C, Steady-state EPSC1 amplitudes in each tested Ca2+ concentration. D, V–M relationship for EPSC1 values in representative neuron (A–C). Parabolic model fit was excellent for this neuron (r2 = 1.0). Fits were constrained to pass through (0, 0) and had uniformly high r2 values. E, V–M relationship for group mean values (n = 8) included two neurons with baroreceptor afferent contacts and had an r2 = 0.996. V and M values from each neuron were normalized by dividing each value by the maximum EPSC1 amplitude (at p = 1) predicted from individual parabolic fits.
AVP reduces ST-EPSC release probability
AVP reduced the amplitudes of EPSC1 and EPSC2 in each burst but had no effect on the rate of synaptic failures (Figs. 5A1, 2B). In the pooled data from 20 such AVP-sensitive, non-failure-type neurons, the 30% AVP-mediated reduction in EPSC1 amplitude M was coupled with a substantial increase in the scatter of EPSC1 amplitudes (Fig. 2A, 3), quantified as a 130% increase in amplitude variance (Fig. 5A1–A3). Because V–M analysis revealed that EPSC1 closely conformed to the parabolic model, we examined the action of AVP using the same approach. V–M analysis predicts that at a high release probability synapse, reductions in event amplitudes arising from a reduction of p are associated with an increase in V, whereas reductions of N or q would be associated with a reduced V (Clements and Silver, 2000; Foster and Regehr, 2004). AVP shifted the EPSC1 V–M points to the left and upward in all individual experiments, and normalized data during AVP closely followed the predicted mean parabolic relationship (Fig. 5A3). Because a postsynaptic inhibition or a decrease in the number of release sites, N, would have shifted the AVP points below the V–M curve, the results are consistent with a selective presynaptic action of AVP to reduce p. In added support of a presynaptic action, AVP decreased mEPSC frequency in second-order NTS neurons (Fig. 5B) (n=4; 1 μm TTX and 2 mm Ca2=), whereas amplitudes were unaffected (i.e., decreased p without change in q). Furthermore, the mean amplitude of mEPSCs provides a second estimate of q in these neurons (36.7± 4.5 pA) that was nearly identical to estimated mean of q predicted by V–M analysis across neurons (Table 1). This independent measure supports the accuracy and appropriate application of V–M analysis at ST–NTS synapses and suggests that voltage-activated Na= channels are not an essential part of the AVP inhibitory mechanism at glutamate terminals.
Figure 5.
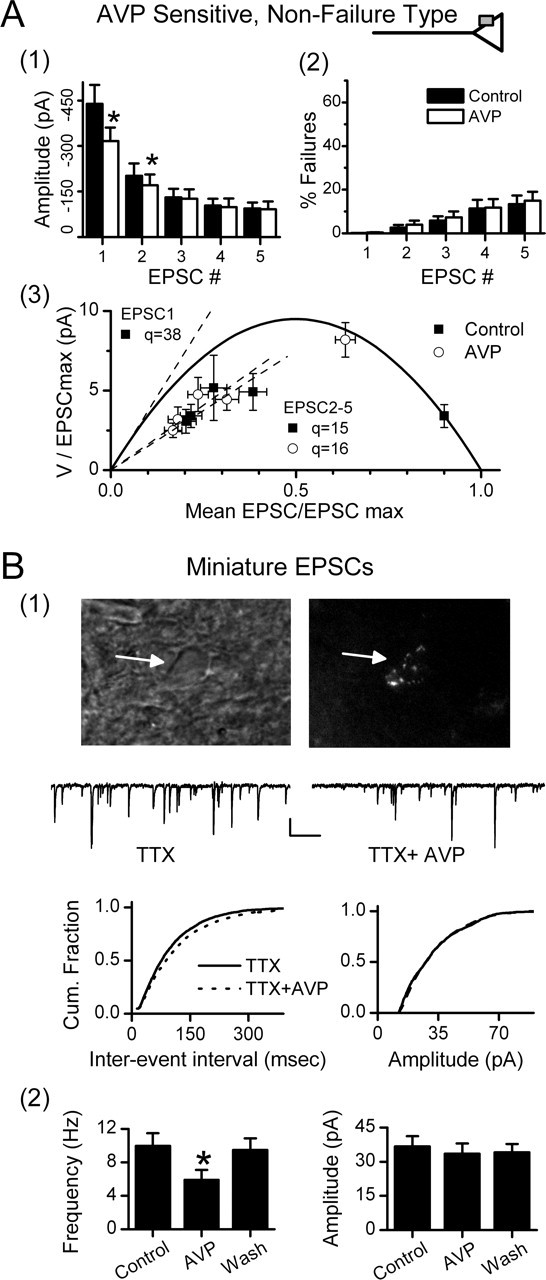
AVP reduces release probability at ST–NTS synapses: intraterminal mode. ST-EPSC characteristics for AVP-sensitive, non-failure-type (A) and AVP-sensitive miniature EPSCs on second-order neurons (B). In control histograms (A1, filled bars), frequency-dependent depression decreased amplitude >50% (5 ST shocks at 20 ms intervals). AVP (open bars) significantly reduced (*p < 0.05) amplitudes of both EPSC1 and EPSC2, whereas EPSC3–5 values were unchanged. Synaptic failure rates (A2) were low but increased as the ST burst progressed to an EPSC5 failure rate of <20%. AVP did not alter failure rate. The group V–M relationship for AVP-sensitive neurons (A3; n=20) used a p value of 90% for EPSC1 in 2 mm Ca2= as assessed in separate studies (Fig. 3). V–M values for EPSC1 in AVP closely followed the parabolic model with decreased M and increased V. EPSC2–5 did not lie on the V–M parabola and AVP did not alter their linear V–M fits (dashed lines). The apparently decreased quantal size likely results from frequency-dependent depletion. In control conditions, q of EPSC1 is predicted by the V–M parabola, initial slope as 38 pA. AVP did not change q for EPSC2–5 (p > 0.05). B, To better discriminate potential presynaptic from potential postsynaptic AVP actions, miniature EPSCs (mEPSCs) were recorded in TTX (2 μm) in identified second-order NTS neurons. B1, A representative second-order medial NTS neuron was identified by its latency (6.1 ms) and jitter (86 μs) and by the presence of parasomatic, fluorescent baroreceptor terminals. The top left micrograph is an infrared DIC image of the neuron (arrow), and the top right is the same field of view under fluorescence showing parasomatic dye-positive puncta from ADN afferent contacts. Representative current traces in TTX from this same neuron (middle traces) show that AVP (3 μm) rapidly and reversibly reduced mEPSC frequency. AVP significantly shifted cumulative (Cum.) mEPSC frequencies to longer interevent intervals (bottom left), but the amplitude distribution (bottom right) was unchanged (Kolmogorov–Smirnov test; control, 327 events; AVP, 216 events). B2, Group averages for similarly tested second-order NTS neurons (n=4). AVP decreased mean frequency (left), but mEPSC amplitudes were unchanged (right). Wash reversed these changes. Three additional second-order NTS neurons were tested and found to be AVP insensitive (data not shown). Results are consistent with AVP selectively acting at a presynaptic target to reduce glutamate release onto the AVP-sensitive second-order NTS neurons.
Within synaptic responses to bursts of ST stimuli, the V–M values for EPSC2–5 did not fall on the EPSC1 V–M parabola (Figs. 4, 5A). The V–M relationship for EPSC2–5 was better described by a line with a lower slope indicating reduced q. The decreased amplitudes of EPSC2–5 reflect FDD and may represent a depleted release state of the synapse or other use-dependent presynaptic mechanism (Scheuss et al., 2002). AVP had no effect on the V–M relationship for EPSC2–5, and this finding suggests that AVP inhibition of ST transmission was effective only under high release conditions (e.g., q=38 pA vs q=15–16 pA) (Fig. 5A3). The absence of AVP-mediated inhibition during FDD implies that both these forms of inhibition may impact common release pathways.
AVP-resistant NTS neurons
A substantial number of second-order NTS neurons were AVP resistant. Interestingly, the ST-EPSC synaptic properties were quantitatively indistinguishable in latency, jitter, failure rates, and FDD between AVP-sensitive and AVP-resistant neurons (Fig. 6, Table 1). The V–M analysis of AVP-resistant NTS neurons yielded values for N and q that had similar ranges and means for EPSC1 as AVP-sensitive neurons (Fig. 6, Table 1). AVP did not change the ST-EPSC latency or jitter (p > 0.35; n = 23) in these resistant neurons. Because AVP-resistant and -sensitive neurons had otherwise identical ST neurotransmitter release characteristics, AVP sensitivity differences appear to reflect lack of expression of AVP receptor on ST terminals at AVP-resistant neurons.
Figure 6.

Neurons with AVP-resistant ST-EPSCs have similar release characteristics to AVP-sensitive neurons. Second-order NTS neurons were identified by their latency and jitter characteristics. A, AVP-resistant neurons (n=23) (Table 1) were indistinguishable from sensitive neurons in their frequency-dependent depression (left) or failure rates (right). B, The AVP-resistant group V–M relationship predicts a similar quantal size for EPSC1, and q decreased for EPSC2–5 in a similar manner to sensitive neurons (Fig. 5). Together with the results from AVP-sensitive neurons, these results demonstrate the selective expression of AVP receptors on limited presynaptic ST terminals in NTS.
AVP failure-type neurons
In contrast to graded synaptic depression, AVP promoted synaptic failures in some NTS neurons (n=6; failure type) (Figs. 2B, 7, 8). In all respects, EPSC1 transmission under control conditions in AVP failure-type neurons closely resembled that of all other second-order NTS neurons (Table 1). In other words, N, q, and p in failure-type neurons were indistinguishable from other NTS second-order neurons. Note that under control conditions, ST-EPSC transmission failed <0.1% across all second-order neurons including those that responded to AVP with increased failures. In failure-type NTS neurons, however, the addition of AVP was followed by an abrupt onset of synaptic failures (Fig. 7A), the frequency of which increased until reaching an average failure rate of nearly 50% (Fig. 8B). Interestingly, during AVP-induced failures, the latency of successful ST-EPSC1 reversibly and clearly increased (Fig. 7C) in all six recordings. The mean latency for each recording increased with AVP from 6.83± 0.24 to 7.30± 0.27 ms (p = 0.015; n = 6) and jitter increased from 108± 17 to 262± 51 μs (p = 0.011). Such latency increases are consistent with a slowing of conduction velocity within the activated ST axon.
Figure 7.

AVP induces synaptic failures at some ST–NTS synapses: extraterminal mode. In a subset of AVP-sensitive NTS neurons, AVP increased ST synaptic failures without altering terminal release properties. A, Points register values of each EPSC1 and EPSC2 (filled circles) plotted over time from ST burst activation. AVP (shaded bar; 3 μm) gradually increased EPSC failures (0 amplitude events) until after 5 min exposure when nearly all EPSC1s failed. Note that when EPSC1 failed, EPSC2 closely resembled a control EPSC1 in all respects. Four original traces from different times within the protocol (arrows) are plotted within ovals. Calibration: 10 ms, 100 pA. B, A pair plot of EPSC1 to EPSC2. In control, EPSC1, and EPSC2, values (filled squares) varied over a narrow range, but EPSC1 was always greater than EPSC2 (broken line of identity). In AVP (open circles), many values overlapped the control cluster (filled squares), but a new cluster of high amplitude EPSC2 values appeared with near-zero EPSC1s. A new cluster also appeared at the origin (double null amplitudes). In AVP, the new cluster of large EPSC2 values had a range and variability similar to control EPSC1 values. Wash (gray triangles) restored this relationship to overlap controls. C, Histograms of the frequency distribution of latencies for individual successful ST-EPSCs. Control and wash latency distributions are overlapped. During AVP and failures, the latencies of successful ST-EPSCs increased and spanned a much broader range. These results are consistent with AVP block of afferent axon conduction (top inset)
Figure 8.

AVP does not alter release in failure-type, AVP-sensitive NTS neurons. Failures induced by AVP were always followed by full-amplitude events regardless of relative position with the burst of stimuli (EPSC1, EPSC2, etc.). Analysis was conducted on the neuron from Figure 5. A, Original current traces from control (topmost trace) and five traces in which AVP induced failures in positions 1–5 (vertical dashed lines). EPSCs after one or multiple failed EPSCs were themselves similar to control EPSC1. Note prominent FDD in control. Note that many small events are spontaneous and not synched to ST activation. B, AVP did not alter mean EPSC1–5 burst amplitudes or FDD in failure-type NTS neurons. However, AVP dramatically increased average failure rates only for EPSC1 and 2 (*p < 0.05) in these same neurons (n = 6). C, In AVP, plots of the mean amplitudes of successful EPSCs (±SD) after synaptic failures (open circles) show that EPSC amplitudes varied similarly (p > 0.05, RM ANOVA) in all positions within the ST stimulus burst (EPSC1–5). Surprisingly, during AVP induced failures, the amplitudes of EPSCs after a failure for positions EPSC2–5 within the burst sequence were significantly greater than those during control (*p < 0.05). Thus, during AVP in failure neurons, FDD was absent after failures. D, The group V–M relationship characterizing ST-EPSCs in AVP-sensitive failure-type neurons was quite similar to the one in non-failure-type neurons (compare with Fig. 5). V–M fits used the same parabolic model with p = 0.9 assumed for EPSC1 at 2 mm Ca2+ (see Fig. 3). Excluding ST-EPSC failures, the AVP and control V–M values for EPSC1 overlapped and were not different (p > 0.05). Linear fits to EPSC2–5 V–M values predict reduced q compared with initial slope of the V–M parabola of 39 pA, and this is unchanged by AVP. This failure-type pattern of response is consistent with AVP actions to block conduction remote from afferent terminal with no evidence for intraterminal modulation of release (top inset).
In ordered-pair plots (Fig. 7B), successful EPSC2s after EPSC1 failures during AVP were similar in amplitude to the control EPSC1. The absence of depression of EPSC2 in such cases indicates that release of transmitter did not occur earlier in the train and is inconsistent with a postsynaptic mechanism of inhibition. Recovery was likewise punctuated by a sudden restoration of EPSC1 transmission (Fig. 7A). Interestingly, as the incidence of failures increased during AVP, the remaining, successful ST-EPSCs had amplitudes similar to controls (Fig. 8A,B). V–M analysis of failure-type neurons indicates up to 14 functional release sites per neuron. Because these release sites are driven by a single common afferent axon, it is unlikely that synaptic failures represent simultaneous and complete AVP inhibition at all individual release sites. We considered whether subtle changes in afferent activation properties could underlie this effect, but this seems highly unlikely because ST shock intensities were many times above threshold levels (Fig. 1) and the effects were always time locked to solution changes and reversible. The increase in ST-EPSC latency during AVP is consistent with a reversible impediment within the conduction pathway. Furthermore, AVP responses in failure-type neurons most often consisted of mixtures of failures and successful, full amplitude ST-EPSCs separated by as little as 20 ms. This switching in the failure pattern for AVP is not consistent with a graded reduction in terminal release probability. AVP appears to first slow and then block conduction in these neurons at a site common to all release sites (Fig. 7A, inset). Conduction block within the ST axon antecedent and common to the entire FSU would produce abrupt, simultaneous failure to release transmitter at all terminals and appears to be responsible for AVP-induced transmission failures at individual failure-type neurons.
In neurons with AVP-induced failures, successful ST-EPSCs occurred in any position within the burst sequence to five ST shocks (Fig. 8A). Successful EPSCs immediately after one or more failures had amplitudes that were indistinguishable from control EPSC1 (Fig. 8A,C). This is illustrated clearly by the comparison of the mean and SD of the first nonfailure event during AVP with control EPSC1 but is in sharp contrast with the control EPSCs later in the burst (Fig. 8C). As a group (Fig. 8B), AVP increased the failure rate of EPSC1 by an average of nearly 50%, despite no change in the amplitude characteristics of successful ST-EPSCs. We postulated that AVP would reduce p in these neurons as it did in the nonfailure neurons (Fig. 5A). However, AVP had no effect on successful ST-EPSC amplitudes or their V–M relationship in failure-type neurons (Fig. 8D). Curiously, the failure rates of EPSC3–5 were not changed significantly by AVP (n = 6; p > 0.05) (Fig. 8B). The absence of AVP-induced reductions in afferent terminal glutamate release in failure-type neurons suggests that AVP operates in two distinct modes to inhibit ST synaptic transmission but that these mechanisms exist in afferent pathways to two separate groups of AVP-sensitive neurons.
V1a receptors tonically depress release probability
V1a receptors in the CNS signal AVP actions (Raggenbass, 2001). AVP, however, also has significant actions at central oxytocin receptors as well (Hirasawa et al., 2003). The V1a antagonist SR49059 possesses little activity at central oxytocin receptors (Manning et al., 1993). Interestingly, application of SR49059 alone consistently facilitated EPSC1 transmission over control conditions (Fig. 9) and decreased V. SR49059 also blocked the actions of applied AVP (Fig. 9A,B) (n = 4). Reversal of the order of AVP and SR49059 application yielded similar results within AVP-sensitive cells. The respective V–M values of EPSC1 during either AVP or SR49059 closely followed the overall V–M relationship (Fig. 9C). Five AVP-resistant neurons showed no response to SR49059, indicating that AVP-resistant cells are not simply neurons with AVP receptors fully activated by endogenous AVP. Thus, SR49059-induced ST-EPSC facilitation occurred only in AVP-sensitive neurons and supports V1a receptors as the site of action for both AVP and SR49059. Holding current in these neurons (n = 4; p > 0.05) was not altered by AVP or SR49059 (−10 ± 5, −12 ± 5, −14 ± 5, −15 ± 5 pA; control, SR49059, SR49059 plus AVP, AVP, respectively). Together, these results suggest that V1a receptors tonically depress ST transmission to these neurons and mediate actions of AVP at the ST–NTS synapse.
Figure 9.

V1a receptors inhibit ST transmission at second-order NTS neurons. A, During control conditions in this representative neuron (7 ms latency, 132 μs jitter), EPSC1 varied over a narrow range of amplitudes. The V1a-selective antagonist SR49059 (gray bar; 10 μm) increased EPSC1 amplitude and decreased variance. In the continuing presence of SR49059, added AVP (diagonally striped bar; 3 μm) was without effect. Subsequent AVP alone decreased EPSC amplitude and markedly increased EPSC1 variance. B, Summary means for nonfailure, AVP-sensitive neurons tested (n = 4) show that SR49059 (SR) increased the average ST-EPSC amplitude (relative to control) with or without coapplication of AVP compared with control (*p < 0.05 or **p < 0.01, RM ANOVA and paired t test). AVP alone markedly decreased amplitude compared with all conditions. C, In the mean V–M relationship for these neurons (n = 4), SR49059 increased EPSC1 M while decreasing V in good agreement with the parabolic V–M model and thus indicates increased release probability when V1a receptors are blocked. AVP alone had the opposite actions and reduced M with increased V as predicted by the parabolic model. These findings indicate a tonic activation of V1a receptors by endogenous AVP. V–M values for EPSC2–5 were linearly related, and the decreased slope of the linear fit indicated decreased quantal size (EPSC3–5 omitted for clarity). In five AVP-resistant second-order NTS neurons tested using identical protocols, EPSC characteristics were unresponsive to AVP or SR49059. None of these treatments altered holding currents (p > 0.5).
Baroreceptive NTS neurons are variably AVP sensitive
Aortic baroreceptor afferents densely terminate in dorsal medial NTS to initiate reflex control of arterial blood pressure (Mendelowitz et al., 1992). Such afferent endings may be targeted by descending hypothalamic fibers containing AVP and modulate cardiovascular autonomic control (Michelini and Morris, 1999). In a subset of experiments, we identified NTS neurons as baroreceptor-innervated by the presence of fluorescent puncta outlining the surface of cell bodies (Figs. 1, 5B) (Doyle et al., 2004). Baroreceptor-labeled neurons (Table 1) had ST synaptic characteristics that were similar to nonlabeled NTS second-order neurons (p > 0.05). Three of four dye-positive, baroreceptive neurons were AVP sensitive (two nonfailure type and one failure type), and one neuron was AVP resistant. Thus, neurons receiving baroreceptor synaptic inputs exhibited AVP responses similar to unlabeled neurons. These findings identify the baroreceptive function of a portion of the AVP-sensitive NTS neurons and thus the mechanisms by which AVP modulates central pathways for cardiovascular regulation.
AVP-sensitive ST afferents include both A and C fibers
ST afferents can be divided into C-fibers and A-fibers by their sensitivity or resistance to CAP, respectively (Doyle et al., 2002; Jin et al., 2004). In five of nine AVP-sensitive, non-failure-type NTS neurons, CAP (200 nm) blocked ST-EPSCs and the remainder were CAP resistant. In AVP-sensitive failure-type NTS neurons (n = 2), CAP blocked ST-EPSCs in one neuron. We conclude that the AVP failure and nonfailure modes are not limited to one ST afferent subtype (A- or C-fiber).
Postsynaptic membrane properties of second-order NTS neurons are AVP resistant
Both AVP-mediated modes of inhibition imply presynaptic sites of action. In other CNS regions, AVP targets postsynaptic voltage-gated ion channels including K+ channels (Kolaj and Renaud, 1998a,b). In contrast, AVP did not change holding current in second-order NTS neurons, and thus postsynaptic modulation of ion channels active at VH was unlikely. We also specifically tested whether AVP altered voltage-dependent K+ channels in neurons with AVP-sensitive ST transmission. Voltage conditioning at hyperpolarized potentials (−90 mV) revealed a transient outward current with the voltage-dependent activation and inactivation properties of IKA previously described in these neurons (Bailey et al., 2002). In no case (n = 14; p > 0.05) did AVP (3 μm) alter the transient outward K+ current or the steady-state voltage-dependent K+ current (Fig. 10). AVP also failed to change IKA or IKV in neurons with AVP-resistant ST-EPSCs (p > 0.05; n = 6). Thus, AVP appears to act exclusively through presynaptic mechanisms at second-order NTS neurons.
Figure 10.

Modulation of potassium currents in AVP-sensitive second-order NTS neurons (n = 8). After ST synaptic characterization, second-order NTS neurons were subjected to two-step voltage-clamp protocols to study potassium currents. A, After conditioning steps to −90 mV (bottom), a series of 1 s depolarizing steps activated whole-cell outward potassium currents (top). In many neurons such as this second-order NTS neuron, an early, transient potassium current decayed to a smaller sustained outward current (top). B, On average, AVP failed to change the current–voltage relationship for IKA measured as the peak current minus steady-state current (top; n = 8; p > 0.05) or steady-state currents (bottom; n = 8; p > 0.05). AVP did not change potassium currents whether the tested second-order neurons had ST-evoked EPSCs that were AVP sensitive (n = 8) or AVP insensitive (n = 6; data not shown). Holding currents were not affected in any group of second-order neurons (p > 0.1; nonfailure, n = 20, −41± 6 vs −42± 6 pA; failure, n = 6, −39± 4 vs −41± 4 pA; AVP insensitive, n = 23, −36± 8 vs −37± 9 pA, control vs AVP, respectively).
Discussion
AVP released within the brainstem from hypothalamic projections critically modulates cardiovascular autonomic regulation (Raggenbass, 2001). The caudal NTS is a target for AVP release, but the mechanisms and sites of action of AVP have remained uncertain. Here, V–M analysis of the ST–NTS synapse reveals a remarkably high glutamate release probability (p ∼ 0.9) and a uniform pattern of release that is driven by single afferent axons. Using this fluctuation analysis approach, we have identified two distinct modes of action by which AVP inhibits transmission between ST afferents and NTS neurons. In most neurons, AVP inhibited ST transmission by selectively reducing p. In the remainder of AVP-sensitive neurons, AVP inhibited ST transmission by slowing and then blocking axonal conduction without changing p. Finally, the effectiveness of AVP depended on the release state of the synapse so that AVP had no effect on ST-EPSCs depressed by high frequencies of activation.
Quantal analysis of the ST-NTS synapse
As the first contacts in the CNS of cranial visceral afferents, ST–NTS synapses initiate baroreflex and other critical homeostatic pathways (Andresen and Kunze, 1994; Andresen et al., 2001). In close agreement with anatomical descriptions (Anders et al., 1993), the stimulus recruitment of ST-EPSCs indicates that an FSU is comprised of a single afferent axon connecting to the postsynaptic neuron through a number of synaptic terminals. V–M analysis of EPSC1 in a range of external [Ca2+] indicated that individual ST–NTS FSUs engage with as many as 33 functional release sites. The minimal variations in p and high regression coefficients for parabolic fits to V–M distributions are consistent with uniform characteristics across the individual release sites within each FSU and across NTS second-order neurons (Clements and Silver, 2000). Similar estimates for N were calculated by fitting the EPSC1 data using a p assumed to be 0.9. Our estimates of N are generally consistent with fluorescent carbocyanine staining of afferent baroreceptor terminals (Mendelowitz et al., 1992) (Figs. 1, 5) and with neuroanatomical studies, which estimated that afferent pulmonary fibers form ∼40 synaptic terminals on a single NTS neuron (Anders et al., 1993). Furthermore, V–M analysis estimated a q that was identical to the mEPSC mean amplitude in such neurons highlighting the consistency of the two approaches (Meyer et al., 2001). Thus, the ST–NTS synapse has a homogeneously high p that is similar to some central synapses (Silver et al., 1998; Murphy et al., 2004) but much greater than most (von Kitzing et al., 1994; Meyer et al., 2001; Lawrence et al., 2004).
The parabolic V–M relationship for ST-EPSCs (r2 = 0.99) strongly supports the validity and resolution of this approach at ST–NTS synapses. However, at many central synapses, voltage control (Silver et al., 1998), postsynaptic desensitization (Scheuss et al., 2002), multivesicular release (Wadiche and Jahr, 2001), and glutamate spillover (DiGregorio et al., 2002) are potentially important factors complicating V–M analysis and interpretation. These complications appear to be minimal at ST–NTS synapses with their somatic localization (Mendelowitz et al., 1992), moderate-sized amplitudes (EPSC1 averaged 345 pA) (Table 1), and good voltage control (Rs voltage errors of ∼3.5 mV). Desensitization at the ST–NTS synapse is also modest (∼10%) as assessed using cyclothiazide (Doyle et al., 1997). Questions of receptor saturation and multivesicular release are especially important when interpreting the mechanisms of depression (Harrison and Jahr, 2003; Foster and Regehr, 2004). The 3 s duty cycle for our V–M analysis of EPSC1 makes these responses unlikely to be impacted by vesicle depletion because responses were quite stable over time (Andresen and Yang, 1995). Furthermore, saturation and spillover at the glutamate receptor (Wadiche and Jahr, 2001) seem unlikely because the EPSC waveforms scaled comparably across Ca2+ conditions. In addition, enhanced EPSC amplitudes by V1a antagonist were consistent with a further increment in glutamate release and thus minimal postsynaptic receptor saturation. Accordingly, the ST–NTS synapse in our horizontal slice preparation offers a unique opportunity for quantitative synaptic release studies, uncomplicated or limited by synaptic characteristics common in other central synapses.
Intraterminal AVP inhibition of ST afferents
In the majority of AVP-sensitive NTS neurons (the nonfailure group), AVP reduced M and increased V of EPSC1. This inhibition was well described by the V–M parabola, indicating that a reduction in release probability occurred relatively uniformly across all connecting synapses. Because the V1a antagonist facilitated glutamate release in all AVP-sensitive neurons tested, the presynaptic V1a receptors appear to be tonically restraining glutamate release at these sensitive terminals. Furthermore, because AVP did not alter postsynaptic currents (Fig. 10), reduce mEPSC size (Fig. 5B), or alter ST-EPSC conduction time (Fig. 3C) in these nonfailure, AVP-sensitive neurons, we conclude that AVP acts entirely at sites within the presynaptic ST terminal.
Extraterminal AVP inhibition of ST afferents
Although AVP acting at the nerve terminal accounts for ST inhibition in nonfailure neurons, AVP reduced ST transmission by 50% in another group of neurons (failure-type) without altering glutamate release properties. In these neurons, AVP increased the EPSC latency and promoted synaptic failures (<1% control up to 91% in AVP). Our quantitative V–M studies indicate that FSUs at individual neurons contain as many as 54 release sites. Simultaneous and complete failure of glutamate release from all sites is improbable but is consistent with a slowing or complete block of action potential propagation along the common afferent axon proximal to all functional release sites. A detailed mechanism for AVP induced failures is unknown. However, the results are consistent with a variable, AVP-evoked local hyperpolarization of the axon at a site or sites antecedent to all terminal branches. Axonal hyperpolarization at modest levels can slow conduction but if sufficiently great can block conduction and therefore invasion of the distal terminals (Baccus, 1998). The lack of latency actions of AVP in both nonfailure and AVP-resistant neurons supports a specific extraterminal site of action restricted to this failure-type subset of AVP-sensitive neurons.
AVP actions in failure-type neurons appear to be limited to this extraterminal site in failure-type neurons because AVP did not alter the V–M relationships of remaining successful ST-EPSCs. Indeed, AVP-induced synaptic failures occurred at any of the EPSCs in the train of five shocks, and, after failures, the next EPSC was restored to full amplitude (i.e., similar to control EPSC1). Therefore, AVP-mediated failure prevents transmitter release and cannot represent an extreme reduction in p or q. The successful EPSCs were similar to control amplitude and thus the mechanism of inhibition in failure-type neurons does not coexist with intraterminal mechanisms reducing p in nonfailure neurons. Interestingly, EM studies identified AVP-positive contacts within NTS lacking postsynaptic specializations (Voorn and Buijs, 1983), and such contacts are structurally consistent with AVP acting at points remote from terminals.
State dependence of AVP inhibition of ST synaptic transmission
Depression of high release, excitatory synapses is a common form of short-term plasticity that shapes sensory afferent signal processing (Trussell, 1999; Zucker and Regehr, 2002). High release probabilities may quickly deplete vesicles even at activation rates within the physiological range. Thus, in such pathways, the balance between high release probability and rapid neurotransmitter depletion determines the dynamic capacity of transmission (Von Gersdorff and Borst, 2002). Some high bandwidth central synapses maintain throughput using very large pools of readily releasable vesicles and rapid reloading (Saviane and Silver, 2006), but depression prevails at high frequencies at the ST–NTS synapse.
In NTS, physiological activation of myelinated afferents, such as arterial baroreceptors, initiates ST action potentials that arrive in intermittent bursts of 50–200 Hz. In contrast, activation of unmyelinated afferents elicits only a single action potential each second (Kunze and Andresen, 1991). These natural frequency differences indicate that the high p should result in substantially greater FDD at myelinated than at unmyelinated ST terminals (Kunze and Andresen, 1991; Schild et al., 1994). In addition, the failure of AVP to alter release from frequency-depressed ST terminals suggests that AVP will impact unmyelinated ST inputs more than myelinated inputs during natural activation patterns. Overall, this frequency and/or state dependence of AVP actions provides a mechanism with dynamic sensitivity to afferent inputs. This frequency aspect of AVP modulation may become particularly important during circumstances characterized by large changes in afferent pathway activation such as hypertension or shock.
Neuropeptides: discrete integrative control
The novel presynaptic inhibitory mechanisms detailed in the present studies identify how AVP modulates reflex autonomic performance at their first central synapse (Pittman and Franklin, 1985; Hegarty and Felder, 1997; Duan et al., 1999). AVP is one of a number of neuromodulators that brake the release of glutamate from ST terminals with intrinsically high p (Glaum and Miller, 1993; Sekizawa et al., 2003; Appleyard et al., 2005). AVP may fine tune afferent transmission under systemic circumstances that greatly alter afferent inputs to the CNS. The altered baroreflex state during dynamic exercise is mediated by AVP acting within NTS (Michelini, 1994). The presynaptic, ST afferent locus for AVP may be a primary site of action for stress modulation of autonomic reflexes. Because hypothalamic neurons are the sole source of neuronal AVP to NTS, the ST presynaptic mechanisms likely represent a focal point for hypothalamic–medullary integration in central autonomic pathways.
Footnotes
M. W. Doyle’s present address: Department of Biology, George Fox University, Newberg, OR 97132-2697.
This work was supported by National Institutes of Health Grants HL-41119 and HL-56460 (M.C.A.), NS-43444 (S.M.S.), and HL-70433 (T.W.B.). We thank Dr. Craig Jahr for comments on this work.
References
- Anders K, Ohndorf W, Dermietzel R, Richter DW (1993). Synapses between slowly adapting lung stretch receptor afferents and inspiratory beta-neurons in the nucleus of the solitary tract of cats: a light and electron microscopic analysis. J Comp Neurol 335:163–172. [DOI] [PubMed] [Google Scholar]
- Andresen MC, Kunze DL (1994). Nucleus tractus solitarius: gateway to neural circulatory control. Annu Rev Physiol 56:93–116. [DOI] [PubMed] [Google Scholar]
- Andresen MC, Yang M (1995). Dynamics of sensory afferent synaptic transmission in aortic baroreceptor regions of nucleus tractus solitarius. J Neurophysiol 74:1518–1528. [DOI] [PubMed] [Google Scholar]
- Andresen MC, Doyle MW, Jin Y-H, Bailey TW (2001). Cellular mechanisms of baroreceptor integration at the nucleus tractus solitarius. Ann NY Acad Sci 940:132–141. [DOI] [PubMed] [Google Scholar]
- Appleyard SM, Bailey TW, Doyle MW, Jin Y-H, Smart JL, Low MJ, Andresen MC (2005). Proopiomelanocortin neurons in nucleus tractus solitarius are activated by visceral afferents: regulation by cholecystokinin and opioids. J Neurosci 25:3578–3585. [DOI] [PMC free article] [PubMed] [Google Scholar]
- Bailey TW, Jin Y-H, Doyle MW, Andresen MC (2002). Vanilloid sensitive afferents activate neurons with prominent A-type potassium currents in nucleus tractus solitarius. J Neurosci 22:8230–8237. [DOI] [PMC free article] [PubMed] [Google Scholar]
- Charmandari E, Tsigos C, Chrousos G (2005). Endocrinology of the stress response. Annu Rev Physiol 67:259–284. [DOI] [PubMed] [Google Scholar]
- Chen X, Pittman QJ (1999). Vasopressin and amastatin induce V(1)-receptor-mediated suppression of excitatory transmission in the rat parabrachial nucleus. J Neurophysiol 82:1689–1696. [DOI] [PubMed] [Google Scholar]
- Clements JD (2003). Variance-mean analysis: a simple and reliable approach for investigating synaptic transmission and modulation. J Neurosci Methods 130:115–125. [DOI] [PubMed] [Google Scholar]
- Clements JD, Silver RA (2000). Unveiling synaptic plasticity: a new graphical and analytical approach. Trends Neurosci 23:105–113. [DOI] [PubMed] [Google Scholar]
- DiGregorio DA, Nusser Z, Silver RA (2002). Spillover of glutamate onto synaptic AMPA receptors enhances fast transmission at a cerebellar synapse. Neuron 35:521–533. [DOI] [PubMed] [Google Scholar]
- Doyle MW, Andresen MC (2001). Reliability of monosynaptic transmission in brain stem neurons in vitro. J Neurophysiol 85:2213–2223. [DOI] [PubMed] [Google Scholar]
- Doyle MW, Schild JH, Yang M, Andresen MC (1997). Cyclothiazide fails to remove frequency dependent depression of primary sensory synaptic transmission in rat medial nucleus tractus solitarius (mNTS). Soc Neurosci Abstr 23:146. [Google Scholar]
- Doyle MW, Bailey TW, Jin Y-H, Andresen MC (2002). Vanilloid receptors presynaptically modulate visceral afferent synaptic transmission in nucleus tractus solitarius. J Neurosci 22:8222–8229. [DOI] [PMC free article] [PubMed] [Google Scholar]
- Doyle MW, Bailey TW, Jin Y-H, Appleyard SM, Low MJ, Andresen MC (2004). Strategies for cellular identification in nucleus tractus solitarius slices. J Neurosci Methods 37:37–48. [DOI] [PubMed] [Google Scholar]
- Duan YF, Kopin IJ, Goldstein DS (1999). Stimulation of the paraventricular nucleus modulates firing of neurons in the nucleus of the solitary tract. Am J Physiol 277:R403–R411. [DOI] [PubMed] [Google Scholar]
- Dufloth DL, Morris M, Michelini LC (1997). Modulation of exercise tachycardia by vasopressin in the nucleus tractus solitarii. Am J Physiol 273:R1271–R1282. [DOI] [PubMed] [Google Scholar]
- Foster KA, Regehr WG (2004). Variance-mean analysis in the presence of a rapid antagonist indicates vesicle depletion underlies depression at the climbing fiber synapse. Neuron 43:119–131. [DOI] [PubMed] [Google Scholar]
- Gao X, Phillips PA, Widdop RE, Trinder D, Jarrott B, Johnston CI (1992). Presence of functional vasopressin V1 receptors in rat vagal afferent neurones. Neurosci Lett 145:79–82. [DOI] [PubMed] [Google Scholar]
- Glaum SR, Miller RJ (1993). Metabotropic glutamate receptors depress afferent excitatory transmission in the rat nucleus tractus solitarii. J Neurophysiol 70:2669–2672. [DOI] [PubMed] [Google Scholar]
- Harrison J, Jahr CE (2003). Receptor occupancy limits synaptic depression at climbing fiber synapses. J Neurosci 23:377–383. [DOI] [PMC free article] [PubMed] [Google Scholar]
- Hegarty AA, Felder RB (1997). Vasopressin and V1-receptor antagonists modulate the activity of NTS neurons receiving baroreceptor input. Am J Physiol 273:R143–R152. [DOI] [PubMed] [Google Scholar]
- Herman JP, Figueiredo H, Mueller NK, Ulrich-Lai Y, Ostrander MM, Choi DC, Cullinan WE (2003). Central mechanisms of stress integration: hierarchical circuitry controlling hypothalamo-pituitary-adrenocortical responsiveness. Front Neuroendocrinol 24:151–180. [DOI] [PubMed] [Google Scholar]
- Hirasawa M, Mouginot D, Kozoriz MG, Kombian SB, Pittman QJ (2003). Vasopressin differentially modulates non-NMDA receptors in vasopressin and oxytocin neurons in the supraoptic nucleus. J Neurosci 23:4270–4277. [DOI] [PMC free article] [PubMed] [Google Scholar]
- Jin Y-H, Bailey TW, Li BY, Schild JH, Andresen MC (2004). Purinergic and vanilloid receptor activation releases glutamate from separate cranial afferent terminals. J Neurosci 24:4709–4717. [DOI] [PMC free article] [PubMed] [Google Scholar]
- Kolaj M, Renaud LP (1998a). Vasopressin acting at V1-type receptors produces membrane depolarization in neonatal rat spinal lateral column neurons. Prog Brain Res 119:275–284. [DOI] [PubMed] [Google Scholar]
- Kolaj M, Renaud LP (1998b). Vasopressin-induced currents in rat neonatal spinal lateral horn neurons are G-protein mediated and involve two conductances. J Neurophysiol 80:1900–1910. [DOI] [PubMed] [Google Scholar]
- Kunze DL, Andresen MC (1991). Arterial baroreceptors: excitation and modulation. In: Reflex control of the circulation (Zucker IH, Gilmore JP, eds) pp. 141–166. Boca Raton, FL: CRC.
- Landgraf R, Malkinson T, Horn T, Veale WL, Lederis K, Pittman QJ (1990). Release of vasopressin and oxytocin by paraventricular stimulation in rats. Am J Physiol 258:155–159. [DOI] [PubMed] [Google Scholar]
- Lawrence JJ, Grinspan ZM, McBain CJ (2004). Quantal transmission at mossy fibre targets in the CA3 region of the rat hippocampus. J Physiol (Lond) 554:175–193. [DOI] [PMC free article] [PubMed] [Google Scholar]
- Manning M, Stoev S, Chan WY, Sawyer WH (1993). Receptor-specific antagonists of vasopressin and oxytocin. A current perspective. Ann NY Acad Sci 689:219–232. [DOI] [PubMed] [Google Scholar]
- Matsuguchi H, Sharabi FM, Gordon FJ, Johnson AK, Schmid PG (1982). Blood pressure and heart rate responses to microinjections of vasopressin into the nucleus tractus solitarus region of the rat. Neuropharmacology 21:687–693. [DOI] [PubMed] [Google Scholar]
- Mendelowitz D, Yang M, Andresen MC, Kunze DL (1992). Localization and retention in vitro of fluorescently labeled aortic baroreceptor terminals on neurons from the nucleus tractus solitarius. Brain Res 581:339–343. [DOI] [PubMed] [Google Scholar]
- Meyer AC, Neher E, Schneggenburger R (2001). Estimation of quantal size and number of functional active zones at the calyx of held synapse by nonstationary EPSC variance analysis. J Neurosci 21:7889–7900. [DOI] [PMC free article] [PubMed] [Google Scholar]
- Michelini LC (1994). Vasopressin in the nucleus tractus solitarius: a modulator of baroreceptor reflex control of heart rate. Braz J Med Biol Res 27:1017–1032. [PubMed] [Google Scholar]
- Michelini LC, Bonagamba LGH (1988). Baroreceptor reflex modulation by vasopressin microinjected into the nucleus tractus solitarii of conscious rats. Hypertension 11:I75–I79. [DOI] [PubMed] [Google Scholar]
- Michelini LC, Morris M (1999). Endogenous vasopressin modulates the cardiovascular responses to exercise. Ann NY Acad Sci 897:198–211. [DOI] [PubMed] [Google Scholar]
- Murphy GJ, Glickfeld LL, Balsen Z, Isaacson JS (2004). Sensory neuron signaling to the brain: properties of transmitter release from olfactory nerve terminals. J Neurosci 24:3023–3030. [DOI] [PMC free article] [PubMed] [Google Scholar]
- Phillips PA, Widdop RE, Chai SY, Kelly J, Mooser V, Trinder D, Johnston CI (1990). Reduced V1 vasopressin binding in the rat nucleus solitarii after nodose ganglionectomy. Clin Exp Pharmacol Physiol 17:321–325. [DOI] [PubMed] [Google Scholar]
- Pittman QJ, Franklin LG (1985). Vasopressin antagonist in nucleus tractus solitarius/vagal area reduces pressor and tachycardia responses to paraventricular nucleus stimulation in rats. Neurosci Lett 56:155–160. [DOI] [PubMed] [Google Scholar]
- Raggenbass M (2001). Vasopressin- and oxytocin-induced activity in the central nervous system: electrophysiological studies using in-vitro systems. Prog Neurobiol 64:307–326. [DOI] [PubMed] [Google Scholar]
- Saper CB (2002). The central autonomic nervous system: conscious visceral perception and autonomic pattern generation. Annu Rev Neurosci 25:433–469. [DOI] [PubMed] [Google Scholar]
- Saviane C, Silver RA (2006). Fast vesicle reloading and a large pool sustain high bandwidth transmission at a central synapse. Nature 439:983–987. [DOI] [PubMed] [Google Scholar]
- Sawchenko PE, Swanson LW (1982). Immunohistochemical identification of neurons in the paraventricular nucleus of the hypothalamus that project to the medulla or to the spinal cord in the rat. J Comp Neurol 205:260–272. [DOI] [PubMed] [Google Scholar]
- Scheuss V, Schneggenburger R, Neher E (2002). Separation of presynaptic and postsynaptic contributions to depression by covariance analysis of successive EPSCs at the calyx of Held synapse. J Neurosci 22:728–739. [DOI] [PMC free article] [PubMed] [Google Scholar]
- Schild JH, Clark JW, Hay M, Mendelowitz D, Andresen MC, Kunze DL (1994). A- and C-type nodose sensory neurons: model interpretations of dynamic discharge characteristics. J Neurophysiol 71:2338–2358. [DOI] [PubMed] [Google Scholar]
- Sekizawa S, Joad JP, Bonham AC (2003). Substance P presynaptically depresses the transmission of sensory input to bronchopulmonary neurons in the guinea pig nucleus tractus solitarii. J Physiol (Lond) 552:547–559. [DOI] [PMC free article] [PubMed] [Google Scholar]
- Silver RA (2003). Estimation of nonuniform quantal parameters with multiple-probability fluctuation analysis: theory, application and limitations. J Neurosci Methods 130:127–141. [DOI] [PubMed] [Google Scholar]
- Silver RA, Momiyama A, Cull-Candy SG (1998). Locus of frequency-dependent depression identified with multiple-probability fluctuation analysis at rat climbing fibre Purkinje cell synapses. J Physiol (Lond) 510:881–902. [DOI] [PMC free article] [PubMed] [Google Scholar]
- Smith SM, Bergsman JB, Harata NC, Scheller RH, Tsien RW (2004). Recordings from single neocortical nerve terminals reveal a nonselective cation channel activated by decreases in extracellular calcium. Neuron 41:243–256. [DOI] [PubMed] [Google Scholar]
- Sofroniew MV, Schrell U (1981). Evidence for a direct projection from oxytocin and vasopressin neurons in the hypothalamic paraventricular nucleus to the medial oblongata: immunohistochemical visualization of both the horseradish peroxidase transported and the peptide produced by the same neurons. Neurosci Lett 22:211–217. [Google Scholar]
- Trussell LO (1999). Synaptic mechanisms for coding timing in auditory neurons. Annu Rev Physiol 61:477–496. [DOI] [PubMed] [Google Scholar]
- Von Gersdorff H, Borst JG (2002). Short-term plasticity at the calyx of Held. Nat Rev Neurosci 3:53–64. [DOI] [PubMed] [Google Scholar]
- von Kitzing E, Jonas P, Sakmann B (1994). Quantal analysis of excitatory postsynaptic currents at the hippocampal mossy fiber-CA3 pyramidal cell synapse. Adv Second Messenger Phosphoprotein Res 29:235–260. [DOI] [PubMed] [Google Scholar]
- Voorn P, Buijs RM (1983). An immuno-electronmicroscopical study comparing vasopressin, oxytocin, substance P and enkephalin containing nerve terminals in the nucleus of the solitary tract of the rat. Brain Res 270:169–173. [DOI] [PubMed] [Google Scholar]
- Wadiche JI, Jahr CE (2001). Multivesicular release at climbing fiber-Purkinje cell synapses. Neuron 32:301–313. [DOI] [PubMed] [Google Scholar]
- White JD, Krause JE, McKelvy JF (1984). In vivo biosynthesis and transport of oxytocin, vasopressin, and neurophysins to posterior pituitary and nucleus of the solitary tract. J Neurosci 4:1262–1270. [DOI] [PMC free article] [PubMed] [Google Scholar]
- Zucker RS, Regehr WG (2002). Short-term synaptic plasticity. Annu Rev Physiol 64:355–405. [DOI] [PubMed] [Google Scholar]