Abstract
Heme oxygenase (HO) catalyzes heme degradation in a reaction requiring NADPH-cytochrome P450 reductase (CPR). Although most studies with HO used a soluble 30-kDa form, lacking the C-terminal membrane-binding region, recent reports show that the catalytic behavior of this enzyme is very different if this domain is retained; the overall activity was elevated 5-fold, and the Km for CPR decreased approximately 50-fold. The goal of these studies was to accurately measure HO activity using a coupled assay containing purified biliverdin reductase (BVR). This allows measurement of bilirubin formation after incorporation of full-length CPR and heme oxygenase-1 (HO-1) into a membrane environment. When rat liver cytosol was used as the source of partially purified BVR, the reaction remained linear for 2 to 3 min; however, the reaction was only linear for 10 to 30 s when an equivalent amount of purified, human BVR (hBVR) was used. This lack of linearity was not observed with soluble HO-1. Optimal formation of bilirubin was achieved with concentrations of bovine serum albumin (0.25 mg/ml) and hBVR (0.025–0.05 μM), but neither supplement increased the time that the reaction remained linear. Various concentrations of superoxide dismutase had no effect on the reaction; however, when catalase was included, the reactions were linear for at least 4 to 5 min, even at high CPR levels. These results not only show that HO-1-generated hydrogen peroxide leads to a decrease in HO-1 activity but also provide for a chemically defined system to be used to examine the function of full-length HO-1 in a membrane environment.
Heme oxygenase-1 (HO-1) is a membrane-bound enzyme that initiates the oxidative cleavage of heme to carbon monoxide (CO), ferrous iron (Fe2+), and biliverdin, which is further degraded to bilirubin by the cytosolic enzyme biliverdin reductase (BVR) (Tenhunen et al., 1969). HO-1 is the inducible isoform of the enzyme responsible for maintaining heme homeostasis in an array of species (Maines et al., 1986), including humans, in which spleen, liver, and kidney are the main sites of expression (Tenhunen et al., 1968; Martasek et al., 1988). This regulation is essential because free heme is highly toxic (Alam, 2002), but more importantly, the metabolites of heme degradation mediate a variety of vital physiological processes. Bilirubin has been well documented as an initial defense mechanism against cellular oxidative stress and tissue inflammation in response to multiple stimuli (Stocker et al., 1987; Keyse and Tyrrell, 1989; Maines, 1992; Willis et al., 1996; Doré et al., 1999; Lee and Chau, 2002). Regulation of heme metabolism ensures efficient sequestration and recycling of free iron, the second HO-1 metabolite, for the synthesis of other critical hemoproteins (Maines, 1997). The third metabolite, CO, is known to act as a potent vasodilator and anti-inflammatory molecule via cellular signaling cascades akin to nitric oxide (Stevens and Wang, 1993; Verma et al., 1993; Otterbein et al., 2000; Ryter et al., 2002).
HO-1 activity has been measured using several techniques. Although biliverdin is a primary metabolite of the HO-1/heme reaction, it is rarely used as an indicator because of poor spectral properties, having an extinction coefficient (ε) of only ∼8 to 10 mM–1 cm–1 (Kutty and Maines, 1981). Thus, one of the most common HO-1 activity assays relies on the reduction of biliverdin to bilirubin, as originally described by Tenhunen et al. (1968, 1969). In this method, bilirubin formation is monitored spectrophotometrically by the increase in absorbance at 468 nm (ε468 = 43.5 mM–1 cm–1), which is approximately 5-fold higher than that of biliverdin. Variations of this assay can be found throughout the literature, but all rely on the formation of bilirubin as the marker of HO-1 activity. Maines and Kappas (1974) measured HO-1 activity by monitoring bilirubin formation using the difference in absorbance at 464 to 530 nm (ε464–530 = 40 mM –1 cm–1) (Maines and Kappas, 1974; Maines, 1996). Others have used CO production as a method to assay HO-1 activity (Vreman and Stevenson, 1988), but it is less commonly used because of its complexity and the required subsequent product analysis.
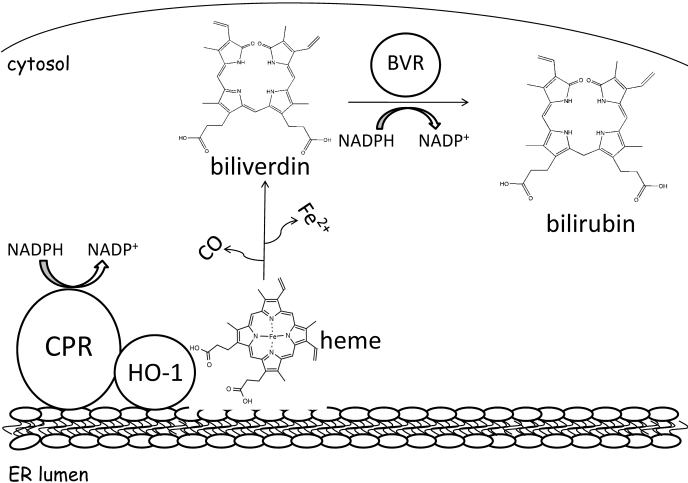
Bilirubin formation requires a contribution from HO-1, NADPH-cytochrome P450 (P450) reductase (CPR), and BVR, which are thought to form a multienzyme complex (Tenhunen et al., 1968; Yoshinaga et al., 1982b). HO-1 and CPR are bound to the endoplasmic reticulum (ER) membrane, as HO-1 requires electrons shuttled through CPR (Schacter et al., 1972), whereas BVR is a cytosolic protein. NADPH supplies electrons to CPR, and they are transported via the flavin groups, FAD and FMN, to HO-1, initiating heme catalysis (Fig. 1). Heme is oxidatively metabolized to biliverdin, which dissociates from the HO-1 and is rapidly converted to the hydrophobic molecule, bilirubin, in an NADPH-dependent reaction catalyzed by cytosolic BVR. Liver cytosol has been used as a source of BVR (Tenhunen et al., 1970). However, the availability of purified rat (Kutty and Maines, 1981) and human (Maines and Trakshel, 1993) BVR improves the quality of the assay by allowing the use of much less enzyme and the removal of other cytosolic constituents that affect heme degradation (Nakajima et al., 1963; 'Carra and Colleran, 1969).
Fig. 1.
Heme degradation pathway. After an obligatory interaction with CPR, HO-1 initiates the oxidative degradation of heme to biliverdin, CO, and Fe2+. Biliverdin is further metabolized to the lipophilic product, bilirubin, by BVR. Although HO-1 and CPR exist bound to the endoplasmic reticulum membrane, BVR is present in the cytosol.
CPR not only supplies electrons to HO-1 but also to P450s and other ER-resident enzymes, such as fatty acid desaturase (Strittmatter et al., 1974), squalene monooxygenase (Laden et al., 2000; Li and Porter, 2007), and cytochrome b5 (Schenkman and Jansson, 2003). Because of the many potential interactions of CPR with other enzymes, it is important to better understand the behavior of HO-1 with CPR in a membrane environment. This requires the examination of full-length HO-1 because of the inability of the soluble form to associate with the membrane (Huber et al., 2009). The interplay between CPR and its many electron acceptors can have a significant effect on heme degradation, drug metabolism, and cholesterol synthesis, as well as fatty acid metabolism.
Recently, our laboratory showed that the C-terminal region present on HO-1 influences both membrane incorporation and the formation of a high-affinity complex between full-length HO-1 and CPR (Huber et al., 2009). Not only does this form of HO-1 bind tightly to the membrane and CPR but also the characteristics of heme degradation by the full-length protein differ significantly from those found with the soluble enzyme, requiring re-examination of the conditions for the standard HO-1 assay. In this study, we report on an assay designed to examine HO-1 further in a membrane environment. The replacement of crude rat liver cytosol with purified human biliverdin reductase (hBVR), together with the optimization of other assay components, such as the addition of catalase, resulted in a method that accurately measures HO-1 activity for an extended period. Because the assay involves known concentrations of all three enzymes, each can be effectively controlled and varied. With the development of this assay, the interactions of membrane-bound HO-1 and CPR can be more closely examined.
Materials and Methods
Materials. Heme, NADPH, EDTA, glycerol, dilauroylphosphatidylcholine (DLPC), catalase from bovine liver, superoxide dismutase (SOD), hydrogen peroxide (30%) (H2O2), trichloroacetic acid, ferrous ammonium sulfate, potassium thiocyanate, and bovine serum albumin (BSA) were purchased from Sigma-Aldrich (St. Louis, MO). The biliverdin used in BVR quantification was purchased from Frontier Scientific (Logan, UT). All the spectrophotometric analyses of HO-1 activity were performed on a SpectraMax M5 plate reader from Molecular Devices (Sunnyvale, CA).
HO-1 Expression and Purification. Recombinant, full-length, human HO-1 was purified and quantified as described previously (Huber and Backes, 2007, 2008). The HO-1 preparation contains an R254K mutation to enhance protein stability during the glutathione S-transferase-tag removal procedure involving the protease thrombin. Aliquots of the apoprotein were stored at –80°C.
CPR Expression and Purification. Full-length human CPR was expressed and purified from Escherichia coli according to a previously described method (Marohnic et al., 2006), with minor modifications. After the ultracentrifugation for 1 h at 100,000g, the detergent-solubilized protein fraction (supernatant) was applied to 2′,5′-ADP-Sepharose 4B (GE Healthcare, Little Chalfont, Buckinghamshire, UK) and washed extensively with detergent-free buffer until the A280 nmin = A280 nmout. A further wash step containing 5 mM adenosine was used before elution of CPR using dual 2′AMP gradients (0–500 μM and 0.5–5 mM), which effectively separated full-length from N-terminal truncated products. The protein migrated as a single band by SDS-polyacrylamide gel electrophoresis after Coomassie Blue staining. Pooled fractions were concentrated using Centriprep (Millipore Corporation, Billerica, MA) centrifugal concentrators with 30-kDa molecular mass cutoff. Specific content was measured by absorbance of oxidized protein-bound flavins in the visible region of the spectrum using an extinction coefficient of 21.4 mM–1 cm–1 and by the Micro BCA method according to the manufacturer's protocol (Pierce, Rockford, IL). Each assay was performed in triplicate using multiple dilutions. Aliquots were stored under liquid N2.
Isolation of BVR from Rat Liver Cytosol and Expression and Purification of hBVR. Rat liver cytosol provided the source of partially purified rat BVR and was prepared according to previously described methods (Tenhunen et al., 1970; Kutty and Maines, 1981). Recombinant hBVR was prepared as follows. The hBVR cDNA was amplified by polymerase chain reaction using primers 5′-GAGACCCATATGAATACAGAGCCCGAG-3′ and 5′-GACACTCGAGTGGAAGTGCTACATCACCT-3′ and cloned between the NdeI and XhoI sites of vector pET-19b (Novagen, Madison, WI), resulting in the addition of an N-terminal His10 tag. For His-hBVR purification, pET19b/hBVR was transformed into BL21 (DE3) cells, and an individual transformant was cultured for 20 h at 37°C in 400 ml of 2×YT media. Cells were pelleted by centrifugation at 7000g for 10 min at 4°C, and the pellet was resuspended in 10 ml of binding buffer (20 mM Tris-HCl, pH 8.0, containing 5 mM imidazole and 0.5 M NaCl). The cell suspension was supplemented with 1.5 mg of lysozyme, 0.5 mM benzamidine, and 0.2 mM phenylmethylsulfonyl fluoride and incubated on ice for 15 min, after which Triton X-100 was added to a final concentration of 0.1% (v/v). The cells were sonicated (3 × 6 s) and then centrifuged 15,000g for 15 min. The supernatant was collected and subjected to Ni2+ affinity chromatography as described previously (He et al., 2001). In brief, the cell extract was loaded on a Ni2+-agarose column (2-ml bed volume) equilibrated in binding buffer. After loading, the column was washed with 10 bed volumes of binding buffer, followed by 10 volumes of wash buffer (20 mM Tris-HCl, pH 8.0, containing 60 mM imidazole and 0.5 M NaCl). His-hBVR was eluted with elution buffer (20 mM Tris-HCl, pH 8.0, containing 250 mM imidazole and 0.5 M NaCl) and collected in 0.5-ml fractions. Appropriate fractions were pooled and dialyzed for 2 to 4 h at 4°C against two changes of 250 ml of His-tag dialysis buffer (20 mM Tris-HCl, pH 8.0, containing 40 mM NaCl, 0.1 mM phenylmethylsulfonyl fluoride, and 20% glycerol). Protein concentration was determined by the Bradford assay, and purity was determined by SDS-polyacrylamide gel electrophoresis.
BVR Activity Assay. The specific activity of partially purified rat BVR and hBVR was analyzed by monitoring the conversion of biliverdin to bilirubin. Assay conditions were carried out as previously described (Kutty and Maines, 1981) with minor modifications. The assay buffer was 100 mM KPO4, pH 7.4, supplemented with 0.25 mg/ml fatty acid-free BSA. The reaction was performed in a Spectramax M5 plate reader (Molecular Devices) at 37°C for approximately 5 min. The addition of NADPH (0.5 mM) initiated the reaction, and buffer was added to the reference wells. Enzyme activity was calculated by the increase in absorbance at 450 nm using the extinction coefficient 53 mM–1 cm–1. One unit of BVR was defined as the amount of enzyme required to metabolize 1 nmol/h biliverdin.
Reconstitution of HO-1 and CPR in DLPC Liposomes. Reconstituted systems (RCSs) were made by preincubating HO-1 and CPR with DLPC for 2 h at room temperature, according to our recent report describing the incorporation of HO-1 and CPR into preformed DLPC liposomes (Huber et al., 2009). A stock suspension of DLPC liposomes was prepared to 8 mM in 50 mM potassium phosphate buffer, pH 7.25, supplemented with 20% glycerol, 0.1 M NaCl, and 5 mM EDTA (DLPC sonication buffer) and sonicated in a water bath until clear (approximately 15–20 min). In the initial BVR comparison experiments, as well as the BSA and BVR titration experiments, the DLPC/HO-1 ratio was 160:1, which was found to be optimal for certain P450 enzymes (Causey et al., 1990). For the DLPC titration, RCSs prepared with various DLPC/HO-1 ratios, ranging from 0:1 to 1280:1, were assayed. RCSs for the final CPR titration were prepared in 350:1 DLPC/HO-1 ratio, which was determined to be optimal. The final concentration of HO-1 in all the RCSs was 0.05 μM, unless otherwise stated. CPR levels for all the experiments were held constant at 0.01 μM (1:5 CPR/HO-1 ratio) and 0.2 μM (4:1 CPR/HO-1 ratio), with the exception being the CPR titration where the concentrations ranged from 0 to 0.1 μM.
Optimization Experiments. HO-1 activity was examined using the compound bilirubin assay as previously reported (Maines, 1996; Huber and Backes, 2007) with minor modifications. Bilirubin formation was monitored at 464 to 530 nm, and the enzyme activity was calculated using the extinction coefficient 40 mM–1 cm–1. In general, RCSs were prepared and allowed to preincubate for 2 h at room temperature before the addition of other assay components as described above. The final volume for all the assays was 0.1 ml. All the activity assays were allowed to preincubate at 37°C for 2 min before the addition of 0.5 mM NADPH to initiate the reaction. Each reaction was performed in triplicate, and the activity was expressed as nanomoles of bilirubin per hour per nanomole of HO-1 (nmol/h/nmol).
In the initial BVR comparison study, the RCSs were mixed into 100 mM KPO4, pH 7.4, 0.25 mg/ml fatty-acid free BSA, 15 μM heme, and ∼100 U/ml both BVR sources, assayed separately. For the pure BVR studies, the RCSs were mixed with the same assay components, but the levels of BVR were varied from 0 to 0.1 μM. The BSA titration was performed by adding increasing levels of fatty acid–free BSA (0–2.0 mg/ml) into the 100 mM KPO4 assay buffer before the addition of the RCS. When SOD and catalase were titrated separately into the reactions, the concentrations were 0 to 1.25 and 0 to 2.5 U/μl, respectively. As mentioned above, the DLPC titration involved increasing lipid levels in the RCS, but all the other assay conditions remained the same. The CPR titration was performed under the following optimized assay conditions: 350:1 DLPC/HO-1, 15 μM heme, 100 mM KPO4, supplemented with 0.25 mg/ml fatty acid-free BSA, 0.05 μM pure hBVR, and 0.5 U/μl catalase.
Additional Experiments. Exogenous H2O2 ranging from 0 to 60 μM was added to the HO-1 reactions before the addition of NADPH. The HO-1 and CPR concentrations were 0.05 and 0.1 μM, respectively. As described above, bilirubin formation was monitored real time. In the experiments designed to measure H2O2 production, the HO-1 and 30-kDa soluble human heme oxygenase-1 (sHO-1) concentrations used were 0.5 μM in a reaction volume of 0.2 ml. The DLPC/HO-1 ratio was 320:1. Three CPR/HO-1 ratios were examined, including 1:5, 2:1, and 15:1. The buffer was 100 mM potassium phosphate, pH 7.4, containing 0.165 mg/ml BSA. The 30-s reactions were initiated with 0.2 mM NADPH and were quenched by pipetting 0.15 ml of the incubation into 0.25 ml of ice-cold 3% trichloroacetic acid. H2O2 was detected by the colorimetric reaction with ferrous ammonium sulfate and potassium thiocyanate as described previously (Hildebrandt et al., 1978).
Results
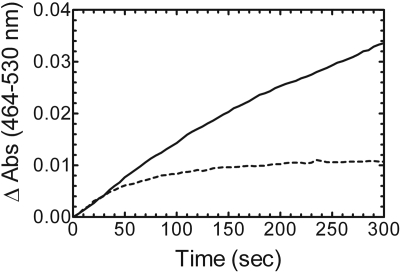
Comparison of Partially Purified BVR from Rat Liver Cytosol with Purified, Recombinant hBVR. The membrane-binding region of full-length HO-1 has a significant influence on the kinetic characteristics of the enzyme (Huber and Backes, 2007). These differences call into question whether conditions that are adequate for measuring the activity of soluble HO-1 can be used to examine the full-length form of the enzyme. Thus, it was important to identify the components necessary and the optimal concentrations required for a reliable assay of HO-1 activity under chemically defined conditions. As a first step, BVR acquired from two different sources was compared: the commonly used partially purified BVR from rat liver cytosol and a highly purified, recombinant hBVR prepared in our laboratory. Figure 2 illustrates bilirubin formation at 464 to 530 nm in a reaction that included HO-1 (0.05 μM), saturating CPR (0.2 μM), and saturating BVR (100 U/ml). Initially, the reaction rate of bilirubin formation for both BVR samples was equivalent at approximately 650 nmol/h/nmol HO-1; however, the duration of linearity for each reaction was drastically different. The reaction in the presence of rat liver cytosol was linear for ∼2 min, whereas that in the presence of purified BVR was linear for only 20 to 30 s. Because the reaction catalyzed by pure BVR was linear for such a brief period, measurement of the rate of bilirubin formation was more difficult and suggested either some limitation in a substrate (e.g., NADPH or heme) or degradation of a product, intermediate, or enzyme. One explanation for these results is that the rat liver cytosol contained one or more constituents that supported the formation of bilirubin for a longer period.
Fig. 2.
Bilirubin formation catalyzed by BVR from two different sources. Recombinant hBVR was purified to apparent homogeneity, and rat liver cytosol served as a partially purified source of BVR. Real-time curves from 0 to 300 s of bilirubin formation catalyzed by partially pure BVR (solid line) and pure BVR (dashed line).
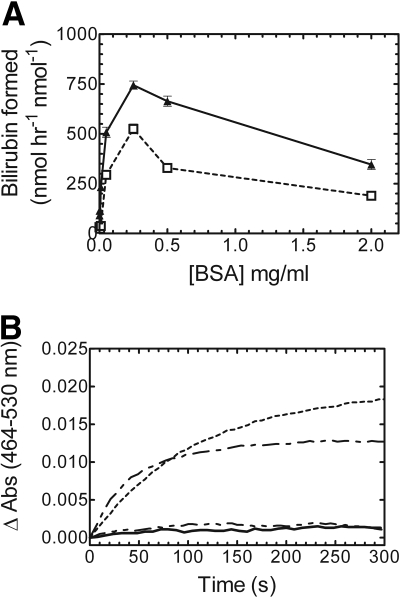
BSA Titration of the HO-1 Activity Assay. Next, we wanted to test various conditions in an attempt to increase linearity of the pure BVR reaction. BSA has been reported to stabilize BVR, protect it from dilution-dependent inactivation, and increase overall activity (Kutty and Maines, 1981). Titration studies were designed to determine the BSA concentration required for optimal bilirubin production, and also to determine whether BSA affected the linearity of the time course. As shown in Fig. 3A, BSA was required for bilirubin production at 0.05 μM HO-1 with subsaturating (1:5 CPR/HO-1) and saturating (2:1 CPR/HO-1) levels of CPR. It is interesting to note that at both CPR/HO-1 ratios, 0.25 mg/ml was determined to be the optimal concentration of BSA. Above this level, BSA inhibited the reaction. The real-time kinetic curves (Fig. 3B) indicated that BSA clearly had no influence on the linearity of the reaction for both CPR concentrations, and in agreement with previous reports and Fig. 3A, there was little to no bilirubin formation if BSA was excluded from the reaction. Conversely, when rat liver cytosol was used in the reaction, exogenous BSA was not required for activity, suggesting that the cytosol contained a certain level of an endogenous protein that could substitute for albumin (data not shown); however, even in this case, optimal activity was achieved when BSA was included. Although these results indicated that BSA was required for bilirubin production and the optimal concentration was established, as shown by the real-time kinetic curves, BSA was unable to increase the length of linearity. Thus, the absence of BSA, or other putative stabilizing protein, in the pure BVR was not the cause for the very short duration of linearity of the time course.
Fig. 3.
BSA is required for optimal bilirubin production at subsaturating and saturating CPR levels. A, BSA titration of a bilirubin assay at 1:5 CPR/HO-1 (□, dashed line) and 2:1 CPR/HO-1 (▴, solid line). B, real-time kinetic traces of bilirubin production with 0 mg/ml BSA, 1:5 CPR/HO-1 (——); 0 mg/ml BSA, 2:1 CPR/HO-1 (— ·· —); 0.25 mg/ml BSA, 1:5 CPR/HO-1 (— · —); and 0.25 mg/ml BSA, 2:1 CPR/HO-1 (- - -). HO-1 concentration was 0.05 μM for all the assays. Values in A represent the mean ± S.E. of n = 3.
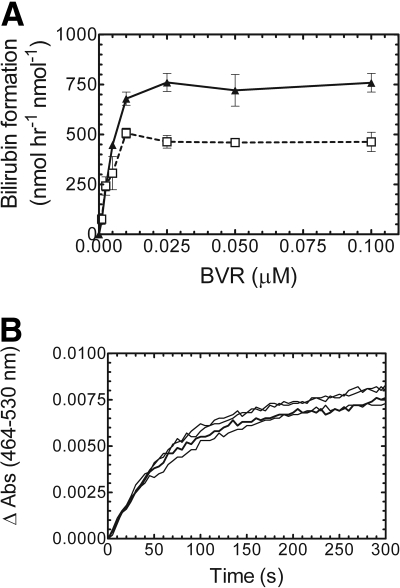
BVR Titration of the HO-1 Assay. Initially, it was hypothesized that the substrate heme may be limiting in the HO-1 assay that contained pure BVR, but this was later shown not to be the case. The optimal heme concentration was 15 μM (data not shown). The apparent Km was approximately 2 μM, which is consistent with previously reported values (Yoshinaga et al., 1982a). Thus, the next set of studies focused on possible product inhibition by biliverdin. Biliverdin, at excess concentrations, was reported to be a potent inhibitor of both HO-1 and BVR (Kutty and Maines, 1984). To examine the effect of increasing BVR levels in the HO-1 assay, 0 to 0.1 μM pure BVR was titrated at 1:5 CPR/HO-1 and 2:1 CPR/HO-1 (Fig. 4A). The optimal BVR level was in excess of 0.01 μM at subsaturating reductase (i.e., 1:5 CPR/HO-1) and 0.025 μM for the reaction at 2:1 CPR/HO-1; in these experiments the HO-1 concentration was 0.05 μM. If excess biliverdin was responsible for the depressed length of linearity, then the higher BVR levels would have cleared the product more rapidly, allowing for a longer linear reaction. The real-time kinetic curves of the four highest BVR concentrations (Fig. 4B) showed that increased BVR concentration had no effect on the length of linearity. A spectral scan of the completed reaction showed no buildup of biliverdin (based on the absorbance at 680 nm), suggesting that BVR effectively prevented accumulation of biliverdin to an inhibitory level (data not shown). These results identified the optimal BVR concentration for the HO-1 assay but showed that the curvature in the time course was not attributable to the accumulation of biliverdin.
Fig. 4.
BVR titration and real-time curves of bilirubin production. A, BVRs ranging from 0 to 0.1 μM were analyzed to determine the optimal concentration for bilirubin production at subsaturating and saturating CPR concentrations: 1:5 CPR/HO-1 (□) and 2:1 CPR/HO-1 (▴). B, real-time bilirubin assay curves of the four highest BVR concentrations (0.01–0.1 μM). HO-1 concentration was 0.05 μM for all the assays. Values in A represent the mean ± S.E. of n = 3.
Addition of SOD and Catalase to the HO-1 Assay. Having shown that excess BSA and BVR had no effect on the reaction time, formation of reactive oxygen species was probed as the cause of the depressed linearity of the time course. In the presence of certain substrates, flavoproteins, such as CPR, have a tendency to interact with molecular oxygen and produce reactive oxygen species, such as superoxide (Prough and Masters, 1973; Massey, 1994). In addition, H2O2 formed in the HO-1 reaction causes nonspecific heme degradation and inhibition of HO-1 (Noguchi et al., 1983). To address these possibilities, HO-1 activity was measured in the presence of scavengers of superoxide and H2O2 by titration with SOD and catalase, respectively. As shown in Fig. 5, A and B, the addition of increasing concentrations of SOD (0–1.25 U/ml) caused no change in the reaction length, regardless of the CPR concentration. However, when catalase (0–2.5 U/ml) was included, the linearity of the time course for bilirubin formation increased at both 1:5 and 2:1 CPR/HO-1 (Fig. 5, C and D). It is interesting to note that as catalase was added, the kinetic curve began to resemble that seen when the rat liver cytosol was used as the source of BVR, suggesting that the crude cytosol may contain catalase or another agent capable of neutralizing H2O2. These results were surprising because in many enzyme systems that require CPR, O –2 is produced, which is detrimental at very small concentrations. Therefore, either there was negligible O –2 production or the O –2 formed had no effect on the reaction. These results were consistent with those previously reported by Noguchi et al. (1983) for HO-1 purified from pig spleen microsomes.
Fig. 5.
Effect of SOD and catalase on the linearity of the bilirubin formation real-time activity curves. A and B, increasing amounts of superoxide dismutase (0, 0.00025, 0.00125, 0.00625, 0.025, 0.25, 0.625, and 1.25 U/μl) were added to the reaction mixture containing 1:5 (A) and 2:1 (B) CPR/HO-1. C and D, catalase (0, 0.00025, 0.00625, 0.025, 0.25, 0.625, 1.25, and 2.5 U/μl) was titrated into the 1:5 (C) and 2:1 (D) CPR/HO-1 reactions. HO-1 concentration was 0.05 μM for all the reactions.
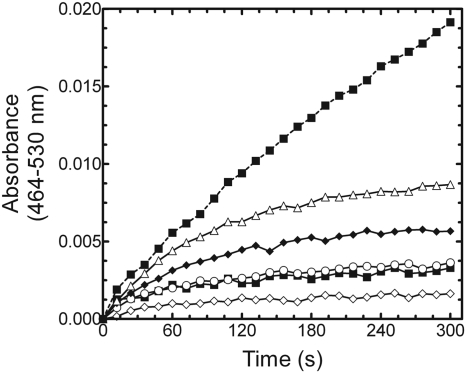
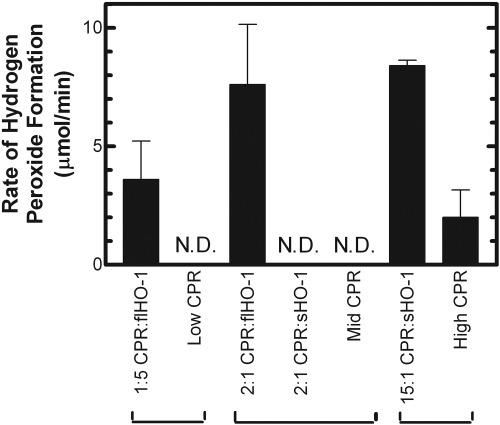
Effect of H2O2 on the HO-1 Assay. Because the addition of catalase improved the reaction linearity, we next wanted to examine the effect of exogenous H2O2 on HO-1 activity. As seen in Fig. 6, the rate of bilirubin formation is severely reduced in the presence of exogenous H2O2. When catalase was included in the reaction as a control, the reaction was linear for a longer period, consistent with the data in Fig. 5. Next, to determine the source of the H2O2, we measured H2O2 formation in the presence and absence of HO-1 at multiple CPR concentrations. As shown in Fig. 7, HO-1 produced H2O2 at 1:5 and 2:1 CPR/HO-1; however, H2O2 levels were undetectable in the reactions containing 2:1 CPR/sHO-1, as well as those devoid of HO-1. When CPR levels were increased to 15:1, the sHO-1 reaction produced an H2O2 level that was comparable with the rates observed with the 2:1 CPR/HO-1 system; however, approximately 25% of the peroxide production resulted from that quantity of CPR alone (Fig. 7).
Fig. 6.
Effect of H2O2 on HO-1 activity. H2O2 was added to a series of HO-1 reactions containing 2:1 CPR/HO-1 in the absence of catalase. H2O2 concentrations included 0 μM (▵), 5 μM (♦), 15 μM (○), 30 μM (▪), and 60 μM (⋄). Bilirubin formation in the presence of catalase and no exogenous H2O2 was included for comparison (dashed line). Each point represents the average of three determinations.
Fig. 7.
Generation of H2O2 by full-length and soluble HO-1. H2O2 produced by HO-1 and sHO-1 was measured at various CPR/HO-1 ratios. The HO-1/sHO-1 concentration was 0.5 μM. Low, mid, and high CPR corresponds to a DLPC/CPR reconstituted system (devoid of HO-1) using the same CPR concentrations as those used in the 1:5, 2:1, and 15:1 conditions. N.D. indicates that H2O2 was not detected. Each bar represents the mean ± S.E.M. for three determinations.
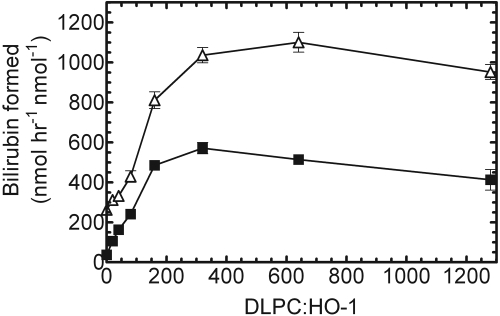
Characterization of DLPC Concentration in Reconstituted Systems. The presence of the membrane-spanning region on HO-1 is required for efficient membrane incorporation, which is achieved after a 2-h preincubation period at room temperature. All the previous characterization experiments have been performed using a DLPC/HO-1 ratio of 160:1, which was found to be optimal for other membrane-bound proteins, such as P450 (Causey et al., 1990). With other assay components optimized, the goal of this study was to determine the DLPC/HO-1 ratio that resulted in the optimal HO-1 activity. When subsaturating CPR (0.01 μM) was preincubated with 0.05 μM HO-1 in various DLPC concentrations, the optimal DLPC/HO-1 ratio was approximately 250:1 to 350:1 (Fig. 8). Similar results were achieved at saturating CPR, but the optimal ratio was much broader and slightly increased at approximately 300:1 to 600:1. One explanation for these results is that the increased DLPC concentration forces a higher level of dispersion among the hydrophobic proteins, allowing for more efficient HO-1/CPR complex formation. At the lower CPR concentration, the DLPC/protein ratio of 160:1 was sufficient to produce approximately 90% of the optimal HO-1 activity. When CPR was saturating (2:1), the activity at 160:1 was approximately 75 to 80% of that seen with higher lipid. Thus, these data indicate that reconstituted systems containing HO-1, CPR, and a higher DLPC/HO-1 ratio than typically used provide an improved environment for HO-1 activity.
Fig. 8.
DLPC titration of HO-1 in RCS. DLPC levels were varied from 0 to 1200:1 DLPC/HO-1. After the 2-h incubation period at room temperature, the RCSs were assayed by monitoring bilirubin formation at 464 to 530 nm. Shown here are 1:5 CPR/HO-1 (▪) and 2:1 CPR/HO-1 (▵). The HO-1 concentration was 0.05 μM for all the assays. Values represent the mean ± S.E. of n = 3.
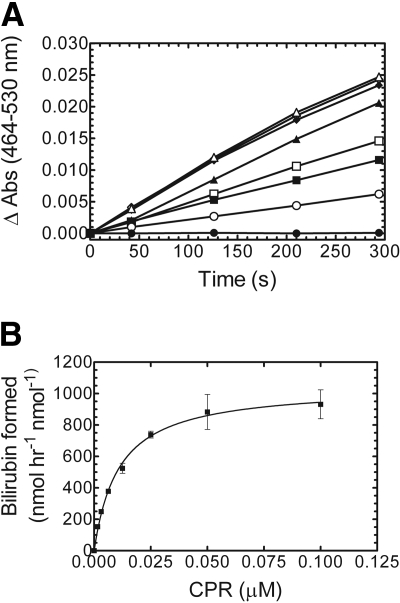
CPR Titration of HO-1. The original goal of this study was to develop an assay to measure the activity of HO-1 in the membrane environment by following bilirubin formation under defined conditions that can be used at a variety of controlled CPR/HO-1 ratios. However, the rapid deviation from linearity with membrane-bound HO-1 required investigation as to its cause and a methodological modification that produced a linear response. With the addition of catalase, the reactions remained linear for at least 3 min at both subsaturating and saturating CPR levels. The next experiment was to use these defined assay conditions to examine HO-1 activity as a function of CPR concentration. Reconstituted systems containing 0.05 μM human HO-1 and varying levels of human CPR (0–0.1 μM) at a 320:1 DLPC/HO-1 ratio were preincubated and HO-1 activity determined by following bilirubin formation. Other assay components included 15 μM heme, 0.05 μM pure hBVR, 0.25 mg/ml BSA, and 0.5 U/μl catalase. As shown in Fig. 9A, all the reactions remained linear for at least 3 to 5 min. The result of this experiment showed that with all the assay components optimized, HO-1 activity was monitored effectively and accurately at a variety of CPR concentrations using a defined bilirubin assay.
Fig. 9.
Effect of CPR concentration on HO-1 activity. A, time course for bilirubin formation. CPR concentrations included 0 μM (•), 0.0015 μM (○), 0.003 μM (▪), 0.00625 μM (□), 0.0125 μM (▴), 0.025 μM μM (▵), 0.05 μM (♦), and 0.1 μM (⋄). B, the rate of bilirubin formation as a function of CPR concentration. All the assays contained 0.05 μM HO-1. Values in B represent the mean ± S.E. of n = 3.
Figure 9B shows HO-1 activity as a function of CPR concentration. Because the reactions remained linear for at least 3 min, we were able to measure the initial rate of bilirubin formation over this range of CPR concentrations. As CPR concentration was increased, the activity increased and eventually saturated. The curve fit a simple one-site hyperbolic function, and the apparent Km was calculated to be approximately 0.01 μM. Taken together, the results of the CPR titration confirmed that the newly developed HO-1 assay was functional at a variety of CPR concentrations.
Discussion
Although biliverdin is a direct product of the initial oxidative degradation of heme, its poor spectral characteristics limit its utility as an effective indicator of HO-1 activity. As a result, bilirubin, which is not directly produced by HO-1, is often used to characterize HO-1 activity. In the coupled assay where bilirubin formation is monitored, HO-1 activity can be more readily quantified. Saturating levels of BVR ensure that the reduction of biliverdin to bilirubin is not the limiting factor in the rate of heme degradation (Kutty and Maines, 1981). In particular, in an HO-1 activity assay, the source of BVR was not considered to be crucial, provided it was present at a saturating level. In this report, using highly purified enzyme preparations, a defined method has been developed to assay membrane-bound HO-1 activity by monitoring the rate of bilirubin formation spectrophotometrically. This new method allows for more effective characterization studies because 1) relative levels of the constituent proteins can be varied; 2) full-length HO-1 and CPR are used in a lipid milieu; and 3) activities can be reliably determined.
When the HO-1 assay was performed with BVR from different sources, it was clear that the BVR from rat liver cytosol (partially pure BVR) contained some component to increase linearity that was not present in the purified sample. Both heme depletion and inhibition by biliverdin and/or bilirubin were eliminated as causes of the rapid degradation of the rate of reaction. BSA was also eliminated as affecting the loss of linearity with time, although it seemed to be a necessary assay component. BSA was previously reported to stabilize and increase BVR activity by as much as 70% (Kutty and Maines, 1981), possibly by removing bilirubin from the binding site of BVR. Albumin, or something equivalent, is one component that is endogenously present in the partially purified BVR; however, because the addition of BSA had no effect on linearity of the pure sample, inhibition of the reaction by bilirubin seemed unlikely.
The use of SOD and catalase established that H2O2 was generated at high enough concentrations to lead to the curvature in the time course. This conclusion is in strong agreement with a previous report describing the ability of uncoupled HO-1 to produce large quantities of H2O2, leading to inhibition of heme degradation using HO-1 isolated from pig microsomes (Noguchi et al., 1983). In addition, the conversion of heme to biliverdin continued after the addition of catalase. It is interesting to note that the antioxidant effects of liver cytosol were documented in an article criticizing the measurement of bilirubin formation as a method for measurement of heme oxygenase activity (Lodola et al., 1979). This report criticized an assay that used microsomal tissues and partially purified enzymes as the sources for the assay components because of concerns regarding spectral interference from crude cytosolic fractions. Our assay, using only purified components, avoided this potential limitation. However, the presence of endogenous catalase could explain the kinetic differences between the HO-1 assays catalyzed by partially pure BVR from rat liver cytosol and purified hBVR.
The deviation from linearity caused by H2O2 formation was further supported by experiments showing that 1) direct addition of H2O2 to the assay caused a decrease in the rate of bilirubin formation, and 2) H2O2 was produced by the HO-1 reaction. It is interesting to note that H2O2 generation was much more efficient with the full-length form of HO-1 than with the soluble form. We were able to obtain comparable levels of H2O2 formation with the soluble form when the CPR concentration was elevated to a 15:1 CPR/HO-1 ratio—the same level of reductase that is required to obtain comparable rates of bilirubin production. Therefore, it is likely that the lower rate of peroxide formation is caused by the less efficient complex formed between CPR and sHO-1, and explains the difference in linearity between the full-length and soluble forms of HO-1.
The development of our assay allows for a more accurate study of HO-1 in a membrane with CPR. Multiple studies have shown a possible interaction between CPR and BVR, as well as mutual inhibition (Wang and de Montellano, 2003; Higashimoto et al., 2005); however, in our titration experiments, there was no direct evidence that increased concentrations of either protein had any influence on the other. It must also be noted that a majority of the previous work involving HO-1, CPR, and BVR was performed with soluble enzymes. With HO-1 and CPR reconstituted into a membrane milieu, the lipid may be sequestering the two proteins and altering the ability of BVR to compete with CPR in this reaction. Another possibility is that membrane-bound HO-1 has a different conformation than sHO-1, effectively changing the way biliverdin is released from the active site. Because HO-1 and CPR are membrane-bound proteins, the presence of membrane hydrophobic milieu (DLPC or ER membrane) may alter the mechanism by which cytosolic BVR metabolizes its substrate biliverdin to bilirubin. With the development of this assay, these questions can be addressed in a lipid environment using full-length proteins. Future studies will be designed to answer questions regarding potential interactions among the three enzymes.
This work was supported in part by the National Institutes of Health National Institute of Environmental Health Sciences [Grant ES004344]; the National Institutes of Health National Institute of General Medical Sciences [GM081568]; and the Robert A. Welch Foundation [AQ-0012] (to B.S.S.M.).
Article, publication date, and citation information can be found at http://dmd.aspetjournals.org.
doi:10.1124/dmd.108.025023.
ABBREVIATIONS: HO-1, heme oxygenase-1, full-length; CO, carbon monoxide; Fe2+, ferrous iron; BVR, biliverdin reductase; P450, cytochrome P450; CPR, NADPH-cytochrome P450 reductase; ER, endoplasmic reticulum; hBVR, human biliverdin reductase; DLPC, dilauroylphosphatidylcholine; SOD, superoxide dismutase; H2O2, hydrogen peroxide; BSA, bovine serum albumin; RCS, reconstituted system; sHO-1, 30-kDa soluble human heme oxygenase-1.
References
- Alam J (2002) Heme oxygenase-1: past, present, and future. Antioxid Redox Signal 4 559–562. [DOI] [PubMed] [Google Scholar]
- 'Carra PO and Colleran E (1969) HAEM catabolism and coupled oxidation of haemproteins. FEBS Lett 5 295–298. [DOI] [PubMed] [Google Scholar]
- Causey KM, Eyer CS, and Backes WL (1990) Dual role of phospholipid in the reconstitution of cytochrome P-450 LM2-dependent activities. Mol Pharmacol 38 134–142. [PubMed] [Google Scholar]
- Doré S, Takahashi M, Ferris CD, Zakhary R, Hester LD, Guastella D, and Snyder SH (1999) Bilirubin, formed by activation of heme oxygenase-2, protects neurons against oxidative stress injury. Proc Natl Acad Sci U S A 96 2445–2450. [DOI] [PMC free article] [PubMed] [Google Scholar]
- He CH, Gong P, Hu B, Stewart D, Choi ME, Choi AM, and Alam J (2001) Identification of activating transcription factor 4 (ATF4) as an Nrf2-interacting protein. Implication for heme oxygenase-1 gene regulation. J Biol Chem 276 20858–20865. [DOI] [PubMed] [Google Scholar]
- Higashimoto Y, Sakamoto H, Hayashi S, Sugishima M, Fukuyama K, Palmer G, and Noguchi M (2005) Involvement of NADPH in the interaction between heme oxygenase-1 and cytochrome P450 reductase. J Biol Chem 280 729–737. [DOI] [PubMed] [Google Scholar]
- Hildebrandt AG, Roots I, Tjoe M, and Heinemeyer G (1978) Hydrogen peroxide in hepatic microsomes. Methods Enzymol 52 342–350. [DOI] [PubMed] [Google Scholar]
- Huber WJ 3rd and Backes WL (2007) Expression and characterization of full-length human heme oxygenase-1: the presence of intact membrane-binding region leads to increased binding affinity for NADPH cytochrome P450 reductase. Biochemistry 46 12212–12219. [DOI] [PMC free article] [PubMed] [Google Scholar]
- Huber WJ 3rd and Backes WL (2008) Quantitation of heme oxygenase 1: heme titration increases yield of purified protein. Anal Biochem 373 167–169. [DOI] [PMC free article] [PubMed] [Google Scholar]
- Huber Iii WJ, Scruggs BA, and Backes WL (2009) C-Terminal membrane spanning region of human heme oxygenase-1 mediates a time dependent complex formation with cytochrome P450 reductase. Biochemistry 48 190–197. [DOI] [PMC free article] [PubMed] [Google Scholar]
- Keyse SM and Tyrrell RM (1989) Heme oxygenase is the major 32-KDa stress protein induced in human skin fibroblasts by UVA radiation, hydrogen peroxide, and sodium arsenite. Proc Natl Acad Sci U S A 86 99–103. [DOI] [PMC free article] [PubMed] [Google Scholar]
- Kutty RK and Maines MD (1984) Hepatic heme metabolism: possible role of biliverdin in the regulation of heme oxygenase activity. Biochem Biophys Res Commun 122 40–46. [DOI] [PubMed] [Google Scholar]
- Kutty RK and Maines MD (1981) Purification and characterization of biliverdin reductase from rat liver. J Biol Chem 256 3956–3962. [PubMed] [Google Scholar]
- Laden BP, Tang Y, and Porter TD (2000) Cloning, heterologous expression, and enzymological characterization of human squalene monooxygenase. Arch Biochem Biophys 374 381–388. [DOI] [PubMed] [Google Scholar]
- Lee TS and Chau LY (2002) Heme oxygenase-1 mediates the anti-inflammatory effect of interleukin-10 in mice. Nat Med 8 240–246. [DOI] [PubMed] [Google Scholar]
- Li L and Porter TD (2007) Hepatic cytochrome P450 reductase-null mice reveal a second microsomal reductase for squalene monooxygenase. Arch Biochem Biophys 461 76–84. [DOI] [PubMed] [Google Scholar]
- Lodola A, Hendry GA, and Jones OT (1979) Haem oxygenase: a reappraisal of the stoicheiometry. FEBS Lett 104 45–50. [DOI] [PubMed] [Google Scholar]
- Maines M (1996) Carbon monoxide and nitric oxide homology: differential modulation of heme oxygenases in brain and detection of protein and activity. Methods Enzymol 268 473–488. [DOI] [PubMed] [Google Scholar]
- Maines MD (1992) Heme Oxygenase: Clinical Applications and Functions, pp 203–266, CRC Press, Inc., Boca Raton, FL.
- Maines MD (1997) The heme oxygenase system: a regulator of second messenger gases. Annu Rev Pharmacol Toxicol 37 517–554. [DOI] [PubMed] [Google Scholar]
- Maines MD and Kappas A (1974) Cobalt induction of hepatic heme oxygenase; with evidence that cytochrome P-450 is not essential for this enzyme activity. Proc Natl Acad Sci U S A 71 4293–4297. [DOI] [PMC free article] [PubMed] [Google Scholar]
- Maines MD and Trakshel GM (1993) Purification and characterization of human biliverdin reductase. Arch Biochem Biophys 300 320–326. [DOI] [PubMed] [Google Scholar]
- Maines MD, Trakshel GM, and Kutty RK (1986) Characterization of two constitutive forms of rat liver microsomal heme oxygenase. Only one molecular species of the enzyme is inducible. J Biol Chem 261 411–419. [PubMed] [Google Scholar]
- Marohnic CC, Panda SP, Martásek P, and Masters BS (2006) Diminished FAD binding in the Y459H and V492E Antley-Bixler syndrome mutants of human cytochrome P450 reductase. J Biol Chem 281 35975–35982. [DOI] [PubMed] [Google Scholar]
- Martasek P, Solangi K, Goodman AI, Levere RD, Chernick RJ, and Abraham NG (1988) Properties of human kidney heme oxygenase: inhibition by synthetic heme analogues and metalloporphyrins. Biochem Biophys Res Commun 157 480–487. [DOI] [PubMed] [Google Scholar]
- Massey V (1994) Activation of molecular oxygen by flavins and flavoproteins. J Biol Chem 269 22459–22462. [PubMed] [Google Scholar]
- Nakajima H, Takemura T, Nakajima O, and Yamaoka K (1963) Studies of heme alpha-methenyl oxygenase. I. The enzymatic conversion of pyridine-hemichromogen and hemoglobin-haptoglobin into a possible precursor of biliverdin. J Biol Chem 238 3784–3796. [PubMed] [Google Scholar]
- Noguchi M, Yoshida T, and Kikuchi G (1983) A stoichiometric study of heme degradation catalyzed by the reconstituted heme oxygenase system with special consideration of the production of hydrogen peroxide during the reaction. J Biochem 93 1027–1036. [DOI] [PubMed] [Google Scholar]
- Otterbein LE, Bach FH, Alam J, Soares M, Tao Lu H, Wysk M, Davis RJ, Flavell RA, and Choi AM (2000) Carbon monoxide has anti-inflammatory effects involving the mitogen-activated protein kinase pathway. Nat Med 6 422–428. [DOI] [PubMed] [Google Scholar]
- Prough RA and Masters BS (1973) Studies on the NADPH oxidase reaction of NADPH-cytochrome C reductase. I. The role of superoxide anion. Ann N Y Acad Sci 212 89–93. [DOI] [PubMed] [Google Scholar]
- Ryter SW, Otterbein LE, Morse D, and Choi AM (2002) Heme oxygenase/carbon monoxide signaling pathways: regulation and functional significance. Mol Cell Biochem 234–235 249–263. [DOI] [PMC free article] [PubMed] [Google Scholar]
- Schacter BA, Nelson EB, Marver HS, and Masters BS (1972) Immunochemical evidence for an association of heme oxygenase with the microsomal electron transport system. J Biol Chem 247 3601–3607. [PubMed] [Google Scholar]
- Schenkman JB and Jansson I (2003) The many roles of cytochrome B5. Pharmacol Ther 97 139–152. [DOI] [PubMed] [Google Scholar]
- Stevens CF and Wang Y (1993) Reversal of long-term potentiation by inhibitors of haem oxygenase. Nature 364 147–149. [DOI] [PubMed] [Google Scholar]
- Stocker R, Yamamoto Y, McDonagh AF, Glazer AN, and Ames BN (1987) Bilirubin is an antioxidant of possible physiological importance. Science 235 1043–1046. [DOI] [PubMed] [Google Scholar]
- Strittmatter P, Spatz L, Corcoran D, Rogers MJ, Setlow B, and Redline R (1974) Purification and properties of rat liver microsomal stearyl coenzyme A desaturase. Proc Natl Acad Sci U S A 71 4565–4569. [DOI] [PMC free article] [PubMed] [Google Scholar]
- Tenhunen R, Marver HS, and Schmid R (1969) Microsomal heme oxygenase. Characterization of the enzyme. J Biol Chem 244 6388–6394. [PubMed] [Google Scholar]
- Tenhunen R, Marver HS, and Schmid R (1968) The enzymatic conversion of heme to bilirubin by microsomal heme oxygenase. Proc Natl Acad Sci U S A 61 748–755. [DOI] [PMC free article] [PubMed] [Google Scholar]
- Tenhunen R, Ross ME, Marver HS, and Schmid R (1970) Reduced nicotinamide-adenine dinucleotide phosphate dependent biliverdin reductase: partial purification and characterization. Biochemistry 9 298–303. [DOI] [PubMed] [Google Scholar]
- Verma A, Hirsch DJ, Glatt CE, Ronnett GV, and Snyder SH (1993) Carbon monoxide: a putative neural messenger. Science 259 381–384. [DOI] [PubMed] [Google Scholar]
- Vreman HJ and Stevenson DK (1988) Heme oxygenase activity as measured by carbon monoxide production. Anal Biochem 168 31–38. [DOI] [PubMed] [Google Scholar]
- Wang J and de Montellano PR (2003) The binding sites on human heme oxygenase-1 for cytochrome P450 reductase and biliverdin reductase. J Biol Chem 278 20069–20076. [DOI] [PubMed] [Google Scholar]
- Willis D, Moore AR, Frederick R, and Willoughby DA (1996) Heme oxygenase: a novel target for the modulation of the inflammatory response. Nat Med 2 87–90. [DOI] [PubMed] [Google Scholar]
- Yoshinaga T, Sassa S, and Kappas A (1982a) Purification and properties of bovine spleen heme oxygenase. Amino acid composition and sites of action of inhibitors of heme oxidation. J Biol Chem 257 7778–7785. [PubMed] [Google Scholar]
- Yoshinaga T, Sassa S, and Kappas A (1982b) The occurrence of molecular interactions among NADPH-cytochrome c reductase, heme oxygenase, and biliverdin reductase in heme degradation. J Biol Chem 257 7786–7793. [PubMed] [Google Scholar]


