Abstract
Proton beams used for radiotherapy will produce neutrons when interacting with matter. The purpose of this study was to quantify the equivalent dose to tissue due to secondary neutrons in pediatric and adult patients treated by proton therapy for brain lesions. Assessment of the equivalent dose to organs away from the target requires whole-body geometrical information. Furthermore, because patient geometry depends on age at exposure, age-dependent representations are also needed. We implemented age-dependent phantoms into our proton Monte Carlo dose calculation environment. We considered 8 typical radiation fields, 2 of which had been previously used to treat pediatric patients. The other 6 fields were additionally considered to allow a systematic study of equivalent doses as a function of field parameters. For all phantoms and all fields, we simulated organ specific equivalent neutron doses and analyzed for each organ (1) the equivalent dose due to neutrons as a function of distance to the target; (2) the equivalent dose due to neutrons as a function of patient age; (3) the equivalent dose due to neutrons as a function of field parameters; and (4) the ratio of contributions to secondary dose from the treatment head versus the contribution from the patient’s body tissues. This work reports organ specific equivalent neutron doses for up to 48 organs in a patient. We demonstrate quantitatively how organ equivalent doses for adult and pediatric patients vary as a function of patient’s age, organ, and field parameters. Neutron doses increase with increasing range and modulation width but decrease with field size (as defined by the aperture). We analyzed the ratio of neutron dose contributions from the patient and from the treatment head, and found that neutron equivalent doses fall off rapidly as a function of distance from the target, in agreement with experimental data. It appears that for the fields used in this study, the neutron dose lateral to the field is smaller than the reported scattered photon doses in a typical intensity modulated photon treatment. Most importantly, our study shows that neutron doses to specific organs depend considerably on the patient’s age and body stature. The younger the patient, the higher the dose deposited due to neutrons. Given the fact that the risk also increases with decreasing patient age, this factor needs to be taken into account when treating pediatric patients of very young ages and/or of small body size. The neutron dose from a course of proton therapy treatment (assuming 70 Gy in 30 fractions) could potentially (depending on patient’s age, organ, treatment site and area of CT scan) be equivalent to up to ∼30 CT scans.
1. Introduction
Due to early cancer detection and more successful treatments leading to greater life expectancy post treatment, the risk of radiation-induced secondary cancers is a growing concern in radiation oncology (Hall 2004). Radiation therapy causes dose to be deposited in different areas of the patient. There is prescribed dose to the target structures (e.g., the planning treatment volume), but also dose to surrounding structures (i.e. along the path of the primary beams and by scattered radiation to the rest of the body). Along the path of the irradiation field, one may have to accept a risk for second malignancies because of the therapeutic benefit of radiation therapy. However, the dose to areas not directly irradiated carries a risk that, in some cases, may not be justified. Of particular concern of such “out-of-field” exposures are pediatric patients because they have a long life expectancy after treatment and because their organs show a higher risk for developing second malignancies (BEIR 2006).
Due to its highly conformal dose distribution, proton therapy is advantageous in particular for pediatric tumors and in the head and neck region (Wilson et al 2005). However, it has been discussed whether the use of proton therapy (or intensity modulated photon therapy (IMRT)) could result in a higher incidence of radiation-associated second cancers compared with those from conventional (3D conformal photon) radiotherapy (Hall and Wuu 2003, Kry et al 2005, Hall 2006, Paganetti et al 2006).
As far as the dose outside the main radiation field is concerned, proton beams deposit secondary dose mostly via secondary neutrons. These neutrons are either generated in the patient, or in the treatment head from which they can potentially reach the patient. Neutron yield generated in the patient increases with beam range (i.e. the beam energy) and treatment volume. The neutron yield generated in the treatment head depends on various geometrical and physical parameters. Two treatment techniques, based on different principles, are commonly used for proton therapy: passive scattering and pencil-beam scanning (Blattmann 1992).
The first method needs various scatterers, beam-flattening devices, collimators, and energy modulation devices. Additionally, for each patient, individual apertures and compensators are required. Significant treatment head contributions are caused by the patient-specific aperture, primarily because passive scattered proton machines typically offer a limited set of different field sizes impinging on the final aperture, thus influencing the neutron yield due to its dependence on the ratio of field size and aperture opening (Gottschalk 2006, Paganetti et al 2006). The neutron dose caused by the treatment head decreases with increasing aperture size (opening) and air gap, because the brass collimator contributes significantly to the neutron dose. The treatment head is typically the dominant neutron source compared to the patient contribution (Jiang et al 2005). Scattered radiation in therapeutic proton beams using passive scattering has been studied by several investigators. Binns and Hough (Binns and Hough 1997) measured the secondary dose in a 200 MeV proton beam. Measurements were performed by Yan et al (2002) utilizing a 160 MeV proton beam with a passive scattering beam delivery system. The beam exiting the treatment head was almost entirely stopped in an aperture leading to neutron equivalent doses of 1–15 mSv/Gy (mSv/Gy denotes equivalent dose per treatment dose). Polf and Newhauser (Polf and Newhauser 2005) studied the secondary neutron dose for a passive scattering delivery system using Monte Carlo simulations and measurements. The neutron dose decreased from 6.3 to 0.63 mSv/Gy with increasing distances to isocenter from 50 to 150 cm and increased as the range modulation increased. Secondary dose was assessed using Monte Carlo techniques by Agosteo et al (1998) for a passive beam delivery system delivering a proton beam of 65 MeV. The absorbed dose due to neutrons was in the range 3.7×10⁻⁷ to 1.1×10⁻⁴ Gy per treatment Gy depending on the distance to the field. They also looked into a passive scattering beam delivery system to treat deep tumors. The computed secondary dose due to scattered photons and neutrons varied from 0.146 to 7.1×10⁻² mGy per treatment Gy for depths ranging from 1 to 8 cm with a distance to the field edge of 9 to 15 cm. Roy and Sandison (Roy and Sandison 2004) irradiated an anthropomorphic phantom and found that the scattered neutron equivalent dose varied between 0.1 and 0.26 mSv/Gy for the passive scattering system using a beam energy of 198 MeV. Subsequently, a systematic study on scattered neutron equivalent dose using anthropomorphic phantoms was performed (Mesoloras et al 2006). The neutron equivalent dose decreased with increasing aperture size and air gap demonstrating that the brass collimator contributes significantly to the neutron dose. In the study by Mesoloras et al (2006) neutron equivalent dose varied from 0.03 to 0.45 mSv/Gy for a small field snout and from 0.1 to 0.87 mSv/Gy for a large field snout. Tayama et al (2006) measured neutron equivalent doses up to 2 mSv/Gy outside of the primary radiation field in a 200 MeV proton beam. Measurements were also done using anthropomorphic phantoms and microdosimetric detectors (Wroe et al 2007). Equivalent doses from 3.9 to 0.18 mSv/Gy were measured when moving from 2.5 cm to 60 cm distance to the field edge.
The results obtained in these studies vary significantly (equivalent doses between 4×10⁻⁶ and 20 mSv per treatment Gy were reported). The reason is that neutron doses decrease rapidly with lateral distance from the proton field making it heavily dependent on the point of interest. Further, neutron production depends on the treatment facility (due to differences in the design of the scattering devices) and on the individual field settings (because the treatment head geometry and the beam energy are field dependent in proton therapy).
In beam scanning, a proton pencil beam is magnetically scanned over the target volume without the need for scattering, flattening, or compensating devices. (Schneider et al 2002). For a scanning system the neutron equivalent dose was measured to be between 2 and 5 mSv/Gy for target volumes of 211 (sacral chordoma) and 1253 cm3 (rhabdoyosarcoma), respectively, and 0.002 to 8 mSv/Gy for lateral distances of 100 to 7 cm from the treatment beam axis (Schneider et al 2002). Agosteo et al (1998) simulated a scanning system with a maximum energy of 200 MeV showing a secondary absorbed dose ranging from 1.5 to 5.0 mGy per treatment Gy for depths between 1 and 30 cm. Due to the use of fewer scattering devices, pencil-beam scanning produces a lower neutron background than passive scattering because the patient acts as the only neutron source. It is undisputed that scanned proton beams offer a lower secondary cancer risk than passive scattered protons or even photons (Miralbell et al 2002, Schneider et al 2002). However, most proton therapy installations currently in use still use passive scattered beam delivery.
Most of the experiments aimed at measuring dose as a function of distance to the field. This quantity is not helpful for epidemiological risk assessments that have to be based on organ specific equivalent dose estimations. Although measured data have to be considered the gold standard, simulations allow a more realistic consideration of patient specific geometry. Typically a patient geometry is obtained using computed tomography (sometimes in combination with other modalities, like positron emission tomography or magnetic resonance imaging) for treatment planning purposes. Because of the concern of excessive radiation with most imaging techniques, whole body scans are rarely available. Thus, to allow organ specific secondary radiation doses to patients to be assessed, whole-body computational phantoms of reference patients are needed. In order to study whole-body effective dose or absorbed and equivalent doses to specific areas (organs) in the human body, traditionally stylized phantoms have been used. These phantoms typically have only three media with distinct densities: bone, soft tissue, and lung. These are grouped to build three principal sections: an elliptical cylinder representing the arm, torso, and hips; a truncated elliptical cone representing the legs and feet; and an elliptical cylinder representing the head and neck. Extensive work has been done on organ doses from medical exposures using stylized models (Stovall et al 1989, Stovall et al 2004). Nevertheless, the concept has obvious shortcomings. Human anatomy is too complex to be realistically modeled with a limited set of surface equations. Calculated average organ and marrow doses based on such stylized models have not shown strong correlations with radiotoxicity (Lim et al 1997). Ron (1997) concluded that uncertainties based on stylized phantom calculations may be significant for dose estimations. Consequently voxel phantoms were introduced where each voxel is identified in terms of tissue type (soft tissue, hard bone, etc) and organ identification (lungs, skin, etc). Properties of different voxel phantoms are reviewed by Zaidi and Xu (2007). Lee et al (2006a) addressed the differences between the use of stylized phantoms and the use of voxelized phantoms derived directly from patient CT scans. It was found that the two types of phantoms involve differences of up to 150% in organ secondary absorbed dose due to the limitations of the anatomical description provided by the stylized phantoms.
In a previous study, we reported results for organ dose away from the targeted tumor in the whole-body voxelized VIP-Man model (Xu et al 2000) for proton therapy treatments (Jiang et al 2005). The present study is a continuation of our study on the adult VIP-Man phantom whereby we introduce the use of pediatric voxel phantoms. The aims of this study were to assess: (1) the organ equivalent dose due to secondary dose as a function of distance to the target; (2) the organ equivalent dose due to neutrons as a function of patient age; (3) organ equivalent dose due to neutrons as a function of field parameters; and (4) the ratio of contributions to secondary dose from the treatment head versus those from the patient. The present study purposely did not include a calculation of whole-body effective dose, the reason being that the ICRP tissue weighting factors are gender- and age-averaged. ICRP clearly stated (ICRP 2005) that the effective dose concept should not be used to indicate risk for specific individuals. Because the aim of this project was to provide data to allow organ specific risk assessments rather than radiation protection estimations, we focus on organ equivalent doses.
2. Methods and Materials
Whole-body computational phantoms
To simulate the anatomy of an adult patient we used the VIP-Man computational phantom (Xu et al 2000), which is based on anatomical color images of the Visible Human Project from the National Library of Medicine (Spitzer and Whitlock 1998). This phantom distinguishes adrenal glands, bladder, esophagus, gall bladder, stomach mucosa, heart muscle, kidneys, large intestine, liver, lungs, pancreas, prostate, skeletal components, skin, small intestine, spleen, stomach wall, testes, thymus, thyroid, gray matter, white matter, teeth, skull CSF, male breast, eye lenses, and red bone marrow (Spitzer and Whitlock 1998, Xu et al 2000). Average tissue compositions and densities are used to tag each voxel (ICRP 1975).
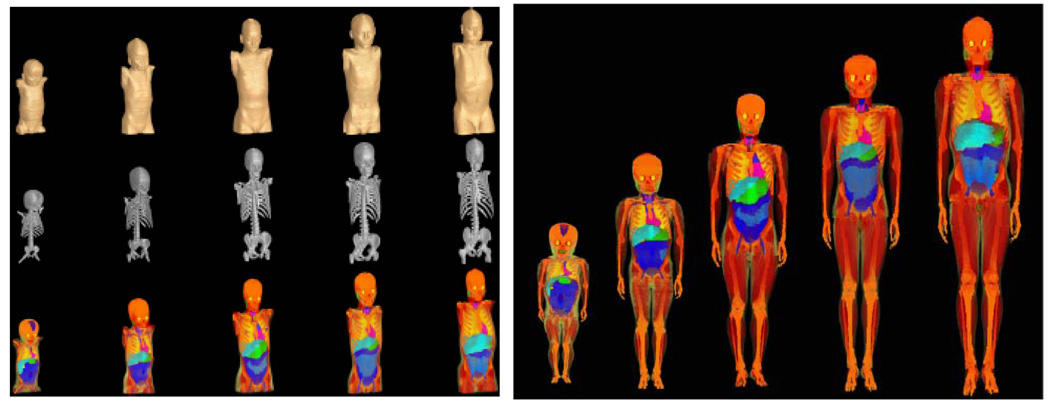
To simulate pediatric patient geometries, a series of tomographic computational phantoms of pediatric patients for use in medical dosimetry (UF Series A) has been developed at University of Florida (Lee and Bolch 2003, Lee et al 2005). Five phantoms of different ages were constructed from CT image data of live patients (Figure 1, left). For each organ and phantom, age- and gender-dependent densities as well as age-dependent material compositions were adopted based on ICRU (ICRU 1992). For those soft-tissue organs where no age-specific data were available, adult reference soft-tissue densities were used. For the lungs, effective densities were assigned so that the total phantom lung mass matches its interpolated reference mass (inclusive of pulmonary blood). Next, a set of whole-body voxel phantoms of pediatric patients were developed through the attachment of arms and legs (UF Series B; Figure 1, right) (Lee et al 2006b). Inclusion of the arms and legs is critical for dosimetry studies of pediatric patients due to the presence of active bone marrow within the extremities. Comprehensive adjustments were made to match ICRP age-interpolated reference body masses, body heights, sitting heights and internal organ masses. Thus, the phantoms do not only take into account changes in geometry as a function of age but also changes in organ specific material composition as a function of age based on individuals at the ICRP reference ages (ICRP 2003a).
Figure 1.
Left: UF series A of pediatric phantoms (exterior, skeletal system, internal organ structure). Image columns correspond to the 9-month male, the 4-year female, the 8-year female, the 11-year male, and the 14-year male, respectively. (Lee et al 2005) Right: UF Series B of pediatric phantoms (9-month male, 4-year female, 8-year female, 11-year male and 14-year male, from left to right). (Lee et al 2006b)
Implementation of the phantoms into the Monte Carlo dose calculation environment
A Monte Carlo dose calculation system is being used routinely at Massachusetts General Hospital to support treatment planning (Jiang and Paganetti 2004, Paganetti et al 2004, Jiang et al 2007). The code is based on the Geant4 Monte Carlo code (Agostinelli et al 2003). Within this system, the beam entering the treatment room was parameterized (in terms of beam energy, energy spread, angular spread and spot size) based on experimental data. Furthermore, a detailed model of the treatment head is implemented which allows consideration of any patient field specific setup variations via input parameters (Paganetti et al 2004). The treatment head incorporates an extensive number of different settings (combinations of scatterers, variable jaws, etc.). Within the treatment hardware control system, the prescribed range and modulation in the patient are translated into the corresponding settings of the treatment nozzle setup. The Monte Carlo code simulates apertures and compensators based on the files generated by the planning system for the milling machines. In the first step of the Monte Carlo dose calculation, particles are tracked through the treatment nozzle. The simulations generate phase space files recording the spatial, energy and angular information of the particles at the exit of the treatment nozzle (downstream surface of the range compensator). In the second step, the patient geometry is constructed, and dose calculations are conducted with source particles read from the phase space files.
For proton treatments with double-scattering system, range modulator and aperture, a significant number of secondary neutrons are generated in the treatment head in addition to the neutrons that are produced in the patient’s body. In order to assess the relative contribution of these two neutron sources to the patient secondary organ equivalent dose, we divided the phase space defining the primary particles into a proton component (‘proton phase space’) and a neutron component (‘neutron phase space’), each of which was separately simulated to ‘treat’ the six virtual patients. In the context of the study, internal neutrons included the neutrons produced in the patient via interactions of primary protons with tissue, and the later generations of neutrons originated from them. In contrast, external neutrons were defined as those generated in the treatment nozzle and also the next generations of neutrons generated by them in the patient.
The proton and neutron phase spaces of each field were calculated by transporting 40 million protons through the nozzle. In order to deliver absolute doses, the proton phase spaces were used to ‘treat’ a uniform water volume (a cube of 30 cm side) and the dose deposited in a 1-cm-diameter sphere located at the center of the spread-out Bragg peak (SOBP) of each field was considered as the target dose delivered by the field. All subsequently simulated secondary doses to the voxel phantoms were normalized to this value.
In order to model patient anatomy, the capability of using CT data or other voxelized geometry information is implemented into our Monte Carlo system (Jiang and Paganetti 2004, Jiang et al 2007). A software link of the Monte Carlo dose engine to the patient database and the commercial planning system is established which allows transfer of patient data, treatment plan parameters and machine setup. Treatment information, like prescribed dose per field, size of the air gap, couch angle and gantry angle, is read from the patient database.
The phantoms were implemented in the system as “virtual patients”. The materials of the phantom tissues/organs were defined by their age-dependent density and elemental composition. The patient geometry was subsequently reconstructed as a set of voxels, each voxel corresponding to a given material. The resolution and number of voxels in the simulations are given in Table 1 along the lateral (x), anteroposterior (y) and craniocaudal (z) directions.
Table 1.
Number and dimension of voxels in the reconstruction of the phantoms.
| phantom | number of voxels | voxel dimensions (mm) | ||||
|---|---|---|---|---|---|---|
| x | y | z | x | y | z | |
| 9 month old | 289 | 180 | 241 | 0.9 | 0.9 | 3 |
| 4 year old | 351 | 207 | 211 | 0.9 | 0.9 | 5 |
| 8 year old | 322 | 171 | 220 | 1.1 | 1.1 | 6 |
| 11 year old | 398 | 242 | 252 | 0.9 | 0.9 | 6 |
| 14 year old | 349 | 193 | 252 | 1.2 | 1.2 | 7 |
| Adult (VIP- Man) | 147 | 86 | 470 | 4 | 4 | 4 |
The setup of each phantom position was based on all field parameters, including gantry angle, couch angle, isocenter, and air gap. For all fields, we assumed that the air gap was 2 cm. The remaining parameters were extracted from the treatment plan except for the field position. The phantoms were placed in the reference frame of the simulation so that the field would be centered to the median projection of the brain.
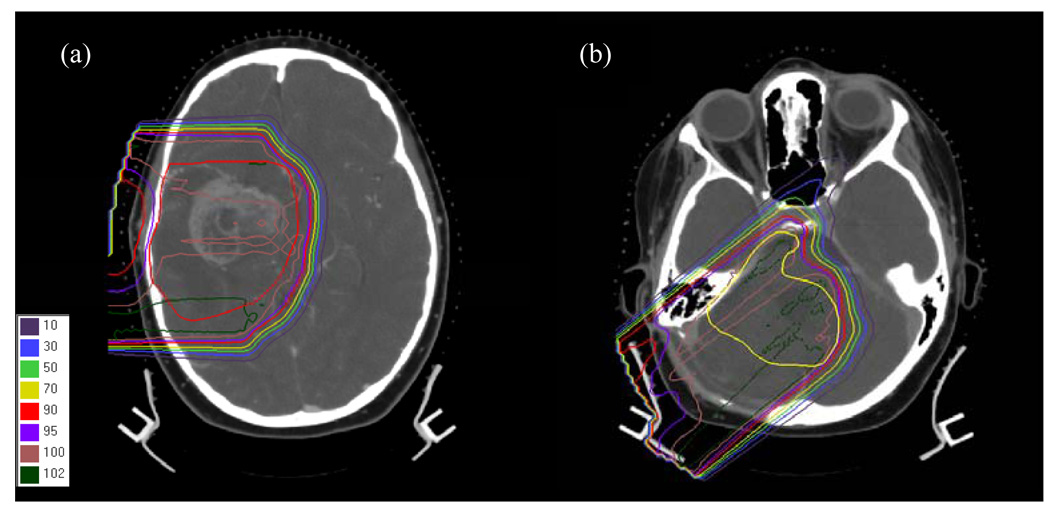
We considered eight proton fields of varying size and range/modulation combinations for the treatment of tumors in the intracranial region. Of these fields, two were previously used to treat pediatric patients at the F. H. Burr Proton Therapy Center at Massachusetts General Hospital. The first patient was a 9-year-old female who was diagnosed with a massive tumor in the temporal lobe, as shown in Figure 2 (a). The second field was used to treat a female patient of the same age for a brain lesion as shown in Figure 2 (b). The other six fields were circular and were defined in order to systematically evaluate the effect of field size, range and modulation on the calculated secondary organ equivalent dose. A summary of field diameters, ranges and modulation widths in water is given in Table 2.
Figure 2.
Plans and target delineations for the fields of (a) patient 1 and (b) patient 2. The target volumes are shown by the red and yellow contour, respectively.
Table 2.
Aperture diameter, field diameter (upstream of the aperture), beam energy, range and modulation widths (for a spread-out Bragg peak), and gantry angle for the considered fields.
| Patient | Field | Aperture Diameter [cm] | Field Diameter [cm] | Beam energy at nozzle entrance [MeV] | SOBP Range [cm] | SOBP Modulation width [cm] | Gantry Angle [deg] |
|---|---|---|---|---|---|---|---|
| 1 | 3 | 12 | 169.2 | 10 | 5 | 90 | |
| 2 | 6 | 12 | 169.2 | 10 | 5 | 90 | |
| 3 | 9 | 12 | 169.2 | 10 | 5 | 90 | |
| 4 | 3 | 12 | 178.3 | 15 | 10 | 90 | |
| 5 | 6 | 12 | 178.3 | 15 | 10 | 90 | |
| 6 | 9 | 12 | 178.3 | 15 | 10 | 90 | |
| 1 | 7 | approx. 9.1 | 12 | 164.0 | 9.2 | 7.9 | 90 |
| 2 | 8 | approx. 6.4 | 12 | 180.1 | 11.8 | 9.5 | 130 |
Consideration of organs
Table 3–Table 5 list the segmented phantom organs for which secondary (absorbed and equivalent) organ doses and neutron fluences were calculated. Organs directly irradiated by the field were not considered in the secondary dose calculations. These were brain, cranium, muscle, adipose and skin for all phantoms, and, in addition, articulations, red bone marrow and bones (other than mandible and spine) for the adult phantom. The anatomical systems of the adult phantom (respiratory, endocrine, digestive, urinary, reproductive, nervous and circulatory system) were also not analyzed. The organs in Table 3–Table 5 are given in increasing distance from the target (the spinal cord and the aorta of the pediatric phantoms were distance-ordered between the gall bladder and the adrenals on average to account for their extent. For the same reason, the esophagus was listed between the lungs and the heart).
Table 3.
Organ indices for the UF female phantoms.
| organ index | organ/tissue | organ index | organ/tissue | organ index | organ/tissue |
|---|---|---|---|---|---|
| 1 | eyes | 17 | spleen | 33 | scapulae |
| 2 | tonsil | 18 | gall bladder wall | 34 | sternum |
| 3 | salivary glands | 19 | spinal cord | 35 | upper humerus |
| 4 | tongue | 20 | aorta | 36 | ribs |
| 5 | pharynx | 21 | adrenals | 37 | t-vertebrae |
| 6 | larynx | 22 | pancreas | 38 | lower humerus |
| 7 | trachea | 23 | kidneys | 39 | l-vertebrae |
| 8 | thyroid | 24 | small intestine wall | 40 | radii, ulnae |
| 9 | thymus | 25 | colon wall | 41 | os coxae |
| 10 | bronchi | 26 | ovaries | 42 | sacrum |
| 11 | breast | 27 | uterus | 43 | Hand |
| 12 | lungs | 28 | bladder wall | 44 | Upper femur |
| 13 | esophagus | 29 | rectosigmoid wall | 45 | Lower femur |
| 14 | heart | 30 | mandible | 46 | Tibiae, patellae |
| 15 | liver | 31 | c-vertebrae | 47 | Fibula |
| 16 | stomach wall | 32 | clavicles | 48 | ankle, feet |
Table 5.
Organ indices for the VIP phantom.
| organ index | organ/tissue | organ index | organ/tissue |
|---|---|---|---|
| 1 | eyes | 13 | pancreas |
| 2 | thyroid | 14 | kidneys |
| 3 | thymus | 15 | upper large intestine |
| 4 | male breasts | 16 | small intestine |
| 5 | lungs | 17 | lower large intestine |
| 6 | esophagus | 18 | bladder |
| 7 | heart | 19 | prostate |
| 8 | liver | 20 | rectum |
| 9 | stomach wall | 21 | testes |
| 10 | spleen | 22 | mandible |
| 11 | gall bladder | 23 | spine |
| 12 | adrenal |
In the pediatric phantoms, organ indices 1 to 8 correspond to the head-and-neck region, indices 9 to 14 (female) or 13 (male) refer to the thorax while the abdomen organ indices are in the interval 15 to 29 (female) or 14 to 28 (male). The skeletal structures follow with indices 30 to 48 (female) or 29 to 47 (male). The corresponding indices for head-and-neck, thorax, abdomen, and skeleton in the adult phantom, are 1–2, 3–7, 8–21 and 22–23, respectively. In certain cases, the organ components were segmented in the geometry. The overall organ equivalent doses were then calculated as the average of the component doses. A list of the organs for which the equivalent dose was averaged and their components are given in Table 6. As the table shows, the doses for lungs, adrenals, kidneys and colon wall were also averaged bilaterally in the pediatric phantoms.
Table 6.
Dose averaged organs and their components.
| UF phantoms | VIP phantom | ||
|---|---|---|---|
| Organ | organ components | organ | organ components |
| eyes | lenses | eyes | lenses |
| eyes without lens | eyes without lens | ||
| lungs | left lung | esophagus | esophagus mucous |
| right lung | esophagus wall | ||
| heart | heart | stomach | stomach wall |
| heart content | stomach mucous | ||
| adrenals | left adrenal | ||
| right adrenal | |||
| kidneys | left kidney cortex | ||
| right kidney cortex | |||
| left pelvis kidney | |||
| right pelvis kidney | |||
| left medullar | |||
| right medullar | |||
| colon wall | right colon wall | ||
| left colon wall | |||
Radiation quality factors
The relative biological effectiveness (RBE) is typically defined relative to 60Co for a specific level of effect (e.g., surviving fraction or mutation yield). A quality factor is the maximum RBE, i.e. the RBE for low doses and is typically defined conservatively, e.g. by ICRP (1991). To calculate the organ equivalent dose, the contributions from different particles have to be added with the appropriate radiation quality factors.
The organ equivalent dose, HR,T, due to energy deposited by particles of type R in an organ T is given as
| (1) |
where DR,T is the absorbed dose deposited in organ T by particles of type R and radiation factor wR.
For this work, the selection of radiation factors was done as follows.
For energy depositions by secondary protons generated by proton events, the value of wR was decided given the energy, Ep, of the incoming proton based on experimental data (Paganetti et al 2002):
| (2) |
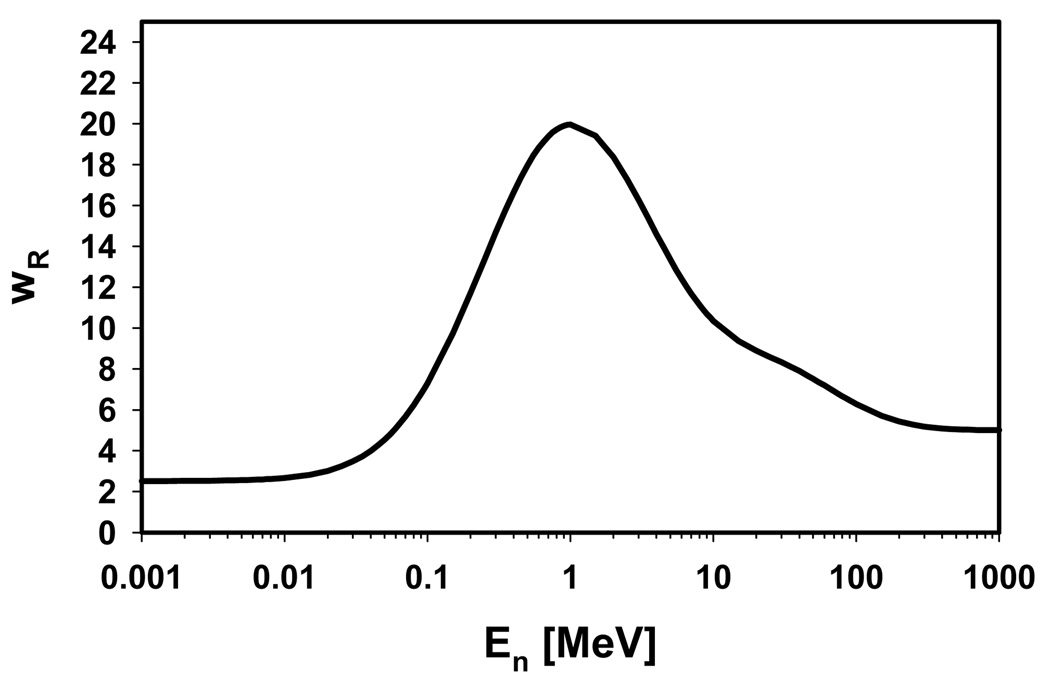
For depositions by electrons from protons, the value of 1.1 was used for the radiation weighting factor irrespective of electron energy. For dose deposited by protons or electrons generated directly or indirectly by neutrons, we followed the quality factor recommendation of the ICRP. The dose deposition was weighted by the radiation factor of the parent neutron, which was calculated from the energy of the neutron (at the interaction vertex of the neutron). Previously, the ICRP recommended a step function to parameterize energy dependent neutron quality factors (ICRP 1991), but a change in this recommendation, moving to a continuous energy dependence, has been recently established (Figure 3) (ICRP 2003b). We used the most recent definition. For all other particle types (e.g., alpha particles), the average organ absorbed dose was scaled by a mean neutron radiation weighting factor, which was calculated by weighing the fluence distribution of the neutrons entering the organ with the 2007 ICRP definition of the neutron radiation factor (outside of the main radiation field it is pretty much guaranteed that these secondary particles belong to neutron chains).
Figure 3.
ICRP definitions for the neutron radiation factor (ICRP 2003b).
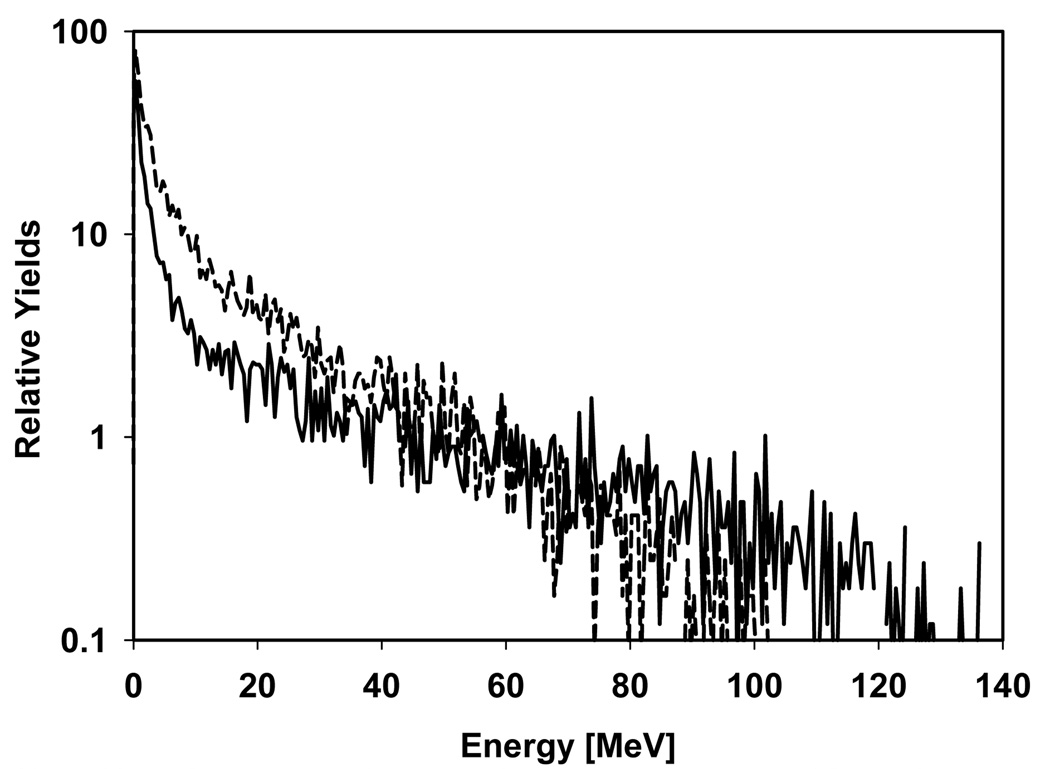
Figure 4 shows two neutron energy distributions (one for internal and one for external neutrons, normalized to the same yield) at the patient’s tongue for the 14 year old phantom and field 5 to illustrate the overall energy range and the difference between externally and internally generated neutrons. Neutrons from the treatment head have obviously a higher maximum energy than the ones generated in the patient.
Figure 4.
Neutron energy distributions at the patient’s tongue (for the 14 year old phantom and field 5 as an example) from external neutrons (solid line) and internal neutrons (dashed line). The two curves are normalized to the same yield.
Equivalent doses
During particle tracking in the Monte Carlo calculations, the energy depositions were classified by the particle type (protons, electrons or other). If the energy was deposited by a proton or an electron, it was further distinguished by particle origin (proton chains or neutron chains). The chain type was defined as follows. For each particle in the event, the creation and reaction vertices were stored to provide access to the history of the event. For dose depositions by protons or electrons, the history of the event was used to search for a neutron in the ancestors of the dose depositing particle. If a neutron was found, the particle was considered to belong in a neutron chain, otherwise it was classified as part of a proton chain. In the case of neutron chains, the neutron that was created latest in the simulation was considered to be the ‘neutron parent’ of the specific particle. The neutron quality factor was then assigned accordingly. Lastly, if the absorbed dose was deposited by a proton in a proton chain, the dose depositions were classified further into three groups depending on particle energy in order to apply the quality factors given in eq. (2). The organ equivalent dose was calculated for each individual dose deposition. The classification of dose depositions by particle types, particle chains and particle energies was used in order to select the appropriate radiation factor on a step-by-step basis in the simulation. Thus, the organ equivalent doses were accumulated according to the following expression:
| (3) |
where Dppi are the organ absorbed doses in the proton energy intervals mentioned above (eq. (2)), Hpnw are the step-by-step wR-weighted energy depositions by protons originating from neutrons, Dep are the organ absorbed doses from electrons originating from protons, Henware the step-by-step wR-weighted energy depositions by electrons originating from neutrons, Dother are the organ absorbed doses from particles other than protons or electrons and wR are the average calculated neutron radiation factors per organ.
Further, we distinguish between Htot Hp, and Hn, referring to the total organ equivalent dose, the organ equivalent dose from protons entering the patient (based on the proton phase space), and the organ equivalent dose from neutrons entering the patient (based on the neutron phase space), respectively. Thus, Hp refers to internal neutrons whereas Hn refers to external neutrons.
Monte Carlo setup
All simulations were performed with the 8.1.p01 version of the Geant4 toolkit (Agostinelli et al 2003). This particular code was chosen because of an already existing Geant4 based proton dose calculation engine at MGH and because Geant4, being a toolkit, offers great flexibility for implementing computational phantoms and for scoring equivalent doses in the way described above. We did benchmark our settings for hadronic physics against experimental results. The data analysis and the explicit physics settings for which we found excellent agreement with measured data is described elsewhere (Zacharatou Jarlskog and Paganetti 2007).
3. Results and Discussion
Age and organ specific doses
Equivalent doses were analyzed for all phantoms, all organs and all patient fields. The maximum neutron equivalent dose delivered to an organ is about 10 mSv per treatment Gy. Overall, the organ equivalent neutron dose for a particular treatment field depends on patient’s age, organ, and field parameters. The variation among different organs is substantial due to the significant decrease in neutron dose when moving away from the target.
Not all data for the 8 fields and 8 phantoms with up to 48 organs can be presented here. In order to give an overall impression about the organ doses, the difference between treatment head and patient generated dose and the uncertainties in the data we only present in Table 7 the two fields that were used clinically (fields 7 and 8). Because the two patients were 9 years old we show the doses for the 8 year old phantom (closest match).
Table 7.
Equivalent doses in mSv/Gy for all organs and for two fields for the 8-year old. Hp: caused by the patient; Hn: caused by the treatment head; Htot: total; ΔHtot=δHtot/Htot: statistical error in %.
| Field 7 | Field 8 | |||||||
|---|---|---|---|---|---|---|---|---|
| Organ | Hp | Hn | Htot | ΔHtot | Hp | Hn | Htot | ΔHtot |
| eyes | 8.5E−01 | 1.6E+00 | 2.5E+00 | 8.3 | 6.0E−01 | 2.3E+00 | 2.9E+00 | 13.8 |
| tonsil | 4.7E−01 | 1.4E+00 | 1.8E+00 | 14.0 | 4.3E−01 | 2.3E+00 | 2.7E+00 | 11.2 |
| salivary glands | 6.7E−01 | 1.6E+00 | 2.3E+00 | 3.2 | 3.9E−01 | 2.0E+00 | 2.4E+00 | 3.5 |
| tongue | 4.3E−01 | 1.5E+00 | 1.9E+00 | 4.2 | 3.5E−01 | 1.6E+00 | 1.9E+00 | 4.7 |
| pharynx | 8.1E−01 | 1.6E+00 | 2.4E+00 | 8.6 | 5.6E−01 | 2.7E+00 | 3.2E+00 | 10.6 |
| larynx | 2.8E−01 | 1.6E+00 | 1.9E+00 | 6.5 | 2.3E−01 | 2.4E+00 | 2.7E+00 | 6.2 |
| trachea | 1.4E−01 | 9.5E−01 | 1.1E+00 | 13.8 | 8.6E−02 | 2.1E+00 | 2.2E+00 | 10.8 |
| thyroid | 1.6E−01 | 1.6E+00 | 1.8E+00 | 9.7 | 1.3E−01 | 2.0E+00 | 2.1E+00 | 9.5 |
| thymus | 5.9E−02 | 8.0E−01 | 8.5E−01 | 6.0 | 4.6E−02 | 1.1E+00 | 1.1E+00 | 5.8 |
| bronchi | 6.3E−02 | 7.6E−01 | 8.2E−01 | 14.9 | 4.4E−02 | 6.4E−01 | 6.9E−01 | 20.1 |
| breast | 5.8E−02 | 5.4E−01 | 6.0E−01 | 25.2 | 3.5E−02 | 2.5E−01 | 2.9E−01 | 54.5 |
| lungs | 5.3E−02 | 4.5E−01 | 5.1E−01 | 2.1 | 3.9E−02 | 8.1E−01 | 8.4E−01 | 1.8 |
| esophagus | 9.4E−02 | 8.9E−01 | 9.9E−01 | 8.4 | 7.9E−02 | 1.3E+00 | 1.4E+00 | 8.3 |
| heart | 3.8E−02 | 2.6E−01 | 3.0E−01 | 3.5 | 2.9E−02 | 5.1E−01 | 5.4E−01 | 3.0 |
| liver | 2.1E−02 | 1.0E−01 | 1.2E−01 | 3.5 | 1.6E−02 | 2.0E−01 | 2.1E−01 | 3.1 |
| stomach wall | 1.7E−02 | 3.4E−02 | 5.1E−02 | 11.6 | 1.8E−02 | 1.8E−01 | 2.0E−01 | 9.1 |
| spleen | 1.8E−02 | 3.5E−02 | 5.3E−02 | 11.4 | 1.8E−02 | 5.9E−02 | 7.7E−02 | 13.4 |
| gall bladder wall | 6.1E−03 | 5.3E−02 | 5.9E−02 | 50.9 | 4.4E−03 | 1.6E−01 | 1.7E−01 | 32.7 |
| spinal cord | 1.4E−01 | 5.7E−01 | 7.1E−01 | 4.2 | 8.4E−02 | 9.2E−01 | 1.0E+00 | 4.1 |
| aorta | 1.6E−02 | 1.1E−01 | 1.2E−01 | 10.0 | 9.1E−03 | 1.3E−01 | 1.4E−01 | 10.6 |
| adrenals | 2.3E−02 | 3.5E−02 | 5.8E−02 | 36.6 | 1.8E−02 | 5.0E−02 | 6.8E−02 | 30.9 |
| pancreas | 1.3E−02 | 6.7E−02 | 8.0E−02 | 15.9 | 1.1E−02 | 5.9E−02 | 7.0E−02 | 18.9 |
| kidneys | 1.8E−02 | 1.9E−02 | 3.7E−02 | 8.8 | 1.2E−02 | 6.7E−02 | 7.9E−02 | 12.6 |
| small intestine wall | 8.5E−03 | 2.0E−02 | 2.9E−02 | 8.9 | 8.4E−03 | 3.1E−02 | 3.9E−02 | 9.7 |
| colon wall | 9.2E−03 | 1.2E−02 | 2.1E−02 | 13.1 | 9.0E−03 | 4.3E−02 | 5.2E−02 | 12.9 |
| ovaries | 1.2E−03 | 3.7E−04 | 1.5E−03 | 15.0 | 1.1E−03 | 0.0E+00 | 1.1E−03 | 13.0 |
| uterus | 3.5E−04 | 6.0E−04 | 9.5E−04 | 20.8 | 4.7E−04 | 1.7E−04 | 6.4E−04 | 22.2 |
| bladder wall | 2.8E−03 | 1.9E−04 | 3.0E−03 | 42.5 | 1.2E−03 | 4.4E−04 | 1.6E−03 | 13.0 |
| rectosigmoid wall | 6.4E−03 | 3.9E−04 | 6.8E−03 | 15.6 | 3.8E−03 | 1.7E−02 | 2.1E−02 | 40.6 |
| mandible | 1.2E+00 | 9.6E−01 | 2.1E+00 | 2.7 | 3.0E−01 | 1.2E+00 | 1.5E+00 | 4.1 |
| c-vertebrae | 1.3E+00 | 1.4E+00 | 2.7E+00 | 2.1 | 5.3E−01 | 2.0E+00 | 2.6E+00 | 2.6 |
| clavicles | 1.0E−01 | 7.1E−01 | 8.1E−01 | 7.3 | 8.2E−02 | 1.1E+00 | 1.1E+00 | 6.8 |
| scapulae | 6.8E−02 | 5.2E−01 | 5.9E−01 | 4.6 | 5.8E−02 | 1.6E+00 | 1.7E+00 | 3.4 |
| sternum | 5.7E−02 | 5.3E−01 | 5.9E−01 | 8.8 | 8.8E−02 | 7.2E−01 | 8.0E−01 | 8.7 |
| upper humerus | 5.0E−02 | 1.7E−01 | 2.2E−01 | 6.1 | 4.3E−02 | 1.2E+00 | 1.2E+00 | 3.7 |
| ribs | 3.9E−02 | 3.5E−01 | 3.9E−01 | 3.2 | 2.9E−02 | 6.0E−01 | 6.3E−01 | 2.9 |
| t-vertebrae | 5.3E−02 | 4.6E−01 | 5.2E−01 | 3.3 | 4.0E−02 | 7.9E−01 | 8.3E−01 | 2.9 |
| lower humerus | 1.4E−02 | 5.4E−02 | 6.7E−02 | 12.8 | 1.2E−02 | 1.5E−01 | 1.6E−01 | 9.2 |
| l-vertebrae | 1.1E−02 | 3.3E−02 | 4.4E−02 | 12.2 | 5.8E−03 | 3.5E−02 | 4.1E−02 | 13.5 |
| radii, ulnae | 3.7E−03 | 1.1E−02 | 1.4E−02 | 23.3 | 2.1E−03 | 2.9E−02 | 3.1E−02 | 23.9 |
| os coxae | 2.5E−03 | 4.5E−03 | 7.0E−03 | 16.5 | 2.1E−03 | 3.7E−03 | 5.8E−03 | 18.1 |
| sacrum | 3.3E−03 | 1.8E−03 | 5.1E−03 | 14.9 | 2.6E−03 | 6.8E−03 | 9.4E−03 | 17.3 |
| hand | 2.3E−03 | 1.1E−02 | 1.3E−02 | 20.0 | 1.2E−03 | 1.5E−03 | 2.7E−03 | 16.2 |
| upper femur | 1.2E−03 | 5.0E−03 | 6.3E−03 | 23.2 | 1.5E−03 | 4.2E−03 | 5.6E−03 | 32.1 |
| lower femur | 1.1E−04 | 0.0E+00 | 1.1E−04 | 4.9 | 5.2E−04 | 3.2E−04 | 8.4E−04 | 20.1 |
| tibiae, patellae | 3.6E−04 | 3.2E−04 | 6.8E−04 | 7.5 | 2.1E−04 | 7.6E−04 | 9.7E−04 | 72.6 |
| fibula | 4.0E−04 | 0.0E+00 | 4.0E−04 | 15.5 | 2.0E−06 | 1.3E−05 | 1.5E−05 | 88.2 |
| ankle, feet | 6.7E−05 | 9.5E−05 | 1.6E−04 | 70.3 | 1.5E−05 | 0.0E+00 | 1.5E−05 | 15.4 |
The statistical uncertainty of the simulated organ equivalent doses depends on the organ mass and volume, i.e. on the number of incident particles in each voxel leading to dose deposition. The latter varies strongly with distance from the target. In general, organs closer to the target have a lower statistical error. For example, the relative error (one standard deviation) for the thymus dose is about 4% for the 9-month-old phantom while the relative error for the lung and liver dose is about 2–3%. The error for the stomach dose is on the other hand around 7–8%. Organs further from the target have significantly higher uncertainties, e.g. 35% for bladder.
Doses as a function of field parameters
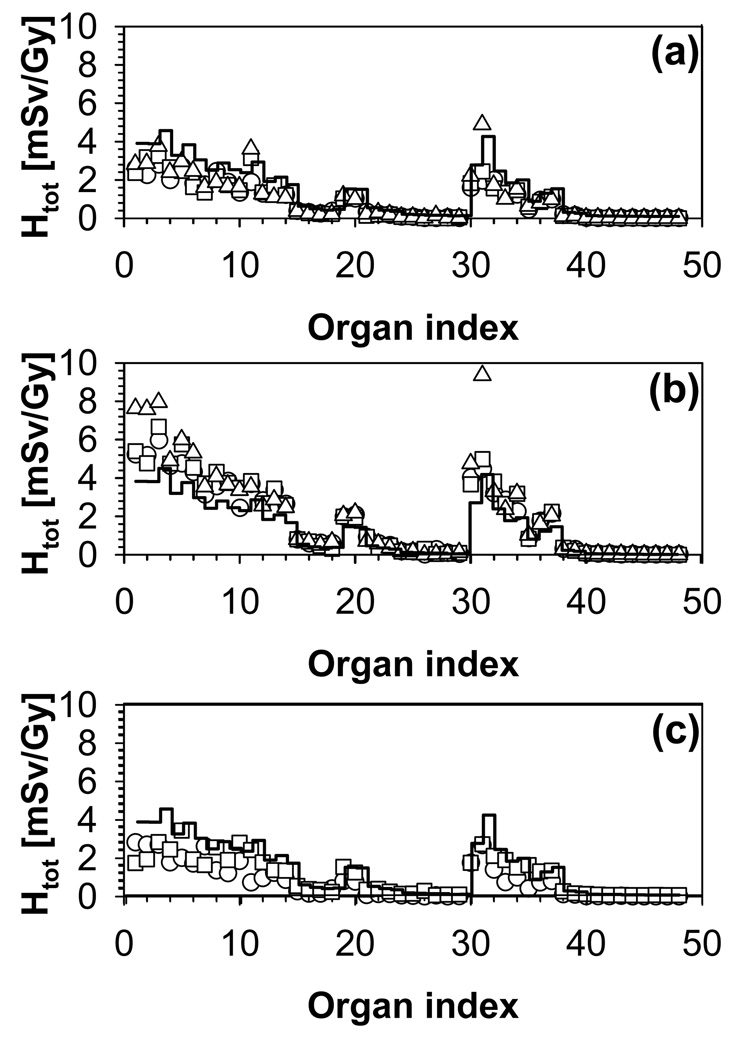
Figure 5 shows the organ equivalent dose in the 4-year-old phantom for the eight fields as a function of organ index. For example, the 4-year-old phantom will receive about 1.3 mSv/Gy in the lungs for the low-range fields (fields 1–3) and about 2.7 mSv/Gy for the high-range fields (fields 4–6). The corresponding values for the kidneys would be about 0.2 mSv/Gy and 0.5 mSv/Gy. Thus, for bigger treatment volumes that are deeper in the patient, significantly higher neutron doses are observed. The reason is twofold. First, to reach deeper targets in the body (larger range), higher proton beam energies are needed. Second, to treat a larger volume (larger modulation width), higher proton fluence is needed in order to cover the entire target with the prescribed dose.
Figure 5.
Organ equivalent dose as a function of organ index for the 4-year-old phantom. (a) Fields 1 (circles), 2 (squares) and 3 (triangles). (b) Fields 4 (circles), 5 (squares) and 6 (triangles). (c) Fields 7(circles) and 8 (squares). The average doses over all fields are given by the histogram.
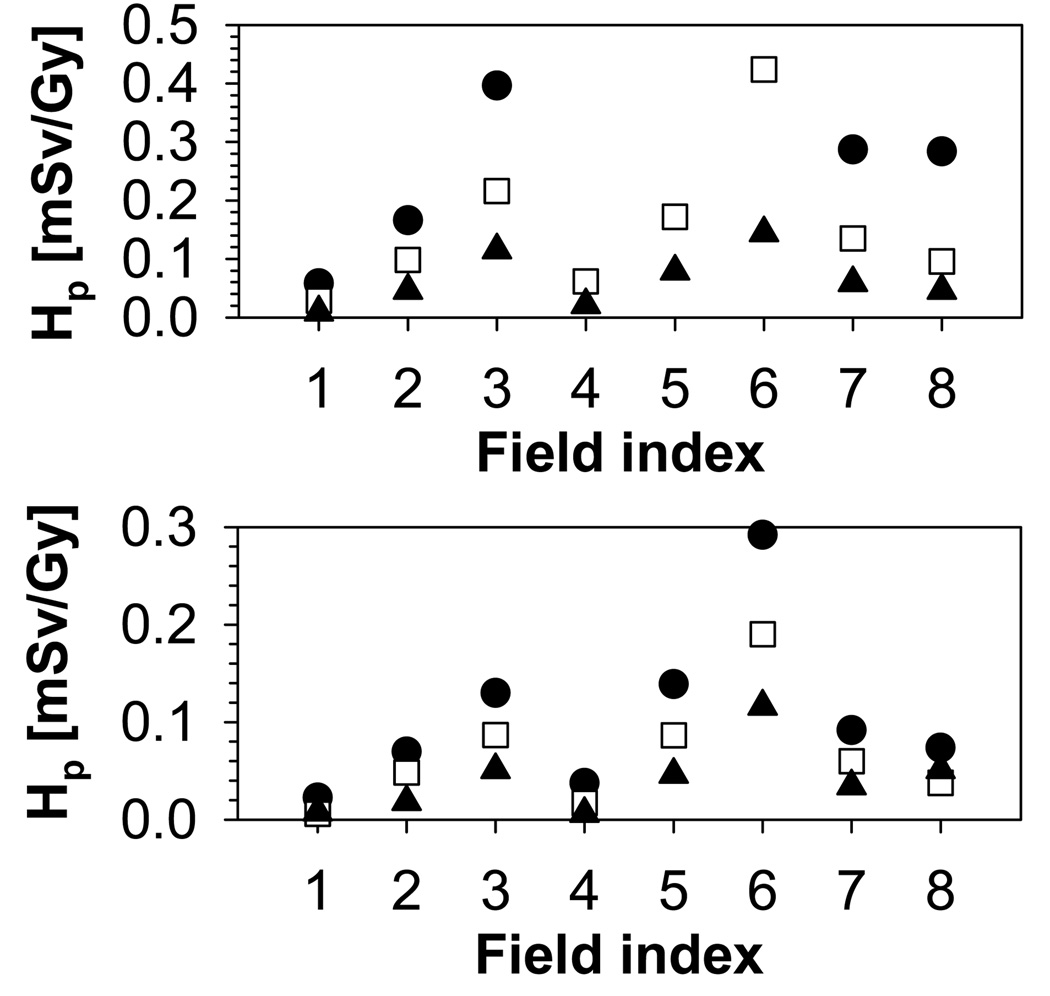
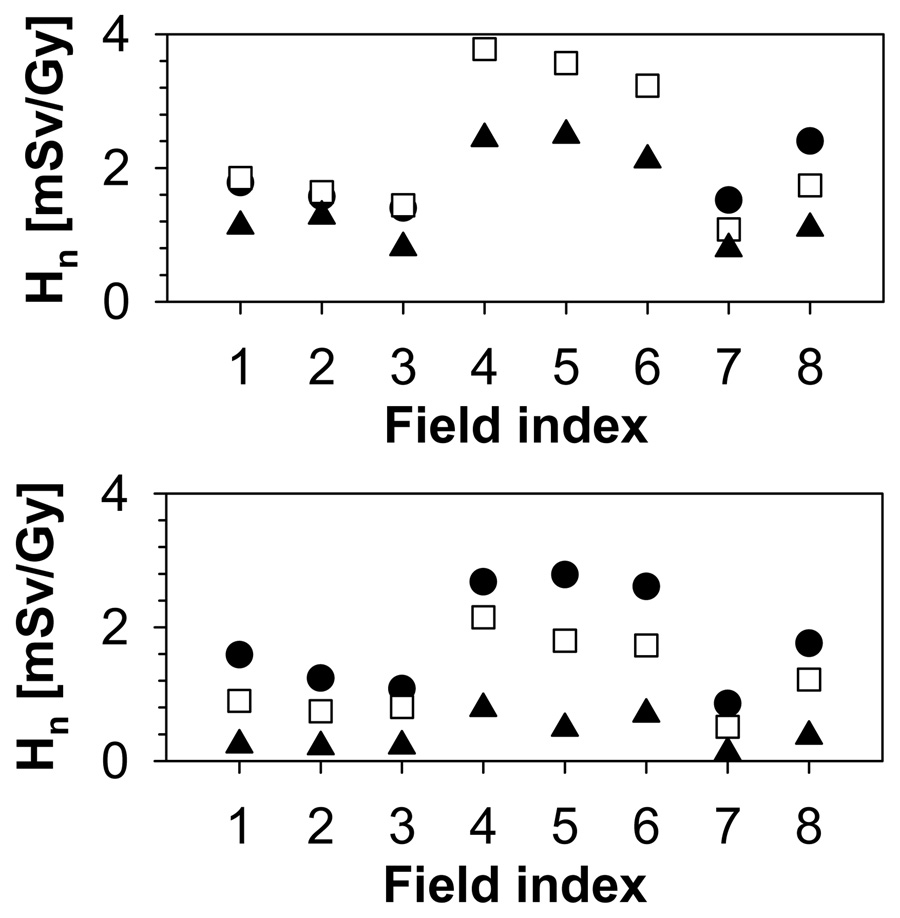
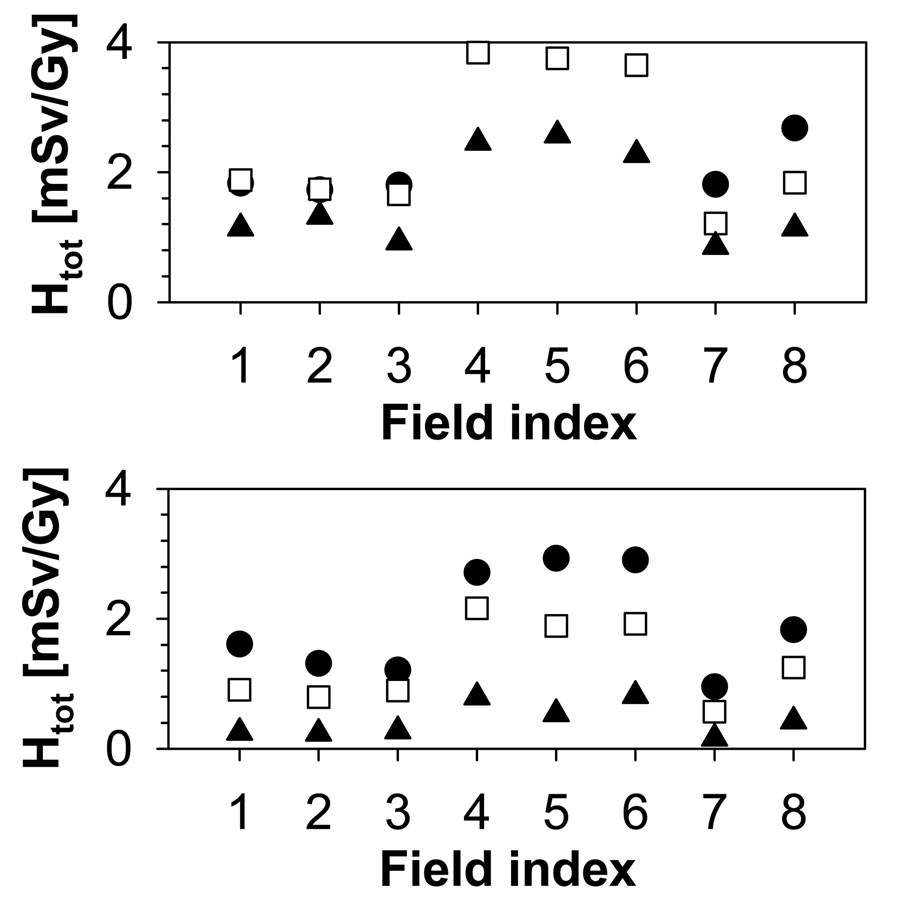
The increase in range/modulation width from 10cm/5cm to 15cm/10cm causes an increase in total dose to the thymus by a factor of 2. In addition to range and modulation width, the aperture opening influences the equivalent neutron dose. For typical treatment fields, external neutrons will dominate the neutron yield. The internal neutron dose scales roughly with the treatment volume. In contrast, for the external neutrons, there is an additional component with a decreasing neutron yield with increasing field size due to the blocking aperture. The contribution of external and internal neutrons to the total organ equivalent dose is illustrated in Figure 6 on the example of the thymus, which shows the internal dose as a function of field number for all phantoms. The dose increases with field size and modulation width. The trend is stronger for the younger phantoms. Irrespective of the phantom age, the field size has a marked effect on the internal dose, which, for example, increases by a factor 8 from field 1 to field 3 for the 9-month-old phantom. The field size dependence of the external neutron equivalent dose is not as pronounced as for the internal neutron equivalent dose, neither in absolute values, nor in its age dependence, as shown in Figure 7. The overall effect of the relative external/internal neutron contributions to the total dose and their respective field size dependences basically follows the same trend as the external dose with a slight moderation caused by the internal component (in particular for the younger phantoms (9-month, 4-year and 8-year)) as illustrated in Figure 8.
Figure 6.
Internal neutron equivalent dose for the thymus. Upper: 9-month old (circles), 4-year old (squares), 8-year old (triangles); Lower: 11-year old (circles), 14-year old (squares), adult (triangles).
Figure 7.
External neutron equivalent dose for the thymus. Upper: 9-month old (circles), 4-year old (squares), 8-year old (triangles); Lower: 11-year old (circles), 14-year old (squares), adult (triangles).
Figure 8.
Total equivalent dose for the thymus. Upper: 9-month old (circles), 4-year old (squares), 8-year old (triangles); Lower: 11-year old (circles), 14-year old (squares), adult (triangles).
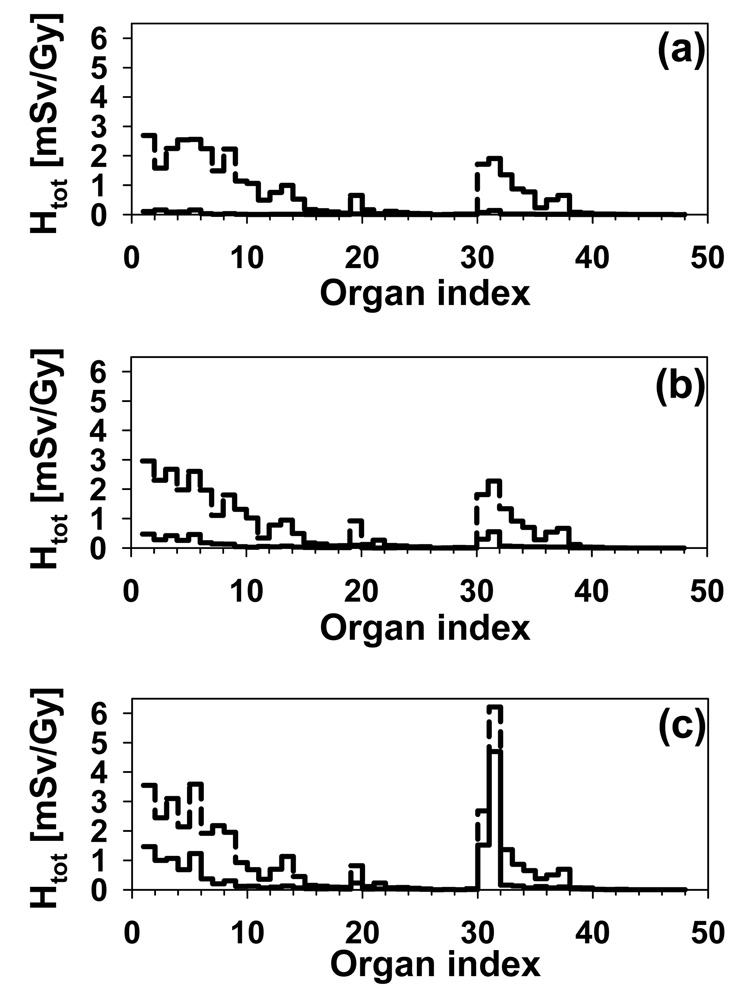
Figure 9 shows the total organ equivalent dose and the internal component for the three low-range fields in the case of the 8-year-old phantom. For the 3-cm diameter field, almost all the dose is due to external neutrons (Figure 9 (a)). The internal neutron contribution is no longer negligible when the field diameter increases to 6 cm, but it only accounts for less than 20% of the total dose (Figure 9 (b)). In the case of the 9-cm field, the contribution of internal neutrons is significant for the organs close to the target, approximately to the level of the pharynx (Figure 9 (c)). For example, the internal dose to the eyes is 15% of the total for field 2 (6-cm diameter) but 40% of the total for field 3 (9-cm diameter).
Figure 9.
Total equivalent dose (dashed histograms) and internal neutron equivalent dose (solid histograms) for the 8-year-old phantom and (a) field 1, (b) field 2 and (c) field 3.
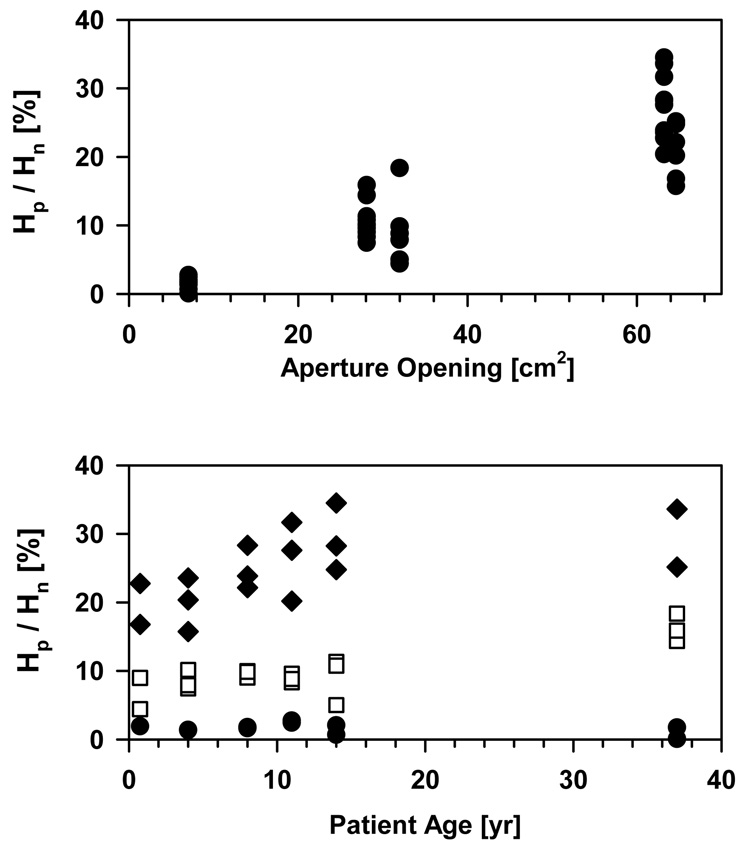
Figure 10 interprets the neutron contributions from the treatment head and the patient averaged over all organs. While for a small field the contribution of neutrons from the treatment head can be more than 99%, it can be as low as ∼60% for a large volume being treated, i.e. a large aperture opening, for the fields considered in this study. There is a considerable dependency on patient’s age.
Figure 10.
Upper: Ratio of equivalent doses from internal versus external neutrons as a function of aperture opening in percent of the total field area for all fields and phantoms. Lower: Ratio as a function of phantom age for all fields and phantoms (diamonds: 3 fields with large aperture opening; squares: 3 fields with medium aperture opening; circles: 2 fields with small aperture opening). The data were averaged over all organs with a contribution of more than 10−5 mSv/Gy from either external or internal neutrons.
Younger patients will experience higher contributions from the treatment head because a larger part of the body will be exposed to these neutrons.
Doses as a function of distance to the target
In the literature, neutron doses are typically not analyzed in an organ specific manner, but are reported as a function of distance to the field edge (with the exception of Agosteo et al (1998) and Jiang et al (2005)). This is because measurements (and simulations done to compare with these) can be done only when using a well-defined geometry.
The neutron organ equivalent doses decrease rapidly with increasing distance from the treatment volume. For example, in the 4 year old phantom, the neutron equivalent dose has an average value around 4 mSv/Gy in the lenses and falls to values of the order 10−4 or less mSv/Gy in the lower extremities. Similar trends are seen in the distance dependence of the organ equivalent dose in the other phantoms as well. For instance, the lung dose of the 14-year-old phantom is about 0.3–0.8 mSv/Gy, depending on field parameters, whereas the kidney dose is in the interval 0.05–0.15 mSv/Gy. The lung and kidney doses for the adult phantom are in the intervals 0.2–0.5 mSv/Gy and 0.02–0.05, respectively.
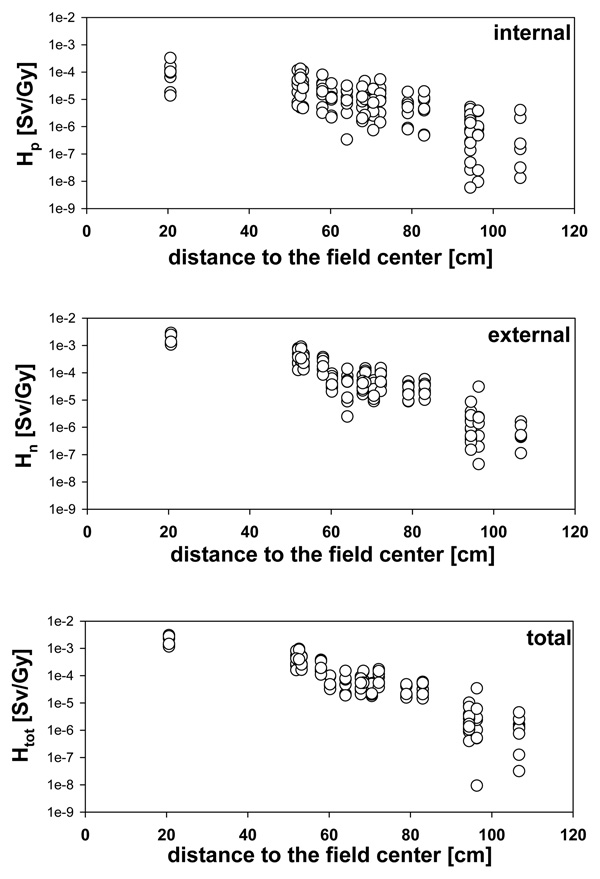
Figure 11 shows, for the adult phantom, the equivalent neutron dose as a function of distance to the center of the brain (for the mean position of the organ volume). The dependency on distance to the target is more pronounced for the external contribution because the lower extremities are displaced from the treatment head. Note the larger variation for the internal contribution and the overall much higher contribution from the treatment head when compared with the neutron doses generated through interactions within the patient itself.
Figure 11.
Organ equivalent dose as a function of distance to organs segmented in the adult phantom for all 8 fields. The distance in cm is based on the distance between the center of the brain and the approximate center position of the organ. Upper: Internal contribution only; middle: external contribution only; lower: total equivalent dose.
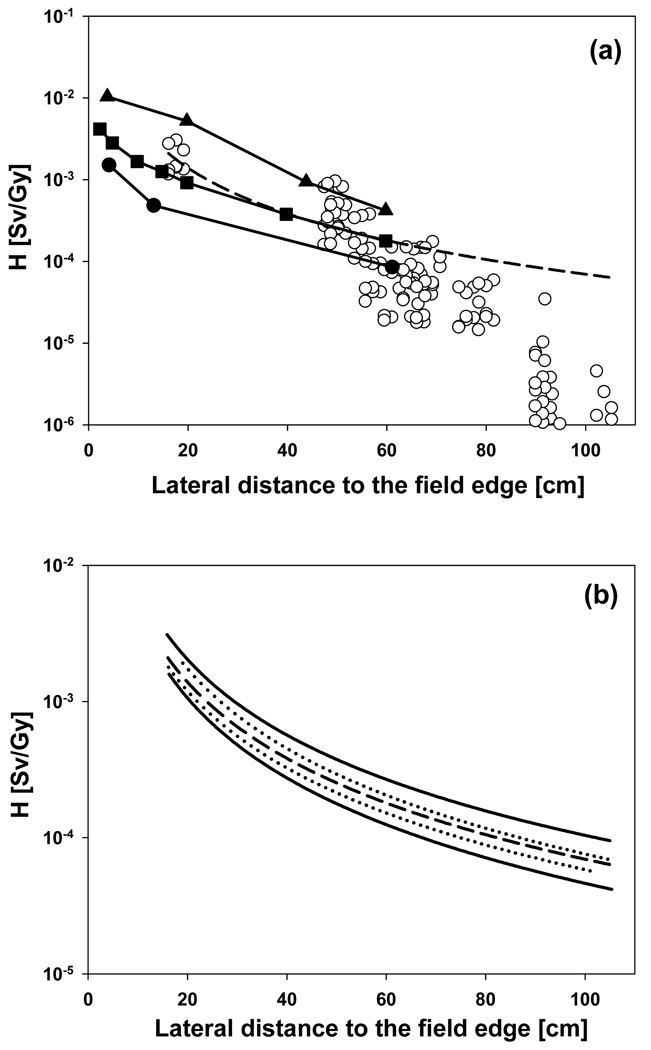
Figure 12 shows the results from two recent measurements of neutron equivalent doses as a function of distance to the target done at two proton therapy facilities (Mesoloras et al 2006, Wroe et al 2007). The data calculated in this work are in perfect agreement with the measured values reported by Wroe et al (2007). In fact, recent measurements (to be published) at Massachusetts General Hospital for various field specifications show neutron doses that are comparable with these data. Although this might serve as additional benchmark of our simulations, comparison of such data is difficult because of the many experimental parameters affecting the equivalent neutron dose (e.g., beam energy, field specifications). Previously, other experimental data (Yan et al 2002) have been chosen as an example for neutron equivalent doses in proton therapy (Hall 2006). These data however, do show a very extreme and clinically extremely unlikely (if not impossible for some facilities) beam configuration (Gottschalk 2006, Paganetti et al 2006).
Figure 12.
(a, upper figure): Organ equivalent doses for the adult phantom for all 8 fields (open circles). The dashed line is a power law fit (366.2×distance−1.861). The distance in cm refers to the distance between the edge of the field and the approximate mean position of the organ. The solid lines show doses as a function of distance from the field edge measured at different proton facilities at different beam configurations (closed squares (Wroe et al 2007); closed circles (Mesoloras et al 2006)). The closed triangles show the scattered photon dose to be expected from IMRT treatment using a 10cm × 10cm field (Klein et al 2006). The solid lines were drawn to connect the data points. (b, lower figure): The dashed line is the same as in (a). The two dotted lines represent a fit of the data from the two small aperture fields (fields 1 and 4; upper curve) and of the data from the three large aperture fields (fields 3, 6 and 7; lower curve). The two solid lines represent a fit of the data from the three large treatment volumes (fields 1, 2 and 3; upper curve) and of the data from the three small treatment volumes (fields 4, 5 and 6; lower curve).
Also shown in Figure 12 are the scattered photon doses to be expected from a 10cm × 10cm IMRT field (Klein et al 2006). Remarkably, it appears that for the fields considered in our study, the dose lateral to the target is lower than the scattered dose one would expect for an IMRT treatment. There is a considerable variation of the lateral dose as a function of field parameters (Figure 12, lower). The smaller the field (aperture opening) and the larger the treated volume, the higher the neutron dose is going to be. Thus, one can expect significant variations among different patient fields (in our case up to a factor of ∼3).
Doses as a function of patient (phantom) age
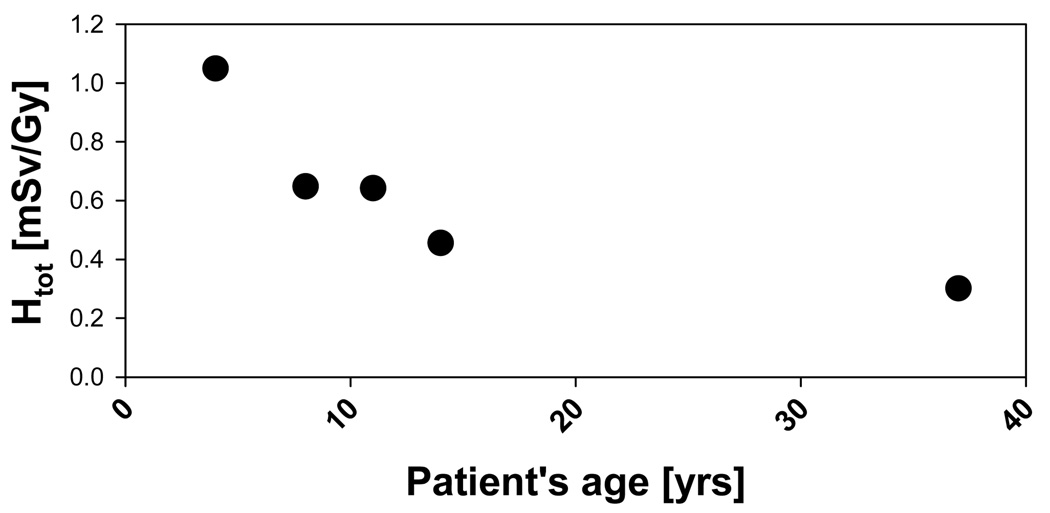
The dependence of organ equivalent dose on the distance from the radiation field implies a dependence of organ dose on patient age. Organs further to the target would receive a dose that decreases with age faster than the dose to organs closer to the target. Thus, neutron equivalent doses for organs at larger distances from the target will depend more on the patient’s age. Organs very close to the target should receive approximately the same dose irrespective of patient age since the distance to the target remains practically unchanged. The overall increase in organ dose as a function of patient’s age is illustrated in Figure 13 where the average equivalent dose to some major organs (esophagus, thymus, lungs, heart, liver, stomach wall, spleen, gall bladder, adrenal, pancreas, kidneys, and small intestine) is shown.
Figure 13.
Organ equivalent dose averaged over all 8 fields and averaged over esophagus, thymus, lungs, heart, liver, stomach wall, spleen, gall bladder, adrenal, pancreas, kidneys, and small intestine as a function of phantom age (except for the 9-month old) to illustrate the age dependency of secondary doses.
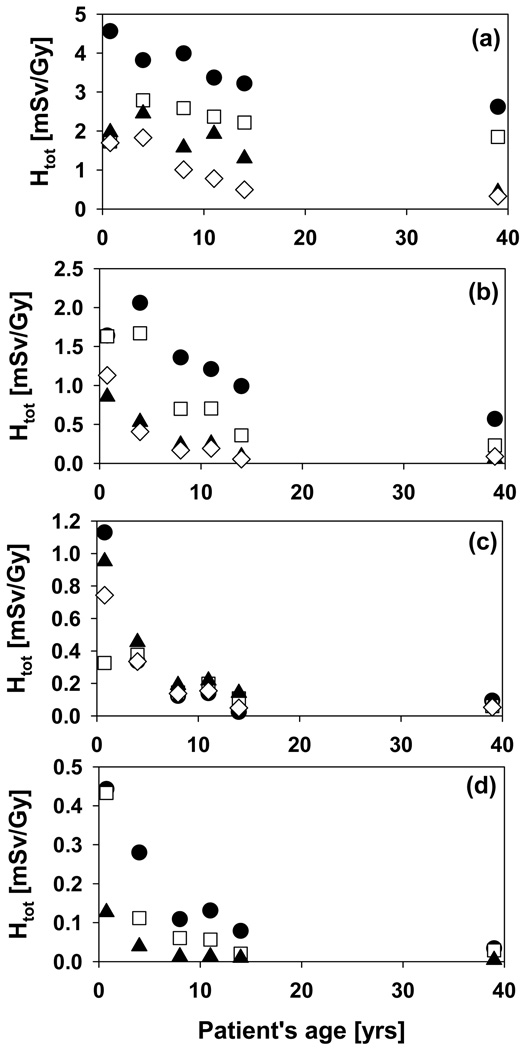
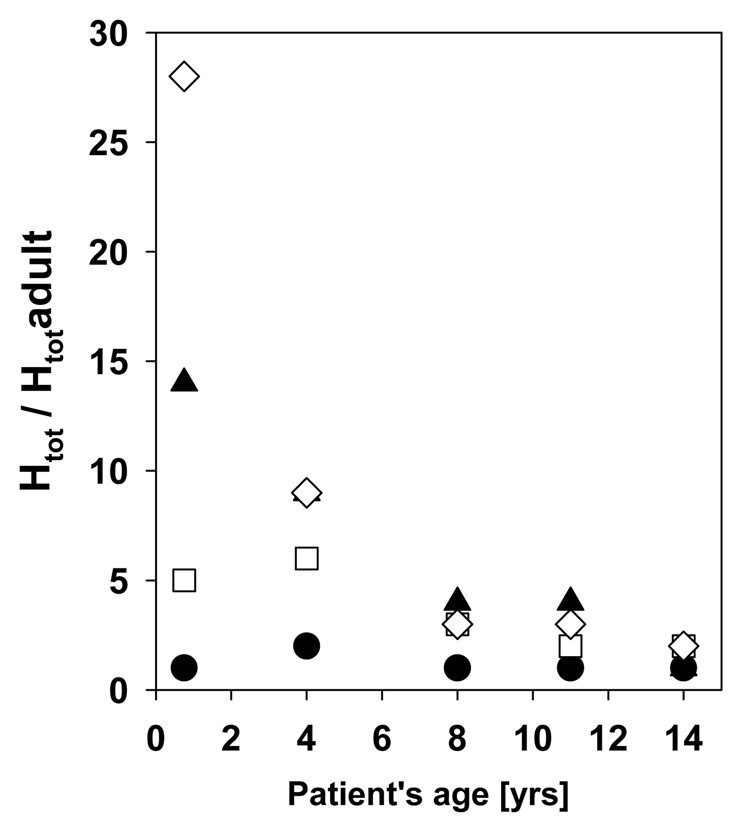
Figure 14 shows the total equivalent dose averaged over all fields as a function of phantom age for 15 organs: lenses, thyroid, thymus, lungs, esophagus, heart, liver, stomach, spleen, gall bladder, adrenals, pancreas, kidneys, small intestine and bladder. It is evident that the doses vary more significantly with patient age for organs further away from the target. For example, with decreasing age, the equivalent dose to the small intestine and the kidneys increases by a factor of 15 and 13, respectively. On the other hand, for the lenses that factor would only be 1.7. This is mainly due to the increasing height of patients with increasing age. However, other factors also play a role. These are the material composition and the change in material composition of the organ as a function of age, which influences the energy deposition, as well as the size of the organs changing with patient’s age. To further illustrate the factors by how much the doses increases with decreasing age, the dose to the five pediatric phantoms relative to the VIP dose is shown in Figure 15 for thyroid, lungs, liver and bladder.
Figure 14.
Organ equivalent dose as a function of phantom age averaged over all fields. (a): lenses (closed circles), thyroid (open squares), thymus (closed triangles) and lungs (open diamonds); (b): esophagus (closed circles), heart (open squares), liver (closed triangles) and stomach (open diamonds) (c): spleen (closed circles), gall bladder (open squares), adrenals (closed triangles) and pancreas (open diamonds) (d): kidneys (closed circles), small intestine (open squares), and bladder (closed triangles).
Figure 15.
Organ equivalent dose averaged over all fields and normalized to the adult dose for the five pediatric phantoms: bladder (open diamonds), liver (closed triangles), lungs (open squares) and thyroid (closed circles).
4. Summary and Conclusion
In summary, we have shown quantitatively how organ specific neutron equivalent doses for adult and pediatric patients vary as a function of patient age, organ, and field parameters. One can expect significant variations among different patient fields. Larger treatment volumes that are deeper in the patient cause significantly higher neutron equivalent doses. The reason is twofold. First, to reach deeper targets in the body (larger range), higher proton beam energies are needed. Second, to treat a larger volume (larger modulation width), higher proton fluence is needed in order to cover the entire target with the prescribed dose. However, for the same range and modulation width, neutron equivalent doses tend to decrease with increasing field size because of the significant decrease of the treatment head contribution when the field size gets large (less blocking aperture material).
While for a small field the contribution of neutrons from the treatment head can be more than 99%, it can be as low as ∼60% for a large volume being treated (i.e., a large aperture opening) for the fields considered in this study.
Neutron equivalent doses decrease rapidly with increasing distance from the treatment volume. For a patient under treatment, the dependency on distance from the target is more pronounced for the external contribution because the lower extremities are displaced from the treatment head. When comparing the data with scatter doses in IMRT, it appears that for all fields considered in this study, the dose lateral to the target is lower than the scattered dose one would expect for an IMRT treatment. Nevertheless, there could be treatment fields or beam delivery systems where the equivalent neutron doses are higher than scattered dose in IMRT. There is no representative curve generally valid for proton therapy. The amount of neutrons (and their energy) produced in the treatment head of a proton therapy machine for broad-beam modulation depends on several factors, such as the characteristics of the beam entering the treatment head, the material in the double scattering system and the modulator wheel, and the field size upstream of the final patient specific aperture. Neutron doses are highly facility dependent because of differences in position and design of devices in the treatment head. Even for the same facility there are huge variations from field to field because the treatment head geometry and the beam characteristics in passive scattered proton therapy are patient field specific.
Most importantly, our study shows that neutron doses to specific organs depend considerably on patient age/size. The younger and smaller the patient, the higher the dose deposited via neutrons. Obviously, even if neutron doses would be considered negligible for adult patients, the strong age dependency certainly warrants attention when treating pediatric patients. The difference in organ specific equivalent dose can be around a factor of 30 for some organs when comparing adults and very small children. Given the fact that the cancer risk also increases with decreasing patient age (BEIR 2006), extra attention must be paid to the treatment of pediatric patients. Because scanned proton facilities minimize the external component, proton beam scanning is advantageous in minimizing any secondary neutron exposures to patients.
One has to keep in mind also that patients are exposed to increasing doses from imaging studies because of sophisticated patient setup (e.g., on-board imaging) or adaptive planning strategies. Table 8 shows how the neutron equivalent doses calculated in this study for a 70 Gy treatment relate to exposures due to imaging of pediatric patients. The neutron equivalent dose to some organs when treating a pediatric patient for a brain tumor could be equivalent to ∼30 additional chest CT-scans. For organs further away from the target the factor is smaller. Most risk models account for dose rate effects by introducing scaling factors. The BEIR committee (BEIR 2006) recommends the use of a correction factor (DDREF, dose and dose rate effect factor) of 1.5 to take into account fractionation when using dosimetric data for risk analysis for solid tumors and linear dose response relationships. We decided not to scale the therapeutic neutron equivalent doses using a DDREF factor because of a possible reverse dose rate effect with high-LET neutrons (Kocher et al 2005).
Table 8.
Equivalent doses (in mSv) for thyroid, lung and stomach due to neutron radiation calculated in this work considering a 70 Gy treatment (averaged over all fields; only 5 out of 8 fields were used for the 9 month old who thus misses the large volume fields). Note that the therapeutic dose was not modified with a scaling factor to account for fractionation. The values are compared to the radiation to be expected from a chest CT scan as a function of patient’s age (Lee et al 2007). All values are in mSv.
| 9-month old | 4-year old | 11-year old | 14-year old | Average | |
|---|---|---|---|---|---|
| H to thyroid from proton therapy | 121.2 | 195.4 | 166.0 | 155.1 | |
| H to thyroid from chest CT scan | 8.0 | 9.0 | 5.2 | 6.9 | |
| Therapy / CT scan (thyroid) | 15.1 | 21.6 | 31.8 | 22.4 | 22.7 |
| H to lung from proton therapy | 118.7 | 128.2 | 54.7 | 34.7 | |
| H to lung from chest CT scan | 15.0 | 13.9 | 12.0 | 12.6 | |
| Therapy / CT scan (lung) | 7.9 | 9.3 | 4.5 | 2.8 | 6.1 |
| H to stomach from proton therapy | 79.2 | 28.5 | 13.5 | 3.8 | |
| H to stomach from chest CT scan | 11.0 | 4.9 | 5.9 | 5.0 | |
| Therapy / CT scan (stomach) | 7.2 | 5.8 | 2.3 | 0.7 | 4.0 |
One important source of uncertainty when estimating equivalent doses is the assignment of quality factors. Although our simulations are based on the (supposedly conservative) ICRP recommendations in terms of neutron quality factor distribution, one has to be aware that the ICRP quality factors may not be very accurate for extremely low doses where huge uncertainties exist (Kellerer 2000). Energy averaged neutron quality factors in the human body based on the ICRP curve are typically between 2 and 11 (Yan et al 2002, Jiang et al 2005, Wroe et al 2007). The BEIR report (BEIR 2006) recommends a neutron quality factor of 10 independent of neutron energy (although it is acknowledged that this might be too low when low doses are involved). Dennis (Dennis 1987) has summarized experimental neutron RBE data and found maximum values (low dose) between 6.44 and 71 in vivo. Similarly, the NCRP has shown elevated neutron quality factors for fission neutrons considering several radiation endpoints (NCRP 1990). The latter could be somewhat misleading since fission neutrons are in the 1–2 MeV energy range where neutron quality factors are expected to be at their maximum (Figure 3). Nevertheless, one can argue that the ICRP recommendation (which was used in this work) does not represent a conservative quality factor assignment for low dose risk assessments. Taking into account a more conservative neutron RBE would certainly increase the neutron equivalent doses simulated here. Further research on low-dose RBE for neutron radiation is needed to answer this question.
Table 4.
Organ indices for the UF male phantoms.
| organ index | organ/tissue | organ index | organ/tissue | organ index | organ/tissue |
|---|---|---|---|---|---|
| 1 | eyes | 17 | gall bladder wall | 33 | sternum |
| 2 | tonsil | 18 | spinal cord | 34 | upper humerus |
| 3 | salivary glands | 19 | aorta | 35 | ribs |
| 4 | tongue | 20 | adrenals | 36 | t-vertebrae |
| 5 | pharynx | 21 | pancreas | 37 | lower humerus |
| 6 | larynx | 22 | kidneys | 38 | l-vertebrae |
| 7 | trachea | 23 | small intestine wall | 39 | radii, ulnae |
| 8 | thyroid | 24 | colon wall | 40 | os coxae |
| 9 | thymus | 25 | bladder wall | 41 | sacrum |
| 10 | bronchi | 26 | prostate | 42 | hand |
| 11 | lungs | 27 | rectosigmoid wall | 43 | upper femur |
| 12 | esophagus | 28 | testes | 44 | lower femur |
| 13 | heart | 29 | mandible | 45 | tibiae, patellae |
| 14 | liver | 30 | c-vertebrae | 46 | fibula |
| 15 | stomach wall | 31 | clavicles | 47 | ankle, feet |
| 16 | spleen | 32 | scapulae |
ACKNOWLEDGEMENTS
This work was supported by National Institutes of Health (R01 CA 116743).
Footnotes
PACS: 87.10.Rt, 87.10.Vg, 87.15.ak, 87.53.Bn, 87.53.Jw, 87.55.K-, 87.55.N-
REFERENCES
- Agosteo S, Birattari C, Caravaggio M, Silari M, Tosi G. Secondary neutron and photon dose in proton therapy. Radiother. Oncol. 1998;48:293–305. doi: 10.1016/s0167-8140(98)00049-8. [DOI] [PubMed] [Google Scholar]
- Agostinelli S, Allison J, Amako K, Apostolakis J, Araujo H, Arce P, Asai M, Axen D, Banerjee S, Barrand G, Behner F, Bellagamba L, Boudreau J, Broglia L, Brunengo A, Burkhardt H, Chauvie S, Chuma J, Chytracek R, Cooperman G, Cosmo G, Degtyarenko P, Dell’Acqua A, Depaola G, Dietrich D, Enami R, Feliciello A, Ferguson C, Fesefeldt H, Folger G, Foppiano F, Forti A, Garelli S, Giani S, Giannitrapani R, Gibin D, Gomez Cadenas JJ, Gonzalez I, Gracia Abril G, Greeniaus G, Greiner W, Grichine V, Grossheim A, Guatelli S, Gumplinger P, Hamatsu R, Hashimoto K, Hasui H, Heikkinen A, Howard A, Ivanchenko V, Johnson A, Jones FW, Kallenbach J, Kanaya N, Kawabata M, Kawabata Y, Kawaguti M, Kelner S, Kent P, Kimura A, Kodama T, Kokoulin R, Kossov M, Kurashige H, Lamanna E, Lampen T, Lara V, Lefebure V, Lei F, Liendl M, Lockman W, Longo F, Magni S, Maire M, Medernach E, Minamimoto K, Mora de Freitas P, Morita Y, Murakami K, Nagamatu M, Nartallo R, Nieminen P, Nishimura T, Ohtsubo K, Okamura M, O’Neale S, Oohata Y, Paech K, Perl J, Pfeiffer A, Pia MG, Ranjard F, Rybin A, Sadilov S, Di Salvo E, Santin G, Sasaki T, Savvas N, Sawada Y, Scherer S, Sei S, Sirotenko V, Smith D, Starkov N, Stoecker H, Sulkimo J, Takahata M, Tanaka S, Tcherniaev E, Safai Tehrani E, Tropeano M, Truscott P, Uno H, Urban L, Urban P, Verderi M, Walkden A, Wander W, Weber H, Wellisch JP, Wenaus T, Williams DC, Wright D, Yamada T, Yoshida H, Zschiesche D. GEANT4 - a simulation toolkit. Nuclear Instrum. Methds. Phys. Res. A. 2003;506:250–303. [Google Scholar]
- BEIR. Health risks from exposure to low levels of ionizing radiation, BEIR VII, Phase 2. 2006. National Research Council, National Academy of Science. [Google Scholar]
- Binns PJ, Hough JH. Secondary dose exposures during 200 MeV proton therapy. Radiat. Prot. Dosim. 1997;70:441–444. [Google Scholar]
- Blattmann H. Beam delivery systems for charged particles. Radiat. Environ. Biophys. 1992;31:219–231. doi: 10.1007/BF01214829. [DOI] [PubMed] [Google Scholar]
- Dennis JA. The relative biological effectiveness of neutron radiation and its implications for quality factor and dose limitation. Progr. Nucl. Ener. 1987;20:133–149. [Google Scholar]
- Gottschalk B. Neutron dose in scattered and scanned proton beams: in regard to Eric J. Hall (Int J Radiat Oncol Biol Phys 2006;65:1–7) Int. J. Radiat. Oncol. Biol Phys. 2006;66:1594. doi: 10.1016/j.ijrobp.2006.08.014. author reply 1595. [DOI] [PubMed] [Google Scholar]
- Hall EJ. Henry S. Kaplan Distinguished Scientist Award 2003: The crooked shall be made straight; dose response relationships for carcinogenesis. Int. J. Radiat. Biol. 2004;80:327–337. doi: 10.1080/09553000410001695895. [DOI] [PubMed] [Google Scholar]
- Hall EJ. Intensity-modulated radiation therapy, protons, and the risk of second cancers. Int. J. Radiat. Oncol. Biol. Phys. 2006;65:1–7. doi: 10.1016/j.ijrobp.2006.01.027. [DOI] [PubMed] [Google Scholar]
- Hall EJ, Wuu C-S. Radiation-induced second cancers: The impact of 3D-CRT and IMRT. Int. J. Radiat. Oncol. Biol. Phys. 2003;56:83–88. doi: 10.1016/s0360-3016(03)00073-7. [DOI] [PubMed] [Google Scholar]
- ICRP. Reference Man: Anatomical, Physiological and Metabolic Characteristics. International Commission on Radiological Protection (Pergamon Press); 1975. p. 23. [Google Scholar]
- ICRP. Recommendations of the International Commission on Radiological Protection. International Commission on Radiological Protection (Pergamon Press); 1991. p. 60. [Google Scholar]
- ICRP. Basic Anatomical and Physiological Data for Use in Radiological Protection: Reference Values. International Commission on Radiological Protection (Pergamon Press); 2003a. p. 89. [Google Scholar]
- ICRP. Relative Biological Effectiveness (RBE), QualityFactor (Q), and Radiation Weighting Factor (wR) International Commission on Radiological Protection (Pergamon Press); 2003b. p. 92. [DOI] [PubMed] [Google Scholar]
- ICRP. International Commission on Radiological Protection Annual Report.2005. [Google Scholar]
- ICRU. Photon, Electron, Proton and Neutron Interaction Data for Body Tissues. International Commision on Radiation Units and Measurements; Bethesda, MD: 1992. Report No. 46. [Google Scholar]
- Jiang H, Paganetti H. Adaptation of GEANT4 to Monte Carlo dose calculations based on CT data. Med. Phys. 2004;31:2811–2818. doi: 10.1118/1.1796952. [DOI] [PubMed] [Google Scholar]
- Jiang H, Seco J, Paganetti H. Effects of Hounsfield number conversions on patient CT based Monte Carlo proton dose calculation. Med. Phys. 2007;34:1439–1449. doi: 10.1118/1.2715481. [DOI] [PMC free article] [PubMed] [Google Scholar]
- Jiang H, Wang B, Xu XG, Suit HD, Paganetti H. Simulation of Organ Specific Patient Effective Dose Due to Secondary Neutrons in Proton Radiation Treatment. Phys. Med. Biol. 2005;50:4337–4353. doi: 10.1088/0031-9155/50/18/007. [DOI] [PubMed] [Google Scholar]
- Kellerer AM. Risk estimates for radiation-induced cancer - the epidemiological evidence. Radiat. Environ. Biophys. 2000;39:17–24. doi: 10.1007/pl00007679. [DOI] [PubMed] [Google Scholar]
- Klein EE, Maserang B, Wood R, Mansur D. Peripheral doses from pediatric IMRT. Med. Phys. 2006;33:2525–2531. doi: 10.1118/1.2207252. [DOI] [PubMed] [Google Scholar]
- Kocher DC, Apostoaei AI, Hoffman FO. Radiation effectiveness factors for use in calculating probability of causation of radiogenic cancers. Health Phys. 2005;89:3–32. doi: 10.1097/01.hp.0000154172.48895.45. [DOI] [PubMed] [Google Scholar]
- Kry SF, Salehpour M, Followill DS, Stovall M, Kuban DA, White RA, Rosen II. The calculated risk of fatal secondary malignancies from intensity-modulated radiation therapy. Int. J. Radiat. Oncol. Biol. Phys. 2005;62:1195–1203. doi: 10.1016/j.ijrobp.2005.03.053. [DOI] [PubMed] [Google Scholar]
- Lee C, Bolch W. Construction of a tomographic computational model of a 9-mo-old and its Monte Carlo calculation time comparison between the MCNP4C and MCNPX codes. Health Phys. 2003;84:S259. [Google Scholar]
- Lee C, Lee C, Bolch WE. Age-dependent organ and effective dose coefficients for external photons: a comparison of stylized and voxel-based paediatric phantoms. Phys. Med. Biol. 2006a;51:4663–4688. doi: 10.1088/0031-9155/51/18/014. [DOI] [PubMed] [Google Scholar]
- Lee C, Lee C, Staton RJ, Hintenlang DE, Arreola MM, Williams JL, Bolch WE. Organ and effective doses in pediatric patients undergoing helical multislice computed tomography examination. Med. Phys. 2007;34:1858–1873. doi: 10.1118/1.2723885. [DOI] [PubMed] [Google Scholar]
- Lee C, Lee C, Williams JL, Bolch WE. Whole-body voxel phantoms of paediatric patients--UF Series B. Phys. Med. Biol. 2006b;51:4649–4661. doi: 10.1088/0031-9155/51/18/013. [DOI] [PubMed] [Google Scholar]
- Lee C, Williams JL, Lee C, Bolch WE. The UF series of tomographic computational phantoms of pediatric patients. Med. Phys. 2005;32:3537–3548. doi: 10.1118/1.2107067. [DOI] [PubMed] [Google Scholar]
- Lim SM, DeNardo GL, DeNardo DA, Shen S, Yuan A, O'Donnell RT, DeNardo SJ. Prediction of myelotoxicity using radiation doses to marrow from body, blood and marrow sources. J. Nucl. Med. 1997;38:1374–1378. [PubMed] [Google Scholar]
- Mesoloras G, Sandison GA, Stewart RD, Farr JB, Hsi WC. Neutron scattered dose equivalent to a fetus from proton radiotherapy of the mother. Med. Phys. 2006;33:2479–2490. doi: 10.1118/1.2207147. [DOI] [PubMed] [Google Scholar]
- Miralbell R, Lomax A, Cella L, Schneider U. Potential reduction of the incidence of radiation-induced second cancers by using proton beams in the treatment of pediatric tumors. Int. J. Radiat. Oncol. Biol. Phys. 2002;54:824–829. doi: 10.1016/s0360-3016(02)02982-6. [DOI] [PubMed] [Google Scholar]
- NCRP. The Relative Biological Effectiveness of Radiations of Different Quality. 1990. National Council on Radiation Protection and Measurements Report 104. [Google Scholar]
- Paganetti H, Bortfeld T, Delaney TF. Neutron dose in proton radiation therapy: in regard to Eric J. Hall (Int J Radiat Oncol Biol Phys 2006;65:1–7) Int. J. Radiat. Oncol. Biol. Phys. 2006;66:1594–1595. doi: 10.1016/j.ijrobp.2006.08.005. author reply 1595. [DOI] [PubMed] [Google Scholar]
- Paganetti H, Jiang H, Lee S-Y, Kooy H. Accurate Monte Carlo for nozzle design, commissioning, and quality assurance in proton therapy. Med. Phys. 2004;31:2107–2118. doi: 10.1118/1.1762792. [DOI] [PubMed] [Google Scholar]
- Paganetti H, Niemierko A, Ancukiewicz M, Gerweck LE, Loeffler JS, Goitein M, Suit HD. Relative biological effectiveness (RBE) values for proton beam therapy. Int. J. Radiat. Oncol. Biol. Phys. 2002;53:407–421. doi: 10.1016/s0360-3016(02)02754-2. [DOI] [PubMed] [Google Scholar]
- Polf JC, Newhauser WD. Calculations of neutron dose equivalent exposures from range-modulated proton therapy beams. Phys. Med. Biol. 2005;50:3859–3873. doi: 10.1088/0031-9155/50/16/014. [DOI] [PubMed] [Google Scholar]
- Ron E, Hoffman FO. Uncertainty in radiation dosimetry and their impact on dose-response analysis. National Cancer Institute. National Institue of Health. Workshop Proceedings; 1997. pp. 99–4541. [Google Scholar]
- Roy SC, Sandison GA. Scattered neutron dose equivalent to a fetus from proton therapy of the mother. Radiat. Phys. Chem. 2004;71:997–998. [Google Scholar]
- Schneider U, Agosteo S, Pedroni E, Besserer J. Secondary neutron dose during proton therapy using spot scanning. Int. J. Radiat. Oncol. Biol. Phys. 2002;53:244–251. doi: 10.1016/s0360-3016(01)02826-7. [DOI] [PubMed] [Google Scholar]
- Spitzer VM, Whitlock DG. The Visible Human Dataset: the anatomical platform for human simulation. Anat. Rec. 1998;253:49–57. doi: 10.1002/(SICI)1097-0185(199804)253:2<49::AID-AR8>3.0.CO;2-9. [DOI] [PubMed] [Google Scholar]
- Stovall M, Donaldson SS, Weathers RE, Robison LL, Mertens AC, Winther JF, Olsen JH, Boice JD., Jr Genetic effects of radiotherapy for childhood cancer: gonadal dose reconstruction. Int. J. Radiat. Oncol. Biol. Phys. 2004;60:542–552. doi: 10.1016/j.ijrobp.2004.03.017. [DOI] [PubMed] [Google Scholar]
- Stovall M, Smith SA, Rosenstein M. Tissue doses from radiotherapy of cancer of the uterine cervix. Med. Phys. 1989;16:726–733. doi: 10.1118/1.596331. [DOI] [PubMed] [Google Scholar]
- Tayama R, Fujita Y, Tadokoro M, Fujimaki H, Sakae T, Terunuma T. Measurement of neutron dose distribution for a passive scattering nozzle at the Proton Medical Research Center (PMRC) Nucl. Instrum. Methds. Phys. Res. A. 2006;564:532–536. [Google Scholar]
- Wilson VC, McDonough J, Tochner Z. Proton beam irradiation in pediatric oncology: an overview. J. Ped. Hemat. Oncol. 2005;27:444–448. doi: 10.1097/01.mph.0000174030.55485.54. [DOI] [PubMed] [Google Scholar]
- Wroe A, Rosenfeld A, Schulte R. Out-of-field dose equivalents delivered by proton therapy of prostate cancer. Med. Phys. 2007;34:3449–3456. doi: 10.1118/1.2759839. [DOI] [PubMed] [Google Scholar]
- Xu XG, Chao TC, Bozkurt A. VIP-MAN: an image-based whole-body adult male model constructed from color photographs of the Visible Human Project for multi-particle Monte Carlo calculations. Health Phys. 2000;78:476–485. doi: 10.1097/00004032-200005000-00003. [DOI] [PubMed] [Google Scholar]
- Yan X, Titt U, Koehler AM, Newhauser WD. Measurement of neutron dose equivalent to proton therapy patients outside of the proton radiation field. Nucl. Instrum. Methds. Phys. Res. A. 2002;476:429–434. [Google Scholar]
- Zacharatou Jarlskog C, Paganetti H. Physics models for the simulation of therapeutic proton beams in Geant4. IEEE Trans. Nucl. Sci. 2007 conditionally accepted for publication. [Google Scholar]
- Zaidi H, Xu XG. Computational anthropomorphic models of the human anatomy: the path to realistic monte carlo modeling in radiological sciences. Ann. Rev. Biomed. Eng. 2007;9:471–500. doi: 10.1146/annurev.bioeng.9.060906.151934. [DOI] [PubMed] [Google Scholar]


