Abstract
A synthetic two-layer, self-oscillating, life-size vocal fold model was used to study the influence of the vocal tract and false folds on the glottal jet. The model vibrated at frequencies, pressures, flow rates, and amplitudes consistent with human phonation, although some differences in behavior between the model and the human vocal folds are noted. High-speed images of model motion and flow visualization were acquired. Phase-locked ensemble-averaged glottal jet velocity measurements using particle image velocimetry (PIV) were acquired with and without an idealized vocal tract, with and without false folds. PIV data were obtained with varying degrees of lateral asymmetric model positioning. Glottal jet velocity magnitudes were consistent with those measured using excised larynges. A starting vortex was observed in all test cases. The false folds interfered with the starting vortex, and in some cases vortex shedding from the false folds was observed. In asymmetric cases without false folds, the glottal jet tended to skew toward the nearest wall; with the false folds, the opposite trend was observed. rms velocity calculations showed the jet shear layer and laminar core. The rms velocities were higher in the vocal tract cases compared to the open jet and false fold cases.
INTRODUCTION
As the vocal folds cyclically open and close, an orifice-modulated jet is formed. This glottal jet has been the subject of numerous studies since it comprises an essential source of sound in speech. A better understanding of the glottal jet and its interactions with supraglottal boundaries (e.g., the vocal tract lumen and the false folds) will yield insight into the glottal sound source. Improved understanding of the physical characteristics of the glottal jet can also yield insight into general vocal fold behavior and can benefit future development of analytical and computational laryngeal models.
Excised larynges have been used to study the glottal jet, for example, using hot-wire anemometry (e.g., Alipour and Scherer, 1995; Alipour et al., 1996) and particle image velocimetry [(PIV), Khosla et al. (2007)]. In the latter, PIV and high-speed imaging were used to evaluate, respectively, the flow structures immediately downstream of the glottal exit and the vocal fold motion for three different canine larynges. These experiments studied the glottal jet without a vocal tract for one subglottal pressure. Phase-locking was used to obtain two-dimensional average velocity vector fields over 30 phase positions; 10 averages at each phase were used. Various glottal jet vortical structures were described.
Experiments such as these that have used real vocal folds have the advantage of anatomical and physiological “realism.” For example, present in excised models is the surrounding cartilaginous framework, the multiple tissue layers of the vocal folds, and the anistropic, nonhomogeneous nature of the tissue itself. However, in vivo human and canine studies offer only limited instrument access, and in vivo human studies are limited by potential health hazards. Excised larynges are much more accessible, but are typically only able to be vibrated for a few minutes and require additional conditioning (e.g., flow heating and humidification, in addition to periodic direct wetting of the excised larynx tissue). Both in vivo and excised models have limited potential for use in parametric studies involving geometry and∕or material properties. Synthetic models overcome the above-noted challenges in that they have long usable lifetimes and are relatively easily parametrized.
Numerous studies using static and driven synthetic vocal fold models have been performed, e.g., Scherer et al. (1983, 2001), Pelorson et al. (1994), Hofmans et al. (2003), Shinwari et al. (2003), and Triep et al. (2005). These have been performed to study aspects of phonation such as intraglottal pressure distribution and glottal jet characteristics. Shadle et al. (1991) constructed a dynamic, life-size vocal fold model primarily for the purpose of flow visualization. The model consisted of one of a pair of thin shutters representing the vocal folds driven in simple harmonic motion by an electromechanical shaker; the glottal profile was rectangular. This configuration was described as representing one functioning and one paralyzed vocal fold. This setup also included a vocal tract and a set of hemisphere-shaped false vocal folds. It was observed that the false folds had a “straightening effect” on the glottal jet, even when the glottis was off-center. Barney et al. (1999) and Shadle et al. (1999) used a modification of this setup to investigate the influence of glottal velocities on the glottal acoustic source. A vocal tract was included, but false folds were not.
Mongeau et al. (1997) developed a dynamic, driven, life-size, open-jet vocal fold model with a convergent glottis profile. One goal was to validate the quasi-steady approximation assumed in static studies. Measurements using this model generally agreed with data presented using the static models of Scherer (1981) and with excised canine experiments of Alipour and Scherer (1995). The quasi-steady assumption was shown to be valid for all but roughly 1∕5th of the cycle (during glottal opening and closing). Zhang et al. (2002a, 2004) used this same model to further validate the quasi-steady assumption. A vocal tract was included, although the focus was primarily on acoustic measurements and no comparison was made between the open jet and vocal tract cases.
Erath and Plesniak (2006a, b, c) used a static model with a dynamic downstream boundary condition to study pulsatile jet flow through a divergent glottis. These studies were performed in a wind tunnel on a 7.5× scaled-up model and included a downstream length to simulate a vocal tract. An unsteadiness generator (rotating shutters downstream of the model test section) was used to create pulsatile flow. These studies used PIV to visualize and quantify the jet flow. They found that the jet tendency to attach to one side over the other was influenced by slight asymmetry in the glottis. At divergence angles of 10° and 20°, the jet exhibited bimodal behavior. However, at 40° divergence angle, the jet generally did not attach to either wall; this was a consequence of the jet being in the fully developed two-dimensional stall regime. It was found that asymmetric glottis conditions enhanced stability of the glottal jet.
Self-oscillating synthetic vocal fold models have also been studied. These types of models are important because they vibrate due to coupled fluid–solid–acoustic interactions, as the human vocal folds do. Titze et al. (1995) and Chan and Titze (1997) used a dynamic, synthetic vocal fold model that consisted of a stainless steel “body” covered by a silicone “epithelium” to study phonation threshold pressure. A hemilarynx configuration was used. Between the epithelium and the body was a cavity into which fluids of varying viscosity were injected; this was to simulate the superficial lamina propria. The model cover self-oscillated, but the body was static. This study did not use a vocal tract. These studies generally confirmed the previously developed model of phonation threshold pressure of Titze (1988) for large glottal widths, but showed that smaller widths produced results that deviated from the analytical model. Chan and Titze (2006) refined this model by using viscoelastic biomaterials in the cover layer and including a supraglottal tube. They found that the presence of a vocal tract consistently reduced phonation threshold pressure. The glottal jet itself was not studied.
Thomson et al. (2005) used a self-oscillating, synthetic vocal fold model made of a three-part silicone solution. The model was one-layer (homogeneous), isotropic, and was generally geometrically similar to the real vocal folds, but with a uniform cross section. A manufacturing process was described in which the model could be manufactured in separate layers of different material properties. The model was used in combination with a corresponding computational model of a similar one-layer model to quantify the aerodynamic energy transfer from the glottal jet to the vocal folds. It was demonstrated that the net energy transfer during glottal opening was greater than that during closing. Riede et al. (2008) applied this process to manufacture a two-layer vocal fold model. Zhang et al. (2006a) used the one-layer, isotropic model to study the effect of subglottal acoustics on synthetic vocal fold model vibration. It was shown experimentally and analytically that the one-layer model vibration was strongly coupled to acoustical resonances of the subglottal tract. In a follow-up study, Zhang et al. (2006b) investigated aerodynamically and acoustically driven modes of vibration. Restraining the vertical motion of the lateral regions of the one-layer model superior surface resulted in the model vibrating in response to aerodynamic coupling with the glottal jet rather than to acoustic coupling with the subglottal system. Neither Thomson et al. (2005) or Zhang et al. (2006a,b) used a vocal tract in their experiments.
Neubauer et al. (2007) used this one-layer model to examine flow structures immediately downstream of the glottal exit. PIV and high speed imaging was used to quantify velocities and to visualize near-field flow structures. Flow structures were extracted from the jet flow using principal component analysis. Measured results included oscillating jet angle, shear layer structure, flapping of the turbulent region, and coherent structures. This study observed vortex generation, vortex convection, and jet flapping. This study was essentially for an open jet case. The study was limited to a few quasi-phase-locked flow images (i.e., instantaneous, rather than ensemble-averaged, data). They observed asymmetric flow in the glottal jet, identified the Coanda effect as being present in vibrating model, observed evidence of feedback∕feedforward coupling mechanisms between the glottal flow and the downstream near field, and suggested that “flapping” of the glottal jet in the turbulent region of the glottal jet was due to large-scale vortical motion.
Few glottal jet studies using self-oscillating models, real or synthetic, have compared flow structures with and without a vocal tract. This paper describes a series of experiments performed to investigate the influence of different supraglottal loading configurations on the jet exiting the vocal folds. A two-layer [body-cover, Hirano and Kakita (1985)], life-sized, self-oscillating vocal fold model was used. Supraglottal configurations included an open jet and eight cases of varying vocal tract asymmetry (five without false folds and three with false folds); all of these were studied at multiple subglottal pressures. Glottal exit velocity was measured quantitatively using PIV; model motion and the resulting glottal jet was observed qualitatively using high speed imaging. The model motion was also captured using high speed imaging.
METHODS
Synthetic model
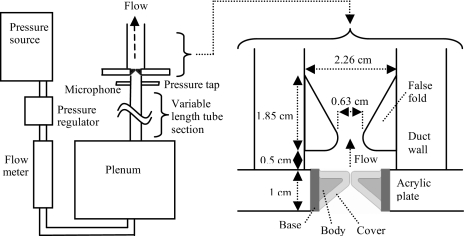
The synthetic model used was a recently developed two-layer version of the Thomson et al. (2005) one-layer model (Riede et al., 2008). The model was created using three-component addition-cure silicone (single-part silicone thinner and two-part Ecoflex 0030, Smooth-On, Inc., Easton, PA). The model consisted of two layers of differing modulus, as illustrated in Fig. 1. The model anterior-posterior length was approximately 1.7 cm. The cover layer was approximately 2 mm thick. The cover and body layers had Young’s moduli of approximately 4.1 and 22.5 kPa, respectively. In the human vocal folds, the Young’s modulus is nonlinearly dependent on strain (due primarily to the presence of collagen fibers) and also depends on strain direction (due to tissue anisotropy). Relatively little data are available regarding the transverse Young’s modulus of vocal fold tissue. In one study, Tran et al. (1993) measured the transverse Young’s modulus of the human vocal fold and found the mean value to be 12.7 kPa (with no recurrent laryngeal nerve stimulation). Further details regarding the model fabrication process, including model geometry, can be found elsewhere (Riede et al., 2008; Drechsel, 2007).
Figure 1.
Schematic and approximate dimensions of the synthetic, two-layer vocal folds and the false folds used in this study. The medial surfaces of the false folds were rounded as shown with a radius of approximately 0.33 cm.
Experimental model setup
The model was placed in a test fixture and not moved over the measurement duration. Two vocal fold models were each attached to a separate rectangular acrylic plate [similar to that of Thomson et al. (2005)]. These acrylic plates supported the vocal fold models and provided a surface for mounting to the subglottal and supraglottal tracts. The gap between the acrylic plates was sealed using closed-cell foam. The two acrylic pieces were brought together, compressing the foam and bringing the medial surfaces together so that the midregions were just touching. In this model, a small gap existed at one end of the resting orifice (perhaps similar to a posterior commissure). Bolts through the acrylic pieces were tightened to control and maintain the initial glottal gap.
The acrylic plate assembly was mounted to a subglottal test section, illustrated in Fig. 1. A 60 cm cylindrical subglottal tube with a cross-sectional area of 5 cm2 was used for these tests. Zhang et al. (2006a) studied the acoustic coupling of one-layer model vibration with subglottal acoustics. Other research (Drechsel, 2007) showed that the two-layer model exhibited similar coupling with subglottal acoustics as the one-layer models. The 60 cm subglottal tube length was selected on this basis to minimize the model onset pressure. A differential pressure transducer (Omega PX138-001D5V) was placed approximately 3 cm upstream of the acrylic plate. An expansion plenum (30.5 cm on each side) was placed at the upstream end of the subglottal tube. Shop air was used as a flow source, with a pressure regulator (Pneufine 26129-1C-19) and a flow meter (Matheson 605) located between the source and the plenum.
An idealized vocal tract was manufactured from 1.25-cm-thick aluminum on three sides, with the fourth wall made of 0.32-cm-thick glass for optical access. It was 30.5 cm long and had a square cross-sectional area of 5 cm2. When used, the vocal tract was mounted to the acrylic plate assembly using a plastic-laminated grid for lateral positioning.
A model of the false vocal folds (shown in Fig. 1) was manufactured out of clear rigid acrylic according to the mean values for an adult male reported in Agarwal et al. (2003) (see Drechsel, 2007 for further details). The lateral gap between the false folds was 0.63 cm; the vertical gap between the top of the (nonvibrating) vocal folds and the bottom of the false folds was 0.5 cm. The false folds were polished to improve transmission of the laser sheet into the space between the vocal folds and false folds.
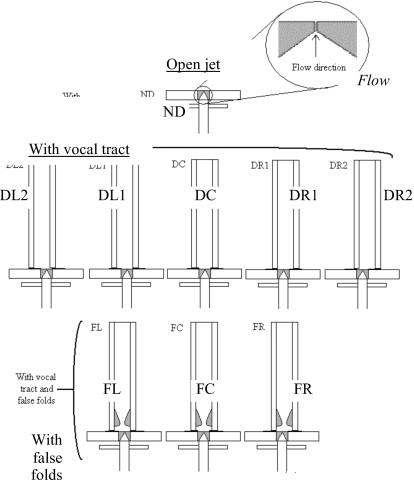
The supraglottal test configurations (see Fig. 2) included an open jet (no vocal tract), a vocal tract without false folds, and a vocal tract with false folds. A 32 cm×40 cm×57 cm shroud was used with the open jet configuration to increase seed density in the regions around the jet and thus enable velocity vector calculation; this was deemed to be sufficiently large to exert negligible influence on the glottal jet.
Figure 2.
Vocal tract configurations. ND denotes the no duct, or open jet, case. DL2 and DR2 denote the extreme left and right vocal tract offset cases (±4 mm) without the false folds, respectively, DL1 and DR1 denote the left and right offset cases (±1.5 mm), respectively, and DC denotes the symmetric vocal tract case, all without the false folds. FL, FC, and FR denote cases with false folds and the vocal tract positioned to the left (−1.5 mm), center, and right (+1.5 mm), respectively, of the vocal folds.
For the vocal tract without false folds configuration, five different cases were studied: one with the duct centered over the vocal folds (symmetric case), and four in which the vocal tract was laterally offset from the vocal fold medial plane (±1.5 and ±4 mm). For the vocal tract with false folds, three cases were studied: one with the duct centered over the vocal folds (symmetric case), and two in which the vocal tract was laterally offset from the vocal fold medial plane (±1.5 mm). The nomenclature used to denote these various cases is given in Fig. 2. These cases were tested for three mean subglottal pressures: 1.25, 1.5, and 1.9 kPa, although only the 1.25 and 1.9 kPa results are presented here.
As mentioned earlier, one wall of the vocal tract was made of glass. This presented a potential problem when seed particles were introduced to the airflow. If either the seed density or the driving pressure were sufficiently high, oil would accumulate on the glass, inhibiting imaging. DEHS oil (di-ethyl-hexyl sebacate, CAS#122-62-3) was used as the seed particle because it accumulated less on the glass than often-used olive oil. Measurements of the particle diameter were not made directly, but manufacturer data specify that the generator produces particles ranging from 0.2 to 1 μm. The Stokes number (St) was calculated to estimate the particles’ ability to follow the flow; the Stokes number, St=ρd2U∕(18μL), was calculated, where ρ is particle density (912 kg∕m3), d is particle diameter, U is fluid velocity (60 m∕s used here for a high-end estimate), μ is air viscosity (1.8×10⁻⁵ Pa s), and L is a flow length scale (the streamwise intraglottal length of 3 mm was used here). Using these parameters, Stokes number estimates ranged from 0.0023 to 0.056 for 0.2 to 1 μm sized particles, respectively, thus satisfying the St≪1 criteria.
Generally, as the pressure increased, the seed density could be reduced to minimize oil accumulation. However, oil accumulation persisted at the 1.9 kPa pressure, resulting in fewer images being able to be acquired (see Sec. 2E).
High-speed imaging setup
High-speed images of the vocal folds and of the glottal jet were acquired using a Photron FASTCAM-APX RS high-speed camera system. The resolution varied depending on the view of interest. Three views were imaged, with resolutions as follows: 640×448 pixels (for top view of the vocal fold motion), 896×624 pixels (flow visualization, side view), and 768×784 (flow visualization, front view), with corresponding frame rates of 10 000, 5000, and 5000 frames∕s, respectively. High-intensity white LEDs (Visual Instrumentation Corporation, single-LED array model 200800, controller model 200900) were pointed directly at the vocal folds for imaging the motion, and directed in a forward-scattering mode for jet illumination in the flow visualization studies. LEDs were used to minimize heating of the vocal folds. For flow visualization the flow was seeded using a LaVision Aerosol Generator and DEHS oil.
Particle imaging velocimetry experimental setup
For the present research, two-dimensional PIV was used, employing the double-image∕cross-correlation method, in which the camera captured two successive images separated by time dt. This technique was used by Khosla et al. (2007) and Neubauer et al. (2007). PIV assumes that the seed particles have negligible inertia with respect to the fluid momentum; this and the neutrally buoyant seed particle criteria were satisfactorily verified for these experiments (Drechsel, 2007). Compared to other velocity measurement techniques, PIV is relatively nonintrusive, is easily calibrated, and yields a significant quantity of flow information. The main drawback is that acquisition rates of only about 5 Hz are typical, requiring phase-locking and ensemble averaging for higher frequency events.
A LaVision PIV system was used, including a LaVision Imager Intense CCD camera, a LaVision Aerosol Generator, and a New Wave Research Solo II Nd:YAG laser. The camera resolution was 1376×1040 pixels. The laser sheet was approximately 0.5–1.0 mm thick. Again, DEHS oil was used for flow seeding. The LaVision software package, DAVIS, was used for image acquisition and processing.
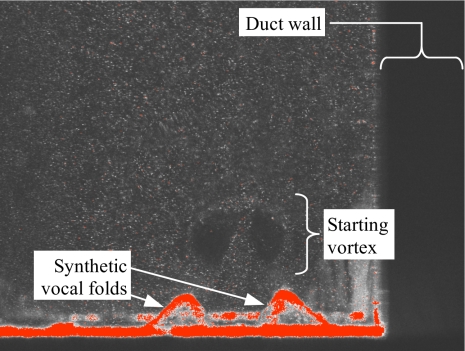
The laser sheet was in the model frontal plane, approximately centered anterior-posteriorly. The camera was positioned so that the top of the vocal fold model was just above the bottom of the field of view, with the glottal jet approximately centered left-to-right. Care was taken to make all surfaces in the field of view as dark as possible to minimize laser reflection into the camera. The vocal fold fixture was often checked to ensure that the model was correctly centered and level in the camera frame. The camera field of view was adjusted to extend to an area as wide as the inside of the vocal tract and just higher than the false folds, or about 22 mm (horizontal)×16 mm (vertical). Calibration was accomplished by placing a ruler in the camera view. A typical calibration constant was approximately 54 pixels∕mm. Figure 3 shows a typical image obtained using this setup using PIV (shown with an offset vocal tract configuration).
Figure 3.
(Color online) Example PIV image obtained using the current setup.
Data analysis
PIV analysis
The model frequency was fairly consistent; however, even small fluctuations in frequency would inhibit successful ensemble averaging based on a constant frequency data acquisition. Therefore, a custom phase-locking circuit trigger the PIV image acquisition using the subglottal pressure sensor as the triggered input (see Drechsel, 2007 for details).
The PIV software allowed for adjustable time delay following a trigger input. Using this feature, 30 phases of vocal fold oscillation were interrogated, with either 100 or 50 image pairs (depending on pressure as discussed in the following) collected at each phase. The dt was set to 3 μs. The image pairs were analyzed using a nonweighted, double-pass, decreasing window size (32×32 to 16×16 pixels), 50% overlap, cross-correlation algorithm. No postprocessing was performed to correct for potentially spurious vectors in the resulting vector fields. The vector fields were then ensemble-averaged and the rms velocity fields were calculated as discussed in the following.
The nine vocal tract configuration cases repeated at three different pressures required approximately 4.5 h of nearly continuous synthetic model vibration. Considering the additional time involved in experiment preparation, the model was actually run for many more hours. This is much longer than excised larynx models allow and demonstrates one aspect of synthetic model usefulness. Separate studies (Drechsel, 2007) have confirmed that the model vibratory behavior was fairly consistent over such long duration.
rms velocity calculation
The rms of the velocity is a spatially resolved measure of the fluctuation of the instantaneous velocity fields, and is calculated according to
| (1) |
where n is the number of averaged image pairs at a given phase, ui and vi are the x and y components of the instantaneous velocity of the ith image pair, and and are the local average x- and y-velocity components. Calculation of the ∣rms∣ velocity field is useful in identifying the jet core and shear layer regions and in quantifying the local jet velocity fluctuations.
Required number of images
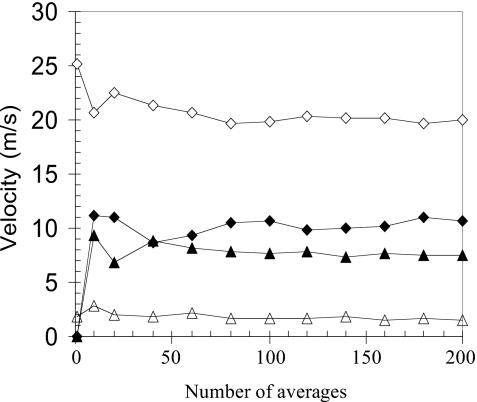
Ensemble averaging was used to reduce noise and to calculate average and rms velocity quantities. The number of image pairs necessary for convergence of these quantities was studied using two points in the flow field. The first point was in the jet core, a short distance above the glottal exit. The second point was located at the same vertical distance as the first point, but positioned laterally in the jet shear layer. Figure 4 shows the results of this study.
Figure 4.
Convergence of measured velocities versus numbers of images used in ensemble averaging (◇=jet core average velocity, ◆=jet core ∣rms∣ velocity, △=shear layer average velocity, ▲=shear layer ∣rms∣ velocity).
According to Fig. 4, the average and rms velocities appear to have stabilized somewhat between 100 and 200 averages for both point locations, although some fluctuations persist. For example, the jet core average velocity fluctuations are within about 0.3 m∕s between 100 and 200 averages, or less than 2% of the jet core velocity. The shear layer average velocity fluctuations are within about 0.2 m∕s between 100 and 200 averages, or about 20% of the shear layer velocity. As the number of averages increases, so also do the time and computer storage requirements. Further, in cases with a vocal tract, more averages allowed for more time for oil to accumulate on the glass. As a compromise, 100 averages were used for the 1.25 kPa pressure study, and 50 averages were used for the 1.9 kPa pressure study. It is noted that a more rigorous study of the number of data points required to calculate the true mean and rms velocities would entail performing this similar calculation not only at two points, but at each point in the flow field, and would also require more averages. This would potentially require data sets numbering in the high hundreds or thousands. Thus the present analysis serves as only an estimate of the mean and rms quantities.
Jet centerline
Erath and Plesniak (2006a) described a method for determining the jet deflection angle at a given point downstream of the glottis. Their approach was extended here to identify the entire jet centerline over a complete cycle of oscillation at each phase. This jet centerline finding algorithm was implemented using the average velocity data and a MATLAB script as follows.
First, spurious vectors along the right and left edges of each average velocity data set were set to a value of zero (e.g., in the duct walls). The following steps were then performed at each vertical position above the glottal exit:
-
(1)
A minimum velocity threshold was determined based on the jet growth, and this threshold was used to determine when jet began and decayed (7 m∕s was used here).
-
(2)
Smoothing was accomplished in the horizontal direction by taking the average of each velocity vector with its six neighboring vectors (three on each side).
-
(3)
The maximum jet velocity was identified using the smoothed velocity profiles.
-
(4)
The jet core was defined as all lateral vectors that had a value of greater than 80% of the maximum jet velocity.
-
(5)
The jet center was defined as the geometric center of all vectors within one standard deviation of the jet core mean value.
The jet centerline was constructed from the individual jet centers over the entire range of vertical positions above the glottis, and this “rough” centerline was then smoothed in the vertical direction using an average of the individual centerline point and its four (two on each side) neighboring centerline points. Figure 5 shows the examples at three phases of the centerline using this algorithm, where the located centerline can be seen to satisfactorily follow the jet center.
Figure 5.
(Color online) Selected phases from jet centerline finding algorithm applied to FR case with p=1.25 kPa. Color denotes velocity magnitude and the black line is the calculated centerline position. Shown are examples of starting jet (left, phase ≈0.07 of one cycle), full jet (middle, phase ≈0.33), and decaying jet (right, phase ≈0.40). In the extreme sides of the images, potentially spurious vectors have been replaced with zero vectors.
RESULTS
The average model vibration frequency during all measurements was measured to be 132 Hz over the 1.25–1.9 kPa subglottal pressure range. Time-averaged flow rates were 103, 149.5, and 232.3 ml∕s for subglottal pressures of 1.25, 1.5, and 1.9 kPa, respectively.
High-speed images
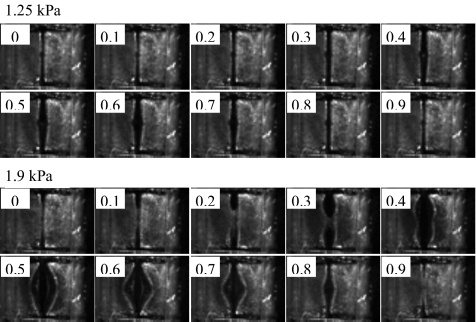
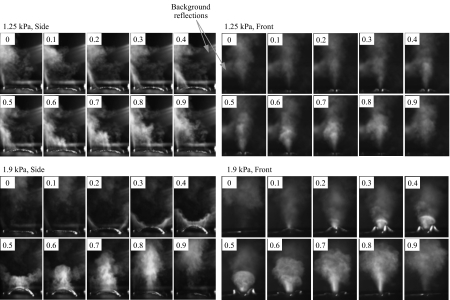
Figure 6 shows a top view of one cycle of model vibration for the 1.25 and 1.9 kPa cases; Fig. 7 shows two views of the glottal jet using flow visualization for the same pressures. A small steady flow can be seen in the 1.25 kPa flow visualization images (see top rows of Fig. 7) where the orifice did not completely close during collision. Surface tackiness can be seen to have interfered somewhat with the model opening. For the higher pressure, the glottal orifice first divided into two separate anterior and posterior areas during glottal opening (see Fig. 6). Relative to the 1.9 kPa case, the inferior-superior motion of the vocal folds at 1.25 kPa was small (see Fig. 7, side views). Observation of the flow through several sequential cycles did not yield any evidence of significant variation in the overall jet pattern (including jet direction).
Figure 6.
Top view of high-speed images of synthetic vocal fold model at p=1.25 kPa (left) and p=1.9 kPa (right). The approximate phase (relative to one cycle) is shown.
Figure 7.
Side view (left columns) and front view (right columns) of high-speed flow visualization at p=1.25 kPa (top) and p=1.9 kPa (bottom). The phase proceeds from left to right and from top to bottom for each image. Note that the side and front views were not obtained simultaneously, so that the phases shown (relative to one cycle) are only approximate.
A fairly coherent starting vortex is apparent at the higher pressure. The starting vortex and the lateral motion both occurred in the early part of the cycle. The adhesion facilitated rapid lateral acceleration at the vocal fold midplane, which seemed to contribute to the impulsive development of the vortex. The jets were all roughly (although not perfectly) symmetric in the medial-lateral sense. Also of interest is the double-jet formation during glottal opening, followed by subsequent merging into a single jet, at the higher pressure (Fig. 7, side view).
Average velocity
Maximum average velocity magnitudes measured in this study using PIV were in the range of 50–61.5 m∕s. These compare well with magnitudes measured using an excised larynx reported by Alipour and Scherer (2006). Reynolds numbers based on the glottal jet velocity and estimates of the maximum orifice area were calculated to be in the range of 727–1621. These Reynolds numbers suggest the flow exiting the orifice should be laminar; rms calculations (to follow) support this observation for most (but not all) configurations, pressures, and phases.
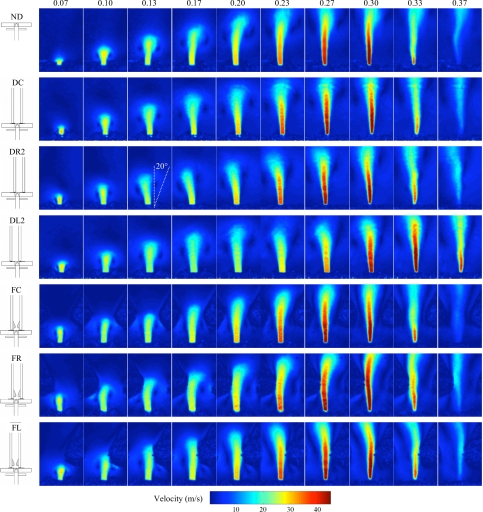
Figure 8 shows ensemble-averaged velocity plots for all of the cases at ten phases for the 1.25 kPa case. For all pressures and all cases, a starting vortex was observed. The vortex appeared to last for more than half of the jet lifetime in most of the test cases. The vortex tended to grow laterally as the jet developed. For both pressures, the duct influenced the direction of the jet in the vocal tract cases, causing the jet to tend toward the closest wall. This is discussed further in Sec. 3C.
Figure 8.
(Color online) Ensemble-averaged velocity over the glottal cycle at pressure p=1.25 kPa. The icons outside of each image set show the respective test geometry show the respective test geometry and are defined in Fig. 3. The top row of text denotes approximate phase (referenced to fraction of one period).
Comparing the false fold cases with the open jet case for p=1.25 and p=1.9 kPa (not shown), the false folds clearly interfered with the starting vortex. This effect was repeated for both asymmetric false fold cases, with the vortex nearest to the vocal tract center persisting longer than that nearest to the false folds. A small vortex was also sometimes seen in the space between the true and false folds (the laryngeal ventricle, although it is noted that the laryngeal ventricle likely extends further laterally in human phonation). This jet interaction with the false folds may constitute a sound source through fluid–solid interaction. Further, the “grazing” of the jet over the laryngeal ventricle could act as a kind of acoustic resonator (Zhang et al., 2002b). It is emphasized that interference of the vortex with the glottal jet was observed for both symmetric and asymmetric false fold cases. This presents evidence that for average adult human male false fold size and position, the false folds may prematurely disrupt the coherent glottal vortex, although further experiments using real vocal folds and vocal tract should be performed to confirm this observation.
In the asymmetric false fold cases, the jet tended to deflect away from the nearest false fold as the jet neared the bottom surface of a false fold. This deflection could have been due to either the jet impingement or to the vortex interaction, or a combination of the two. The FR case at 1.9 kPa showed a second vortex shed from the downstream side of the near false fold as the jet passes the false fold. This was not seen in the 1.25 kPa cases, and it was not clear whether it occurred in the 1.9 kPa FL case (not shown). However, it is possible that this occurrence was related to the higher pressure. Also, the jet width is wider for the false fold cases than for the vocal tract or open jet cases.
The PIV experiments of Erath and Plesniak (2006b) showed jet bimodal (lateral “flapping”) behavior. Examination of the instantaneous PIV velocity data in this study did not show any of this behavior. Erath and Plesniak (2006b) stated that the flapping behavior was never observed for divergent glottal profiles of 40° or greater. It is possible that the profiles in these experiments reached such angles, although the glottal profiles were not measured in this study. Other differences in experimental setup and models may also account for this difference (their model consisted of rotating shutters downstream of a static vocal fold model with a divergent profile).
Jet centerline
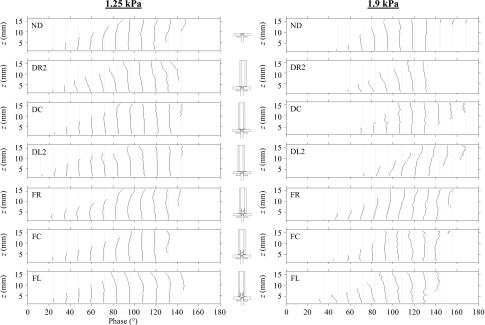
Plots of jet centerline versus phase for different duct configurations and for both pressures are shown in Fig. 9; the z coordinate in the vertical axes labels denotes streamwise location. These plots provide more convenient identification of the jet direction than the velocity plots.
Figure 9.
Jet centerline plots versus phase for duct cases at p=1.25 kPa (left) and p=1.9 kPa (right). The respective configuration labels and icons are shown. The z coordinate in the vertical axes denotes streamwise location.
The open jet at p=1.25 kPa tended to skew toward the right. With the vocal tract, the jet initially skewed slightly toward the nearer wall. Eventual slight straightening of the glottal jet is seen. The same trends were found for p=1.9 kPa, only the more pronounced influence of the duct wall resulted in greater jet deflection. The closer the jet was to the wall, the more it tended to skew toward the wall in its initial development. For the DL2 case, the 1.25 kPa jet skewed only slightly toward the wall only in the initial development; the 1.9 kPa DL2 case clearly tended toward the wall throughout the cycle. The reason for this difference in behavior at different pressures is not clear, although it is likely attributable to a combination of possible asymmetric motion and higher flow rate.
The false fold 1.25 and 1.9 kPa cases showed a different tendency. When the false folds were offset with respect to the vocal fold model, the jet initially tended to skew away from the near wall and from the near false fold toward the duct centerline, then straighten, and then be further skewed by the near false fold boundary. Again, this is more pronounced at the higher pressure. This behavior is attributed to the additional fluid resistance caused by the presence of the near false fold. It is noted that the centerlines for the symmetric false folds cases and the open jet cases are very similar.
rms velocity
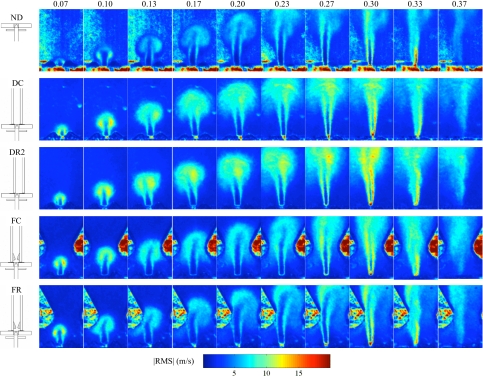
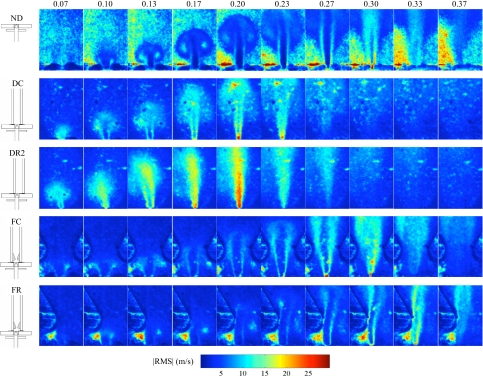
∣rms∣ results are shown in Figs. 1011 for select cases. As would be expected, ∣rms∣ was highest in the jet shear layers and lowest in the jet core. The high ∣rms∣ values outside of the jet in the no-duct cases were attributed to low seed particle density outside of the open jet. Similarly, high ∣rms∣ values in the laryngeal ventrical may have been due to reduced illumination.
Figure 10.
(Color online) Jet centerline plots versus phase for duct cases at p=1.25 kPa (left) and p=1.9 kPa (right). The respective configuration labels and icons are shown. The z coordinate in the vertical axes denotes streamwise location.
Figure 11.
(Color online) ∣rms∣ over the glottal cycle at pressure p=1.9 kPa. The icons outside of each image set show the respective test geometry. The top row of text denotes approximate phase (referenced to fraction of one period).
The results show consistently higher ∣rms∣ values in the leading vortex with the vocal tract than without, suggesting that the leading vortex may emerge more consistently (in terms of velocity magnitude and perhaps bearing) in the open case than in the confined case. In the lower pressure case, a laminar core that persisted a short distance downstream of the glottis is evident over most of the cycle. This laminar core disappeared during glottal closing; this is consistent with observations of Mongeau et al. (1997) and Zhang et al. (2002a) that the quasisteady assumption begins to break down during glottal closing due to jet turbulence. They also indicated that the quasisteady assumption is not as good during opening, and the results here indicate that fluctuations or unsteadiness in the starting vortex may contribute to this. Asymmetry in the vocal tract position did not seem to noticeably influence the ∣rms∣ values.
The ∣rms∣ plots assist in visualizing the interaction of the glottal jet with the false folds. Comparison of the FC and FR cases (in particular at the higher pressure) suggests that the vortex interaction with the false folds may have reduced the overall ∣rms∣ values in the starting vortex, suggesting a potentially stabilizing influence of the false folds. Other features of the jet, such as laminar core characteristics, do not seem to have been significantly altered.
For the p=1.9 kPa cases, the laminar core was nearly nonexistent when the jet was nearest the duct walls. Less asymmetric cases (DR1, DL1, not shown here) did show a distinct laminar core. The symmetric case showed a smaller laminar core than the DR1 and DL1 cases. With the presence of the false folds, the laminar core was evident over some parts of the cycle, although the jet appeared to be turbulent during closing.
DISCUSSION
Comparison with previous models
The present model’s behavior is here compared with previous models, specifically with the models of Neubauer et al. (2007) and Khosla et al. (2007). Several aspects of this model’s behavior are considered, some of which are in agreement with these models and some of which are not.
Synthetic model vibration
The model was similar to the human vocal folds in terms of frequency of oscillation, flow rate, and amplitude of vibration. However, some differences regarding mucosal wave and adhesion are noted.
An important aspect of vocal fold motion is the mucosal wave, i.e., the wave-like transition of a convergent profile to a divergent profile over the vibration period. One-layer models have been shown to demonstrate a degree of this change in profile (Thomson et al., 2004). Analysis of the present two-layer model’s medial surface dynamics is not available, but some information can be gathered from the images shown here. Evaluation of Figs. 67 shows that during the closed phase of oscillation, the medial surface of the present model was at least straight (because of collision), and possibly slightly convergent during opening. The model was divergent during part of the phase, which is especially evident in Fig. 6 for the 1.9 kPa case, where in phases 0.5–0.7 the glottal entrance can clearly be seen to be smaller than the glottal exit. This divergent motion is also somewhat evident in Fig. 7 (1.9 kPa case, front view) and Fig. 8 (1.25 kPa, DR2 case); in Fig. 8 the divergent angle is estimated to be approximately 20°. Thus the convergent-divergent behavior was evident. However, the “wavelike” motion typical of vocal fold vibration did not seem to be significantly manifest in this model. More data should be acquired to quantify the medial surface dynamics of these models. Further, it is recommended that efforts to develop synthetic models that more closely match the vibration patterns seen in in vivo and excised human vocal folds should be pursued.
Another limitation of the present model is the adhesion of the surfaces and the resulting change in vibration. This adhesion seemed to be influenced by the amount of DEHS oil wetting the surface (potentially explaining the differences in jet duration seen in Figs. 911). While a liquid bridge can sometimes be seen between the human vocal folds (e.g., Hsiao et al., 2002; Hsiung, 2004), this bridge typically does not cause the vocal folds to adhere to the extent seen in the 1.9 kPa case. This adhesion contributed to the development of the vortex, to the double-jet formation during glottal opening and subsequent merging, and to a shorter open quotient time. Pressed phonation is characterized by short quotient times, and thus may potentially yield similarly stronger initial vortices. The double-jet formation is not expected to be representative of typical phonation, although it may exist when abundant mucus results in a liquid bridge remaining intact throughout the phonation cycle. This double-jet formation was also evident in the flow visualization images of Neubauer et al. (2007).
Also worth mentioning is the degree of asymmetry in the present model. Qualitatively the motion was generally symmetric, but small asymmetries were present as evidenced by the slightly asymmetric starting vortex (see Fig. 7, 1.9 kPa case, front view, phases 0.3 and 0.4). However, this asymmetry did not seem to be nearly as pronounced, from either structural or aerodynamic perspectives, as in the model used by Neubauer et al. (2007). In the present model, the asymmetry seemed to be more pronounced at higher flow rates than at lower flow rates. Erath and Plesniak (2006c) showed that a glottal jet tended to attach to one side of the glottis when the flow acceleration was zero, and that a symmetric jet was formed at times of maximum acceleration. Thus considering the impulsive nature of the present jet due to adhesion, the strong vortex suggests a strong acceleration, and this may in part contribute to the lack of asymmetric fluid motion.
Flow patterns
a. Axis switching.
Axis switching occurs for various shapes of noncircular orifices. It was observed by Khosla et al. (2007) and was seen in the present model. This can be seen in the flow visualization images by comparing phases 0.6–0.8 of the front and side views of the 1.9 kPa case (Fig. 7). The major axis of the jet near the vocal fold exit is oriented in the anterior-posterior direction, whereas further downstream it is oriented in the medial-lateral direction.
b. Starting vortex.
The starting vortex seen in the present model was also observed by Khosla et al. (2007) and Neubauer et al. (2007), although it perhaps lasted longer in the present case. The model used in this paper appeared to have a shorter open quotient time than the Khosla et al. (2007) and Neubauer et al. (2007) models. It is therefore likely that the momentum build-up during the closed phase led to a stronger starting vortex, which may account for the longer duration.
c. Kelvin–Helmholtz vortex structures.
Using laser-illuminated flow visualization, Neubauer et al. (2007) showed the presence of Kelvin–Helmholtz instability in the supraglottal jet, as evidenced by distinct coherent vortices forming along the shear layer of the jet. Khosla et al. (2007) also observed these structures. The flow visualization in the present work (Fig. 7) used high-speed video imaging with dc illumination. A longer shutter speed of 1∕5000 s was required for adequate light exposure using the dc illumination. This resulted in the particles traveling a relatively long distance during image exposure. Consequently, “smearing” of the flow field occurred, inhibiting the visibility of coherent structures potentially located in the shear layer (such as Kelvin–Helmholtz vortices). Thus the present data are not conclusive regarding the presence of such flow structures in this model.
d. Intraglottal flow separation.
Intraglottal flow separation, a feature seen in both experimental and numerical results, and which is an important component of vocal fold self-oscillation (Titze, 1988), was evident in these models, e.g., phases 0.6–0.7 of Fig. 7 (1.9 kPa, front view).
e. Glottal jet skewing.
In Figs. 78, the jet can be seen to be slightly skewed during opening. In Fig. 8, phase 0.37 no duct case, the jet is beginning to experience “flapping” motion in the downstream regions similar to that discussed by Neubauer et al. (2007). Khosla et al. (2007) and Neubauer et al. (2007) observed skewing of the glottal jet during closing, consistent with the expected behavior of a divergent orifice. It is possible that slight skewing in the immediate near field just prior to closing occurred in the present model, but it does not seem to be significant; further investigation into this behavior could be beneficial.
Influence of supraglottal loading
Symmetric positioning of the vocal tract, with and without false folds, created jet centerline patterns that were generally similar to the open jet case. When the vocal tract was asymmetrically positioned with respect to the vocal fold model, the resulting jet centerline initially skewed toward the nearest wall in the vocal tract cases, but away from the nearest wall (and toward the vocal tract centerline) in the false fold cases. This can be explained as follows. In the vocal tract cases, as the gap between the jet and the nearest wall decreases, the fluid available to be entrained into the jet flow decreases. With less fluid to be entrained, the fluid that is entrained experiences greater velocity, which leads to a decrease in pressure. This pressure imbalance between the far and near walls forces the jet to initially tend toward the nearer wall. In the false fold cases, the flow between the jet and the nearest vocal tract wall is theorized to be substantially slower than in the vocal tract cases. Due to the obstructing influence of the inferior false fold surface, there is no outlet for the flow toward the nearest wall. Also, the vocal folds impose additional surface area for boundary layer and friction effects to occur. These effects combine to cause a decrease in velocity in this region, with a corresponding increase in pressure predicted. This would tend to force the jet away from the wall toward the vocal tract midplane. Further experimentation could determine at what value of vertical gap between the inferior false fold surface and the glottal exit the jet transitions from skewing toward the nearest wall to skewing away from the nearer wall.
CONCLUSIONS
The glottal jet exiting a two-layer synthetic, self-oscillating vocal fold model was investigated using high-speed imaging and PIV at multiple pressures. The behavior of the open jet case, commonly reported in the literature, was compared with the case which includes the vocal tract and the false folds.
Adhesion between the medial surfaces of the vocal fold model was evident, particularly at the highest pressure. This adhesion created a double orifice over a portion of the cycle (also noted by Neubauer et al., 2007) and appeared to delay the jet formation, which in turn contributed to an impulsive starting vortex.
Measurements of glottal jet velocity magnitudes generally agreed with earlier measurements using excised larynges. The average velocity fields from different vocal tract configurations were compared. A starting vortex was observed in all cases. In the false fold cases, the presence of the false folds in the vocal tract obstructed the downstream convection of the starting vortex. In asymmetric false fold cases, the side of the vortex nearest a false fold was prevented from developing with the opposing vortex. In the symmetric case, the false folds equally obstructed both sides of the starting vortex. In one case, a new vortex structure was seen to be shed from the surface of one of the false folds.
The jet core centerline was calculated. When the vocal tract was asymmetrically positioned with respect to the vocal fold model, the resulting jet centerline generally skewed toward the nearest wall in the vocal tract (no false fold) cases, but away from the nearest wall (and toward the vocal tract centerline) in the false fold cases. This effect was more pronounced at the higher pressures. Symmetric positioning of the vocal tract, with and without false folds, created jet centerline patterns that were generally similar to the open jet cases.
Finally, the rms velocity magnitudes, calculated from ensemble-averaged PIV measurements, clearly showed jet core (with relatively low ∣rms∣ values) and shear layer (with relatively high ∣rms∣ values) regions close to the glottal exit. Further downstream, the ∣rms∣ values increased and the jet core disappeared (as would be expected). The jets in the vocal tract cases contained higher ∣rms∣ values than in the open jet cases. When the false folds were included in the vocal tract, the ∣rms∣ values decreased to more closely match the open jet case. This suggests a potentially destabilizing influence of the vocal tract and a stabilizing influence of the false folds on the fluctuating glottal jet velocities in the vocal tract.
Several areas of future work are suggested, including comparison of the medial surface dynamics of one- and two-layer models, development of synthetic models with improved geometry (e.g., geometry derived from MRI data), investigation of the supraglottal jet with more anatomically correct supraglottal vocal tract geometry, and a more in-depth study of the cycle-to-cycle variations in the supraglottal jet issuing from symmetric and asymmetric models.
ACKNOWLEDGMENTS
This work was supported in part by NIH∕NIDCD Grant No. R01 05788. The authors gratefully acknowledge Jake Munger’s assistance in preparing the experimental setup and in testing material properties.
References
- Agarwal, M., Scherer, R., and Hollien, H. (2003). “The false vocal folds: Shape and size in frontal view during phonation based on laminagraphic tracings,” J. Voice 10.1016/S0892-1997(03)00012-2 17, 97–113. [DOI] [PubMed] [Google Scholar]
- Alipour, F., and Scherer, R. (1995). “Pulsatile airflow during phonation: An excised larynx model,” J. Acoust. Soc. Am. 10.1121/1.412233 97, 1241–1248. [DOI] [PubMed] [Google Scholar]
- Alipour, F., and Scherer, R. (2006). “Characterizing glottal jet turbulence,” J. Acoust. Soc. Am. 10.1121/1.2151809 119, 1063–1073. [DOI] [PubMed] [Google Scholar]
- Alipour, F., Scherer, R., and Knowles, J. (1996). “Velocity distributions in glottal models,” J. Voice 10.1016/S0892-1997(96)80018-X 10, 50–58. [DOI] [PubMed] [Google Scholar]
- Barney, A., Shadle, C., and Davies, P. (1999). “Fluid flow in a dynamic mechanical model of the vocal folds and tract. I. Measurements and theory,” J. Acoust. Soc. Am. 10.1121/1.424504 105, 444–455. [DOI] [Google Scholar]
- Chan, R., and Titze, I. (1997). “Further studies of phonation threshold pressure in a physical model of the vocal fold mucosa,” J. Acoust. Soc. Am. 10.1121/1.418331 101, 3722–3727. [DOI] [PubMed] [Google Scholar]
- Chan, R., and Titze, I. (2006). “Dependence of phonation threshold pressure on vocal tract acoustics and vocal fold tissue mechanics,” J. Acoust. Soc. Am. 10.1121/1.2173516 119, 2351–2362. [DOI] [PubMed] [Google Scholar]
- Drechsel, J. (2007). “Characterization of synthetic, self-oscillating vocal fold models,” Master’s thesis, Brigham Young University, Provo, UT. [Google Scholar]
- Erath, B., and Plesniak, M. (2006a). “An investigation of bimodal jet trajectory in flow through scaled models of the human vocal tract,” Exp. Fluids 10.1007/s00348-006-0106-0 40, 683–696. [DOI] [Google Scholar]
- Erath, B., and Plesniak, M. (2006b). “The occurrence of the Coanda effect in pulsatile flow through static models of the human vocal folds,” J. Acoust. Soc. Am. 10.1121/1.2213522 120, 1000–1011. [DOI] [PubMed] [Google Scholar]
- Erath, B., and Plesniak, M. (2006c). “An investigation of jet trajectory in flow through scaled vocal fold models with asymmetric glottal passages,” Exp. Fluids 10.1007/s00348-006-0196-8 41, 735–748. [DOI] [Google Scholar]
- Hirano, M., and Kakita, Y. (1985). “Cover-body theory of vocal fold vibration,” in Speech Science: Recent Advances, edited by Daniloff R. G. (College-Hill Press, San Diego), pp. 1–46. [Google Scholar]
- Hofmans, G. C. J., Groot, G., Ranucci, M., Graziani, G., and Hirschberg, A. (2003). “Unsteady flow through in-vitro models of the glottis,” J. Acoust. Soc. Am. 10.1121/1.1547459 113, 1658–1675. [DOI] [PubMed] [Google Scholar]
- Hsiao, T. Y., Liu, C. M., and Lin, K. N. (2002). “Videostrobolaryngoscopy of mucus layer during vocal fold vibration in patients with laryngeal tension-fatigue syndrome,” Ann. Otol. Rhinol. Laryngol. 111, 537–541. [DOI] [PubMed] [Google Scholar]
- Hsiung, M. W. (2004). “Videolaryngostroboscopic observation of mucus layer during vocal cord vibration in patients with vocal nodules before and after surgery,” Acta Oto-Laryngol. 10.1080/00016480310014859 124, 186–191. [DOI] [PubMed] [Google Scholar]
- Khosla, S., Muruguppan, S., Gutmark, E., and Scherer, R. (2007). “Vortical flow field during phonation in an excised canine larynx model,” Ann. Otol. Rhinol. Laryngol. 116, 217–228. [DOI] [PMC free article] [PubMed] [Google Scholar]
- Mongeau, L., Franchek, N., Coker, C., and Kubli, R. (1997). “Characteristics of a pulsating jet through a small modulated orifice, with application to voice production,” J. Acoust. Soc. Am. 10.1121/1.419864 102, 1121–1133. [DOI] [PubMed] [Google Scholar]
- Neubauer, J., Zhang, Z., Miraghaie, R., and Berry, D. (2007). “Coherent structures of the near field flow in a self-oscillating physical model of the vocal folds,” J. Acoust. Soc. Am. 10.1121/1.2409488 121, 1102–1118. [DOI] [PubMed] [Google Scholar]
- Pelorson, X., Hirschberg, A., van Hassel, R. R., and Wijnands, A. P. J. (1994). “Theoretical and experimental study of quasisteady-flow separation within the glottis during phonation. Application to a modified two-mass model,” J. Acoust. Soc. Am. 10.1121/1.411449 96, 3416–3431. [DOI] [Google Scholar]
- Riede, T., Tokuda, I. T., Munger, J. B., and Thomson, S. L. (2008). “Mammalian laryngeal air sacs add variability to the vocal tract impedance physical and computational modeling,” J. Acoust. Soc. Am. (in press). [DOI] [PMC free article] [PubMed]
- Scherer, R., Shinwari, D., De Witt, K., Zhang, C., Kucinschi, B., and Afjeh, A. (2001). “Intraglottal pressure profiles for a symmetric and oblique glottis with a divergence angle of 10 degrees,” J. Acoust. Soc. Am. 10.1121/1.1333420 109, 1616–1630. [DOI] [PubMed] [Google Scholar]
- Scherer, R., Titze, I., and Curtis, J. (1983). “Pressure-flow relationships in two models of the larynx having rectangular glottal shapes,” J. Acoust. Soc. Am. 10.1121/1.388959 73, 668–676. [DOI] [PubMed] [Google Scholar]
- Scherer, R. C. (1981). “Laryngeal fluid mechanics: Steady flow considerations using static models,” Ph.D. thesis, University of Iowa, Iowa City, IA. [Google Scholar]
- Shadle, C., Barney, A., and Thomas, D. (1991). “An investigation into the acoustics and aerodynamics of the larynx,” in Vocal Fold Physiology: Acoustic, Perceptual, and Physiological Aspects of Voice Mechanisms, edited by Gauffin J. and Hammarberg B. (Singular, San Diego), pp. 78–80. [Google Scholar]
- Shadle, C., Barney, A., and Davies, P. (1999). “Fluid flow in a dynamic mechanical model of the vocal folds and tract. II. Implications for speech production studies,” J. Acoust. Soc. Am. 10.1121/1.424574 105, 456–466. [DOI] [Google Scholar]
- Shinwari, D., Scherer, R., DeWitt, K., and Afjeh, A. (2003). “Flow visualization and pressure distributions in a model of the glottis with a symmetric and oblique divergent angle of 10 degrees,” J. Acoust. Soc. Am. 10.1121/1.1526468 113, 487–497. [DOI] [PubMed] [Google Scholar]
- Thomson, S. L., Mongeau, L., and Frankel, S. (2005). “Aerodynamic transfer of energy to the vocal folds,” J. Acoust. Soc. Am. 10.1121/1.2000787 118, 1689–1700. [DOI] [PubMed] [Google Scholar]
- Thomson, S. L., Mongeau, L., Frankel, S. H., Neubauer, J., and Berry, D. A. (2004). “Self-oscillating laryngeal models for vocal fold research,” Proceedings of the Eighth International Conference on Flow-Induced Vibrations, Ecole Polytechnique, Paris, France, 5–9 July 2004, Vol. 2, pp. 137–142.
- Tran, Q. T., Berke, G. S., Gerratt, B. R., and Kreiman, J. (1993) “Measurement of Young’s modulus in the in vivo human vocal folds,” Ann. Otol. Rhinol. Laryngol. 102, 584–591. [DOI] [PubMed] [Google Scholar]
- Titze, I. R. (1988).. “The physics of small-amplitude oscillation of the vocal folds,” J. Acoust. Soc. Am. 10.1121/1.411870 83, 1536–1552. [DOI] [PubMed] [Google Scholar]
- Titze, I., Schmidt, S., and Titze, M. (1995). “Phonation threshold pressure in a physical model of the vocal fold mucosa,” J. Acoust. Soc. Am. 10.1121/1.411870 97, 3080–3084. [DOI] [PubMed] [Google Scholar]
- Triep, M., Brücker, C., and Schröder, W. (2005). “High-speed PIV measurements of the flow downstream of a dynamic mechanical model of the human vocal folds,” Exp. Fluids 10.1007/s00348-005-1015-3 39, 232–245. [DOI] [Google Scholar]
- Zhang, Z., Mongeau, L., and Frankel, S. (2002a). “Experimental verification of the quasi-steady approximation for aerodynamic sound generation by pulsating jets in tubes,” J. Acoust. Soc. Am. 10.1121/1.1506159 112, 1652–1663. [DOI] [PubMed] [Google Scholar]
- Zhang, Z., Mongeau, L., Frankel, S., Thomson, S. L., and Park, J. (2004). “Sound generation by steady flow through glottis-shaped orifices,” J. Acoust. Soc. Am. 10.1121/1.1779331 116, 1720–1728. [DOI] [PubMed] [Google Scholar]
- Zhang, Z., Neubauer, J., and Berry, D. (2006a). “The influence of subglottal acoustics on laboratory models of phonation,” J. Acoust. Soc. Am. 10.1121/1.2225682 120, 1558–1569. [DOI] [PubMed] [Google Scholar]
- Zhang, Z., Neubauer, J., and Berry, D. (2006b). “Aerodynamically and acoustically driven modes of vibration in a physical model of the vocal folds,” J. Acoust. Soc. Am. 10.1121/1.2354025 120, 2841–2849. [DOI] [PubMed] [Google Scholar]
- Zhang, C., Zhao, W., Frankel, S. H., and Mongeau, L. (2002b). “Computational aeroacoustics of phonation. II. Effects of flow parameters and ventricular folds,” J. Acoust. Soc. Am. 10.1121/1.1506694 112, 2147–2154. [DOI] [PubMed] [Google Scholar]


