

Abstract
A common method for identifying collateral projections is to inject different retrograde tracers into two targets and examine labeled cells for the presence of both tracers. Double-labeled cells are considered to have collateral projections to the two injection sites. This method is widely considered to underestimate the extent of collaterals. To test the efficiency of double-labeling, we mixed equal volumes of two tracers, injected them into one site in a guinea pig brain, and counted the resulting labeled cells. Ideally, the tracers would have precisely overlapping injection sites and all labeled cells would contain both tracers.
We tested several combinations of tracers: 1) Fast Blue and fluorescein dextran; 2) fluorescein dextran and FluoroGold; 3) fluorescein dextran and FluoroRuby; 4) FluoroGold and green beads; 5) FluoroGold and red beads; 6) FluoroRuby and green beads; and, 7) green beads and red beads. For each combination, a mixture was injected into the left inferior colliculus. After one week to allow for transport, labeled cells were counted in the right inferior colliculus and the left temporal cortex. For each mixture, the results were similar for the two areas. The percentage of cells that were double-labeled varied from 0% to 100%, depending on tracer combination. The highest efficiencies (>96%) were observed with red beads and green beads or with FluoroRuby and fluorescein dextran. The limited efficiency of other mixtures could be accounted for only in part by incomplete overlap of the two tracers at the injection site. The results indicate that the specific combination of tracers used to search for collateral projections can greatly affect the findings.
Keywords: axon branching, fluorescent tracers, Fast Blue, FluoroGold, fluorescent microspheres, fluorescent dextran
The extent of axon collateralization is an important characteristic of any set of projections. The presence of collaterals could allow the same information to be sent to multiple sites or allow a single projection to coordinate activity in multiple areas. In contrast, a lack of collaterals indicates that the projections originate from different cells that may receive different inputs, process inputs in different ways, or be under differential control by outside inputs. The presence, and extent, of collaterals in a set of pathways can be examined with multiple methods, including antidromic stimulation, single axon reconstruction or multi-label retrograde tracing. The latter method, in which different tracers are injected into targets of interest and then individual cells are examined for the presence of multiple tracers, is a common approach made popular by the growing number of fluorescent tracers. There is general agreement that double-labeling with retrograde tracers underestimates the prevalence of collateral projections (e.g., Alheid et al., 1984; Fisher et al., 1986; Hallman et al., 1988; Schofield, 1991; Féger et al., 1994; Li and Mizuno, 1997; Doucet et al., 2003). Some studies have assessed the efficiency of double-labeling techniques by mixing two tracers together, injecting the mixture into the brain, and determining how many of the retrogradely-labeled cells contained both tracers. For example, Burger et al. (2005) injected a mixture of tetramethylrhodamine dextran (3k molecular weight) and Alexa 488 dextran (10k molecular weight) into chick brain in vitro. On average, 83% of the labeled cells contained both tracers; many cells were single-labeled with one or the other tracer. Coomes et al. (2005) obtained similar results with injections of a mixture of Fast Blue and red beads. Overall, the various studies suggest that collaterals may be underestimated and, further, that the results may depend on the particular combination of tracers used.
The present study examines the efficiency of retrograde multi-labeling with several tracers – FluoroGold (FG), red beads (RB), green beads (GB), FluoroRuby (FR), and fluorescein dextran (FD) – in a variety of combinations. Our results confirm that most combinations of tracers will underestimate the extent of collaterals and that some combinations are more effective than others.
EXPERIMENTAL PROCEDURES
Surgery
Eighteen guinea pigs of either sex, weighing 265 to 465 g, were used for this study. Twelve albino animals were obtained from Charles River Laboratories (Wilmington, MA) and six pigmented animals were obtained from Elm Hill Laboratories (Chelmsford, MA). All procedures conformed to NIH guidelines and were approved by the Institutional Animal Care and Use Committee. For surgery, each animal was anesthetized either with halothane (3% for induction, 1.5–2.5% for maintenance) in a mixture of oxygen and nitrous oxide or with isoflurane (5% for induction, 1.75–2.25% for maintenance) in oxygen. Atropine (0.08 mg/kg, i.m.) was administered to reduce bronchial secretions. MoistureEyes (Bausch and Lomb) was placed in each eye to protect the cornea. The scalp was shaved and disinfected. The animal was then placed on a feedback-controlled heating pad to maintain normal body temperature and the animal’s head was positioned in a stereotaxic frame. The scalp was incised and a long-lasting local anesthetic (0.25% bupivacaine with epinephrine 1:200,000) was injected into the wound margins. A small hole was drilled in the skull to allow insertion of a microsyringe or micropipette into the inferior colliculus (IC) (described below). Following injection of the tracers, the scalp was sutured. Ketoprofen (3 mg/kg, i.m.) was administered to provide postoperative analgesia. The animal was returned to its cage and monitored until it regained the ability to walk.
Table 1 lists the tracers that were used, their stock concentrations and their fluorescence characteristics. In all cases, mixtures were made by combining equal volumes of tracers, using stock solutions at “standard” concentrations (i.e., those generally used for tracing experiments; Table 1, “Solution”). Table 2 summarizes the combinations of tracers that were used and the method of injection in each animal. For most experiments, the tracer mixture was injected with a 1.0 μl Hamilton syringe used only for that particular tracer mixture. For each experiment, the mixture was injected at two sites, separated by 0.3 mm, along a single penetration in the left IC. At each site, 0.2 μl of the mixture was injected over a period of 2–3 minutes. After each injection, the syringe was left in place for 2 minutes before being moved. For micropipette injections, a micropipette (inside diameter 30 μm) was attached to a Nanoliter injector (WPI, Inc). As for injections with a microsyringe, deposits were made at two sites separated by 0.3 mm along a single penetration in the IC. Each site received two injections of 23 nl each, with a two-minute pause after each injection. Total tracer injections per animal were thus 0.4 μl for injections with a microsyringe and 96 nl for injections with a micropipette.
Table 1.
List of tracers and fluorescence filters used.
| Tracer | Fast Blue | fluorescein dextran | FluoroGold | green beads | red beads | tetramethyl rhodamine dextran |
|---|---|---|---|---|---|---|
| Abbreviation | FB | FD | FG | GB | RB | FR |
| Synonyms | Fluoro-Emerald, fluorescein dextran amine, FDA | green Retrobeads, green fluorescent microspheres | red Retrobeads, red fluorescent microspheres | FluoroRuby, rhodamine dextran amine, RDA | ||
| Source | Sigma * Cat# F-5756 | Invitrogen Cat# D-1821 (10k MW) | Fluorochrome, Denver, CO | LumaFluor, Naples, FL | LumaFluor, Naples, FL | Invitrogen Cat# D-1817 (10k MW) |
| Solution | 5% in water | 10% in saline | 4% in water | shipped in solution; used undiluted | shipped in solution; used undiluted | 10% in saline |
| Excitation color | UV | blue | UV | blue | green | green |
| Emission color | blue | green | yellow | green | red | red |
| Zeiss filter set # | 02 | 09 | 02 | 09 | 15 | 15 |
| Excitation (nm) | 365 | BP 450–490 | 365 | BP 450–490 | BP 540–552 | BP 540–552 |
| Beamsplitter (nm) | 395 | 510 | 395 | 510 | 580 | 580 |
| Emission (nm) | LP 420 | LP 515 | LP 420 | LP 515 | LP 590 | LP 590 |
currently available from EMS-Chemie GmbH, Gross-Umstadt, Germany.
Abbreviations: BP – bandpass; LP – long pass; MW – molecular weight; UV -ultraviolet.
Table 2.
List of mixtures of tracers that were injected into each animal and the method used for injection.
| Tracer 1 | Tracer 2 | Injection method | Case # |
|---|---|---|---|
| FB | FD | S | GP489 |
| FB | FD | S | GP491 |
| FD | FG | S | GP488 |
| FD | FG | S | GP490 |
| FD | FR | S | GP431 |
| FD | FR | S | GP432 |
| FD | FR | S | GP486 |
| FG | GB | P | GP438 |
| FG | GB | P | GP439 |
| FG | RB | S | GP429 |
| FG | RB | S | GP430 |
| FR | GB | S | GP433 |
| FR | GB | S | GP434 |
| FR | GB | P | GP436 |
| FR | GB | P | GP437 |
| GB | RB | S | GP427 |
| GB | RB | S | GP428 |
| GB | RB | S | GP485 |
Abbreviations: FB – fast blue; FD – fluorescein dextran; FG – FluoroGold; FR –FluoroRuby; GB – green beads; P – micropipette; RB – red beads; S –microsyringe.
Perfusion and Histology
After 7 days, the animal received an overdose of sodium pentobarbital (440 mg/kg, i.p.). After disappearance of withdrawal reflexes and cessation of breathing, a cannula was inserted through the left ventricle into the aorta. The right atrium was opened and the vascular system was perfused briefly with Tyrode’s solution (pH 7.4) followed by approximately 350 ml of 4% paraformaldehyde in 0.1M phosphate buffer (pH 7.4) and then 350 ml of the same fixative with 10% sucrose. The brain was then removed, placed in fixative with 30% sucrose, and stored overnight at 4°C.
Each brain was frozen and cut into 50 μm thick transverse sections with a sliding microtome. The sections were collected in six series; at least 3 series were mounted on gelatin-coated slides, air-dried overnight, coverslipped with DPX (Aldrich), and then stored at 4°C. In some cases, 1 additional series was stained with thionin.
Data analysis and photography
Sections were viewed with a Zeiss Axioplan 2 fluorescence microscope. Each tracer was viewed independently with the appropriate filter set (Table 1). The locations of labeled cells were plotted with a Neurolucida system attached to the microscope (MBF Bioscience, Williston, VT). Different markers were used to indicate cells that contained the first tracer, the second tracer, or both tracers. Labeled cells were analyzed in two areas: right (i.e., contralateral) IC, and left (i.e., ipsilateral) temporal cortex. For the IC, cells were plotted in every sixth section through the entire IC (Fig. 1A). In temporal cortex, labeled cells in layer V were plotted in 5 sections, spaced 300 μm apart, starting with a section located near the rostral end of the temporal lobe (Fig. 1B). Cortical layers were distinguished according to previously described criteria (Schofield et al., 2006) using adjacent thionin-stained sections or, in some cases, by removing the coverslip and staining the plotted sections with thionin. After cells and architectonic borders were drawn, the plots were arranged in NeuroExplorer (MBF Bioscience) and then exported to Adobe Illustrator for final figure construction.
Figure 1.

Plots showing an injection site and distribution of analyzed cells in a representative case (GP491). A. Drawings of transverse sections through the midbrain; sections are numbered from rostral to caudal (b1 – b4). Sections are spaced 300 μm apart. A mixture of Fast Blue (FB) and fluorescein dextran (FD) was injected into the left IC; the distribution of each tracer is shown by the filled contours. The FB diffused farther than the FD except in one small area (green arrow in section b1). The right IC in each section contains colored symbols, each of which indicates a single cell labeled as described in the legend. The area within the box in section b1 is shown in the inset to illustrate the intermixing of cells with different labeling patterns. The number of labeled cells (n) is shown for each type in the legend. B. Plots of labeled cells in the ipsilateral temporal cortex in the same case illustrated in A. Conventions as in A. Legend lists numbers of labeled cells in the cortical sections. Aq – cerebral aqueduct; ps – pseudosylvian sulcus; rs – rhinal sulcus
For quantitative analysis, cells in the IC and the temporal cortex were analyzed separately. The double-labeled cells were expressed as a percentage of the cells that contained each tracer. For example, after an injection of tracers A and B, the double-labeled cells were expressed as a percentage of all cells that contained A and also as a percentage of all cells that contained B. A single animal thus yielded two values for cells in the IC and two values for cells in the temporal cortex.
Photomicrographs of injection sites and labeled cells were taken with an Optronics Magnafire camera mounted on a Zeiss Axioskop or with a Zeiss Axiocam HRm mounted on a Zeiss Imager Z1 microscope. Photomicrographs of injection sites were taken through the apparent center of the injections. Images collected with the Axiocam HRm were captured in monochrome and pseudocolored with Zeiss Axiovision 4.0 software. Adobe Photoshop CS2 was used to adjust brightness, contrast and color balance, to overlay images taken with different filters, and to add labels.
RESULTS
The results were similar in IC and temporal cortex. No differences were apparent between albino and pigmented animals. Most of the injections were made with microsyringes and the majority of the data are from these cases. In four cases, injections were made with micropipettes. Results from these cases are described along with those from microsyringe injections. For a given combination of tracers, the results across animals were similar. However, different tracer combinations yielded very different results. The results could be grouped into three general patterns: nearly all cells were double-labeled; some cells were double-labeled; virtually no cells were double-labeled.
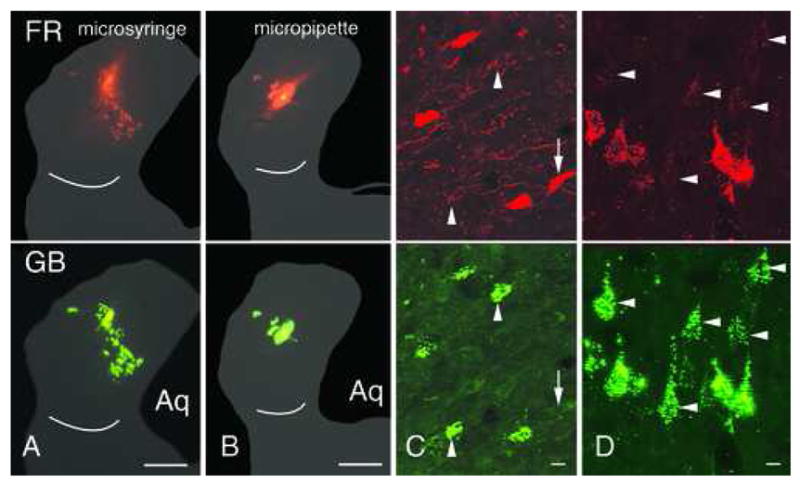
Combinations that yielded nearly complete double-labeling
Two tracer mixtures produced almost exclusively double-labeled cells: 1) green beads and red beads; and, 2) FluoroRuby and fluorescein dextran. Figure 2 shows results from cases in which two dextrans were injected. The injection site typically was small for all our dextran injections (Fig. 2A). The spread of the two tracers was indistinguishable; i.e., the injection sites for the two tracers appeared to overlap completely. Figures 2B and 2C show labeled cells in the IC and temporal cortex; the latter photograph was selected to show that single-labeled cells were present. The scarcity of single-labeled cells is summarized in Table 3. In the IC in case GP431, there were 397 double-labeled cells, 15 that were single-labeled with FluoroRuby (FR), and 1 that was single-labeled with fluorescein dextran (FD). In the cortical sections that were analyzed, there were 14 FR-only cells and no FD-only cells among 432 double-labeled cells. The double-label ratios thus ranged from 96.4% to 100% in this case. The same experiment was performed in case GP432, with similar results: the ratios ranged from 99.0% to 100%.
Figure 2.
Photomicrographs of a co-injection of FluoroRuby (FR) and fluorescein dextran (FD) and retrogradely labeled cells. Each pair of images shows an area viewed with filters for FR (top panel) or FD (bottom panel). A. Injection site in the left inferior colliculus. The two tracers show similar spread and are confined to the inferior colliculus (white line indicates ventral border of the inferior colliculus). Dorsal is up; lateral is to the left; midline is located at the right edge of the image. B. Labeled cells in the right inferior colliculus. All three cells are double-labeled. C. Labeled cells in the left temporal cortex. Most cells are double-labeled. Arrowheads show two of the rare single-labeled cells. Scale bars: 1 mm (A); 10 μm (B, C). Aq – cerebral aqueduct. Cases GP432 (A, B); GP486 (C).
Table 3.
Summary of labeled cells in contralateral inferior colliculus and ipsilateral temporal cortex after injection of tracer mixture into the left inferior colliculus. Experiments are grouped according to tracer combinations injected. P – micropipette; S – microsyringe.
| Contralateral inferior colliculus |
Ipsilateral temporal cortex |
||||||
|---|---|---|---|---|---|---|---|
| Tracer mixture | Experiment # | Injection method | Tracer | # labeled cells | % double-labeled | # labeled cells | % double-labeled |
| FD/FR | GP431 | S | FD | 1 | 99.7 | 0 | 100.0 |
| FR | 15 | 96.4 | 14 | 96.9 | |||
| FD/FR | 397 | 432 | |||||
| GP432 | S | FD | 0 | 100.0 | 0 | 100.0 | |
| FR | 0 | 100.0 | 6 | 99.0 | |||
| FD/FR | 369 | 613 | |||||
| GB/RB | GP427 | S | GB | 8 | 99.4 | 4 | 99.8 |
| RB | 2 | 99.8 | 1 | 99.9 | |||
| GB/RB | 1292 | 1867 | |||||
| GP428 | S | GB | 25 | 98.6 | 99.5 | ||
| RB | 6 | 99.7 | 0 | 100.0 | |||
| GB/RB | 1709 | 1528 | |||||
| FB/FD | GP489 | S | FB | 1612 | 21.8 | 979 | 38.2 |
| FD | 230 | 66.2 | 257 | 70.2 | |||
| FB/FD | 450 | 606 | |||||
| GP491 | S | FB | 2233 | 43.3 | 203 | 85.6 | |
| FD | 2197 | 43.7 | 763 | 61.2 | |||
| FB/FD | 1702 | 1205 | |||||
| FD/FG | GP488 | S | FD | 47 | 91.1 | 41 | 90.9 |
| FG | 1275 | 27.4 | 725 | 36.2 | |||
| FD/FG | 480 | 412 | |||||
| GP490 | S | FD | 79 | 92.0 | 81 | 89.0 | |
| FG | 1872 | 32.7 | 612 | 51.8 | |||
| FD/FG | 910 | 658 | |||||
| FR/GB | GP433 | S | FR | 265 | 35.2 | 151 | 66.7 |
| GB | 953 | 13.1 | 1083 | 21.9 | |||
| FR/GB | 144 | 303 | |||||
| GP434 | S | FR | 203 | 51.3 | 169 | 65.4 | |
| GB | 2033 | 9.5 | 1599 | 16.7 | |||
| FR/GB | 214 | 320 | |||||
| GP436 | P | FR | 77 | 44.2 | 38 | 70.1 | |
| GB | 657 | 8.5 | 384 | 18.8 | |||
| FR/GB | 61 | 89 | |||||
| GP437 | P | FR | 35 | 34.0 | 28 | 54.1 | |
| GB | 997 | 1.8 | 782 | 4.0 | |||
| FR/GB | 18 | 33 | |||||
Similar results were obtained following injections of red and green beads (Table 3: cases GP427 and GP428), in which the double-label ratios ranged from 98.6% to 100%. As with the dextrans, the red and green beads appeared to diffuse equally, producing complete overlap of the “two” injection sites. The only notable difference between the dextran experiments and the bead experiments is that the latter cases regularly labeled more cells (Table 3).
Combinations that yielded limited double-labeling
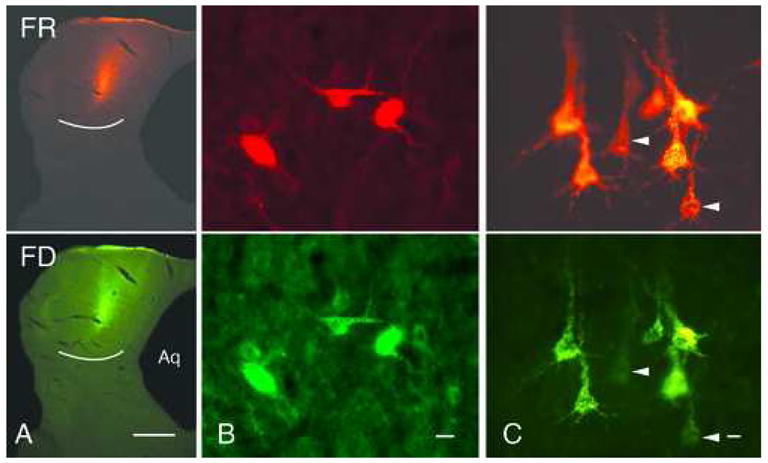
Three tracer mixtures produced double-labeled cells as well as substantial numbers of single-labeled cells. Injections of Fast Blue and fluorescein dextran always produced an injection site similar to that shown in Figure 3A. A large area is filled with Fast Blue. The center of that area shows clear damage. The extent of the fluorescein dextran was difficult to assess because of the brightness of the FB fluorescence and its visibility with the fluorescein filters. Furthermore, the intense brightness of both tracers made it difficult to obtain images that accurately represent both the center and the edges of the injection site. This issue was easier to assess in the microscope than in the printed images. It appeared that the FD spread less than the FB (see Fig. 1A for a reconstruction of the injection site in case GP491). There were FD-labeled cells in both the contralateral IC and the temporal cortex (Fig. 3B, C). Table 3 shows the quantitative summaries of the two cases with FB/FD injections. The percentage of FB-labeled cells that were double-labeled ranged from 21.8% to 85.6%. The appearance of cells labeled only with FB would be consistent with a greater spread of FB than FD at the injection site. It is more difficult to understand the occurrence of cells labeled only with FD. We found only a very small area of injection that appeared to contain FD and not FB in case GP491 (arrow in section b1, Fig. 1A), and no such area in case GP489. In other words, almost the entire area of FD injection also contained FB. One would predict in this situation that nearly all FD-labeled cells would be double-labeled. However, the double-label ratios for FD ranged from 43.7% to 70.2% in these two cases (Table 3). Possible reasons for this “under-labeling” are discussed below.
Figure 3.
Photomicrographs of injection sites and retrogradely labeled cells after co-injections of Fast Blue (FB) and fluorescein dextran (FD) (A–C) or FluoroGold (FG) and FD (D–F). AC. Each pair of images shows an area viewed with filters for FB (top panel) or FD (bottom panel). A. Injection site in the left inferior colliculus (white line indicates ventral border of the inferior colliculus). Dorsal is up; lateral is to the left; midline is located at the right edge of the image. B, C. Labeled cells in the right inferior colliculus (B) or left temporal cortex (C). Cells are double- or single-labeled. Arrows: cells that contain only FB; arrowheads: cells that contain only FD. D. Injection site in the left inferior colliculus (white line indicates ventral border of the inferior colliculus). Dorsal is up; lateral is to the left; midline is located at right edge of image. E, F. Labeled cells in the right inferior colliculus (E) or left temporal cortex (F). Cells are double- or single-labeled. Arrows: cells that contain only FD; arrowheads: cells that contain only FG. Scale bars: 1 mm (A, D); 10 μm (B, C, E, F). Aq – cerebral aqueduct. Cases GP491 (A); GP489 (B, C); GP490 (D–F).
A second tracer mixture – fluorescein dextran and FluoroGold – also gave limited double-labeling. Figure 3D shows a representative injection site, which shares many similarities with the FB/FD injections. The FG appeared to spread much like the Fast Blue and the FD was confined to a smaller area. The center of the injection site showed clear damage. The double-label ratio for FG ranged from 27.4% to 51.8% (Table 3). In both cases, the FG appeared to completely cover the FD injection area, and one would predict 100% double-label of the FD cells. In fact, the double-label ratio for FD ranged from 89.0% to 92.0%. The “under-labeling” was always present but was less dramatic (and less variable) than that observed with the FB/FD combination.
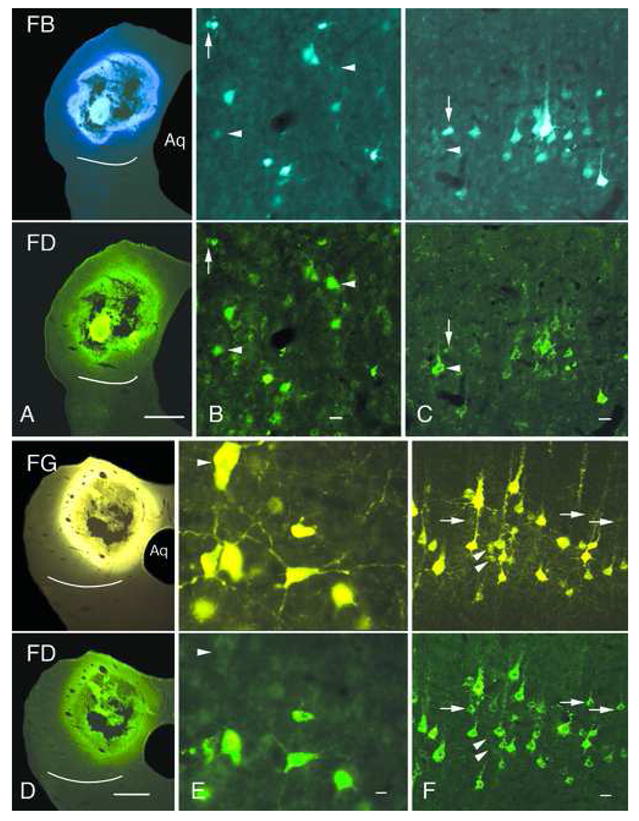
The final tracer mixture that produced limited double-labeling was FluoroRuby and green beads. We tested this mixture with both microsyringe and micropipette injections (Fig. 4A, B). The results were similar for both injection methods. In all cases, the green beads labeled many more cells than the FluoroRuby, and the double-label ratio for the green beads ranged from 1.8% to 21.9% (Table 3). The FluoroRuby labeled fewer cells, and the FR double-label ratio ranged from 34.0% to 70.1%.
Figure 4.
Photomicrographs of injection sites and retrogradely labeled cells after co-injections of FluoroRuby (FR) and green beads (GB). A, B. Co-injections made with a microsyringe (A) or a micropipette (B). C, D. Labeled cells in the right inferior colliculus (C) or left temporal cortex (D). Cells are double- or single-labeled. Arrows: cells that contain only FR; arrowheads: cells that contain only GB. Scale bars: 1 mm (A, B); 10 μm (C, D). Aq –cerebral aqueduct. Cases GP433 (A); GP436 (B–D).
Combinations that yielded no double-labeling
Two combinations of tracers yielded no double-labeled cells: FluoroGold/green beads and FluoroGold/red beads. Figure 5A shows an injection site resulting from injection of FG and RB. The FG image looks similar to those described above, with a large area of FG that surrounds an area of damaged tissue. The red beads are limited to a very small area on the edge of the damaged region. We were unable to find any red bead-labeled cells in this case (even in the injected IC, near the injection site). FG-labeled cells were present in both the contralateral IC and ipsilateral temporal cortex, indicating that transport occurred at least for FG (Fig. 5B). Figure 5C shows an injection of FG/GB that was made through a micropipette. We tried this approach in hopes of reducing or eliminating the damage that appeared with the microsyringe injections. The resulting injections were much smaller, and showed no obvious signs of damage. The greater diffusion of FG versus GB was also particularly clear in these cases (Fig. 5C). However, the resulting label was the same: FG-labeled cells were present in both the right IC and the left temporal cortex, but no GB-labeled cells could be found in these areas.
Figure 5.
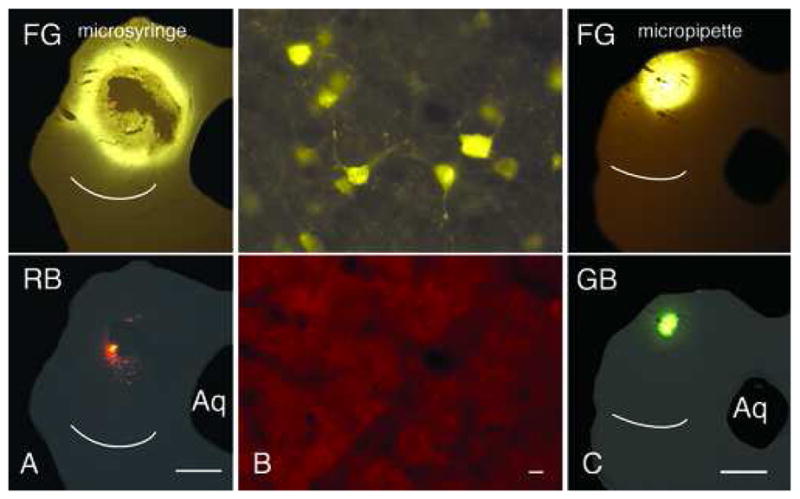
Photomicrographs of injection sites that produced no double-labeled cells. A. Injection site after co-injection with a microsyringe of FluoroGold (FG; upper panel) and red beads (RB; lower panel). B. Labeled cells in the right inferior colliculus. Many cells were labeled with FG (upper panel); none of these cells were labeled with RB (lower panel). C. Injection site after co-injection through a micropipette of FG (upper panel) and green beads (GB; lower panel). Scale bars: 1 mm (A, C); 10 μm (B). Aq – cerebral aqueduct. Cases GP429 (A); GP430 (B); GP439 (C).
DISCUSSION
We examined the double-labeling efficiency of several combinations of fluorescent anatomical tracers in two pathways in guinea pigs. An ideal result in our experiments would be 100% double-labeled cells. In fact, our results ranged from 0% to 100% double-labeled cells. In the following sections, we discuss a number of reasons for incomplete double-labeling and compare our results to previous studies.
Factors that limit double-labeling
We obtained 100% double-labeling on five occasions: one with GB/RB tracers and four with FD/FR tracers (Table 3). Our “worst” result in this collection of cases was 96.4% (GP431, FR, contralateral IC). This indicates that single-labeled cells were observed. Even our “best” animal (GP432), had some single-labeled cells: 6 out of 613 labeled cells in temporal cortex contained only FR. Not surprisingly, the injection site in each of these cases showed apparently complete overlap of the two tracers (of course, a small area of non-overlap could have gone unseen and may explain some of the single-labeled cells). Nonetheless, the combinations of green and red beads or green and red dextrans (FD and FR) appear to give nearly ideal results.
At the opposite end of the scale, we had several combinations of tracers that yielded no double-labeled cells. This occurred when we combined FG with green or red beads. In each case, there were many FG-labeled cells, but no bead-labeled cells. Looking at the injection site suggests first that the center of the site has considerable damage; a “dead” zone. Kuypers and Huisman (1984) describe a similar area of necrosis following pressure injections of numerous fluorescent tracers. The trauma was not due simply to the microsyringe needle, because we made similar injections of beads or dextrans and did not observe similar damage (e.g., Figs. 2A, 4A). If the beads, which do not diffuse as far as FG, were confined to this dead zone, it would not be surprising to have no retrograde transport of beads. In fact, our early findings with the microsyringe injections prompted our experiments with micropipette injections, in the hopes of minimizing damage and perhaps obtaining better results. The resulting injections showed no obvious sign of damage (e.g., GP439, Fig. 5C), but there was still no transport of the beads. Apparently there is some degree of toxicity, or a competition between the FG and the beads for uptake or transport, such that FG prevents retrograde labeling with the beads. Notably, we did obtain double-labeling with a combination of FG and FD (Fig. 3E–F), and these injections with a microsyringe also yielded a site with an apparent dead zone in the center (Fig. 3D). It is clear from our work and that of others (Dado et al., 1990) that damage is not necessary to achieve uptake and transport of the injected tracers. We do not know the time course of the damage, and the mechanism of FD labeling is unclear (e.g., does uptake occur before the axons are damaged by toxic effects of FG, or perhaps the damage enhances uptake?). Any explanation would have to account for differences between the beads and FD. Whatever the explanation, the significance for double-labeling efficiency is limited. Each of these tracers works very well for labeling pathways; and the interactions between tracers that appeared to take place in the present experiments would not occur when the two tracers are injected at different sites. We conclude that co-injecting a mixture of tracers is simply inadequate for assessing double-label efficiency with some tracer combinations. Indeed, FG and red or green beads have been injected into different targets with successful double-labeling of collaterals (e.g., Schofield, 1991; Schofield and Cant, 1992). The combined use of FG and beads remains a viable approach.
Our most common finding was intermediate between the two extremes described above, with generally large numbers of both single- and double-labeled cells. Some of the variation among these cases is readily explained by injections that were not co-extensive (due to different diffusion properties for specific tracers). The lowest efficiencies in this group were associated with FR/GB injections (Table 3). In these cases, the GB spread farther than the FR, and one would predict many GB-only cells and thus a low percentage of double-label for the GB cells. The data confirm this expectation, with double label values ranging from 1.8% to 21.9%. On the other hand, the FR was generally distributed within the GB injection site. One would predict that all the FR-labeled cells would also contain GB, but this was not the case; the double-labeled values ranged from 34.0% to 70.1%. We found similar results with FB/FD mixtures and FD/FG mixtures. In each case, errors in assessing the boundaries of an injection site may account for some of the inefficiency. However, it seems likely that one or both of the tracers are imperfect in that they do not label every cell whose axon terminates in the injection site. This issue would be applicable to a collateral labeling experiment in which the two tracers are injected in different targets, and is generally considered a reason for underestimating collaterals with this technique. A different issue, applicable to injections of tracer mixtures, is the possibility that the two tracers interact in some way; some possibilities associated with toxicity were discussed above, and others include competition for uptake by axons or for retrograde transport mechanisms after uptake. These possibilities have been raised in previous studies (e.g., Kuypers and Huisman, 1984; Deng and Rogers, 1999), and represent a limitation of the co-injection method for assessing double-label efficiency.
Comparison with previous studies
There have been many studies of the transport and labeling properties of fluorescent tracers. Most of these examine issues of sensitivity (i.e., how many cells are labeled by a tracer), toxicity of a tracer to retrogradely-labeled cells, or usefulness for long-term labeling (e.g., does the tracer fade or leak out of the cells over time). To the best of our knowledge, there have been very few experiments assessing retrograde double-label efficiency as done in the present study. Sometimes, such experiments are included as part of a larger study on collaterals. Apps and Garwicz (2000) used RB and GB to study olivocerebellar projections in cats. They injected a mixture of the tracers into the cerebellum in one cat. All the labeled cells in the inferior olive were double-labeled. This 100% efficiency matches our own data on the high efficiency of RB and GB in the pathways that we studied. In another recent study, Burger et al. (2005) injected a mixture of tracers in to the chick brainstem to assess double-label efficiency. They used two dextrans different from the ones used in the present study. The first tracer was 3000 molecular weight tetramethyl rhodamine dextran, which is similar to FR except for molecular weight of the dextran. A difference in molecular weight confers different properties on the tracers (e.g., Kaneko et al., 1996), and so one cannot generalize about tracer efficiency. The second tracer was 10k molecular weight dextran linked to AlexaFluor 488 (Molecular Probes), a green fluorescent tag similar to fluorescein. This tracer is similar to FD in having a green fluorescent molecule attached to a 10k MW dextran, but again conclusions about one tracer cannot be generalized because addition of a fluorescent tag (or other molecule) to the dextran can affect tracer properties (Kaneko et al., 1996; Novikova et al., 1997). Burger and colleagues assessed double-label efficiency in five experiments. They observed double-label ranging from 69.9% to 98.9% (average: 83.4%). They describe near-complete overlap of the tracers in the injection site, so the incomplete double-labeling must be due to inefficiency of the individual tracers. They conclude that the double-label method will underestimate collaterals in a projection.
Strategies to maximize success in double-labeling studies
How does one choose tracers for an experiment to identify collateral projections? The current study suggests that the best results might be achieved with GB and RB or with FR and FD. Similar results might be achieved with the dextran conjugates used by Burger et al. (2005, discussed above). These combinations have the potential to label 100% of cells with collateral projections, provided the injections are “co-extensive”. Of course, obtaining and assessing injections in two different targets is problematic. The difficulties may not be too great when one injects the same structure on left and right sides of the brain (e.g., left and right inferior colliculus), but are more significant when one injects different structures (such as one inferior colliculus and one cochlear nucleus). The ideal situation would be injections that completely, and precisely, fill the entire target (assuming that this is the best way to label all the cells of a pathway). For a large target, this can be accomplished by making large injections, by making injections at multiple sites within the target, and by choosing a tracer that diffuses readily. This factor is one of the main benefits of FG and FB, both of which show greater diffusion than the beads (RB and GB) or the dextrans (FR and FD). The limited diffusion of the latter tracers may make them preferable for small targets, or for targets that are bordered by structures that could confound interpretation of results if they are injected (if, for example, the adjacent area also receives projections from the cells to be analyzed). If adjacent structures do not receive projections from the cells of interest, then one can use large injections that spread into the adjacent structure in order to maximize filling of the intended target. In practice, it is rarely possible to make an injection that completely, and exclusively, fills the target of interest. Even if such an injection is obtained, one cannot be certain that all the afferents will be labeled by the tracer; thus, collaterals are likely to be underestimated.
Another factor that affects choice of tracers is the ability to distinguish the two tracers in the microscope. In early studies, it was common to use tracers that were viewed with a single filter set and were distinguished by color and/or by distribution within a cell (discussed by Kuypers and Huisman, 1984). A popular choice involved one of several tracers that labeled the nucleus yellow (e.g., nuclear yellow, diamidino yellow) combined with a second tracer that labeled the cytoplasm blue (e.g., true blue, Fast Blue). The two tracers were viewed with a single filter set, and double-labeled cells were identified by the differential color and distribution –cytoplasm vs. nucleus – of the tracers. However, several studies have pointed out that these tracers are not always confined to the expected cellular compartment. Illert et al. (1982) showed that nuclear yellow can sometimes label the cytoplasm. Fast Blue, which usually labels the cytoplasm, can sometimes label the nucleus preferentially (Aschoff and Holländer, 1982: Kuypers and Huisman, 1984). For this reason, it is recommended to use tracers that are visualized with different filters (even then, one must be attentive to “crossover”, in which a tracer that is particularly bright can be seen in the “inappropriate” filter). It follows that it is important to choose the best filters for the tracers that are being used.
The sensitivity of individual tracers is also important. There are a number of reviews of the relative efficacy of tracers, comparing various fluorescent tracers to one another and, in some cases, to non-fluorescent tracers (e.g., Aschoff and Holländer, 1982; Illert et al., 1982; Kuypers and Huisman, 1984; Richmond et al., 1994; Novikova et al., 1997; Köbbert et al., 2000; Choi et al., 2002). It is particularly important to assess the sensitivity of the tracers for labeling the particular pathways under study. Güntürkün et al. (1993) compared rhodamine B and Fast Blue and found that the latter tracer failed to label two pathways that were labeled by the rhodamine B. Deng and Rogers (1999) examined labeling of chick visual pathways with rhodamine, true blue, FG and red and green beads. They found that some pathways were labeled by all the tracers, whereas other pathways were labeled by some tracers and not by others. One approach to minimizing the limitations associated with any given tracer is to use different combinations of tracers in different animals and/or to alternate which tracer is injected into a given target. For example, if one is interested in projections to targets A and B, one could use red beads and green beads in a series of animals, with A receiving injections of red beads in a first set of animals and green beads in a second set. A third set of animals could receive injections of two different dextrans, or perhaps Fast Blue and a dextran. The use of multiple combinations may be particularly important when using tracers that have significantly different properties, such as FG and RB.
Other methods for identification of axon collaterals
There are, of course, other approaches for identifying collateral projections. There are fluorescent tracers other than those tested here (e.g., 3000 MW fluorescein dextran, diamidino yellow), as well as non-fluorescent tracers such as cholera toxin B (Lanciego et al., 1998). A different approach is to use single-unit recording and antidromic stimulation. In this method, one records from a cell and stimulates in two (or more) targets to which the cell might project. If the cell is activated antidromically from both targets, then one concludes that the axon sends collateral branches to both stimulation sites. This method shares many of the limitations of double retrograde tracing: difficulty in stimulating all the axons that terminate in an area (comparable to tracer sensitivity and injection site size), spread of electrical current (comparable to spread of tracer) to adjacent structures, and susceptibility to axons of passage, whereby an axon that traverses a site could be stimulated (or labeled by a tracer) even though it does not terminate in that area. An advantage of the physiological approach is that one can often record other properties of the cell, such as the receptive field properties for a sensory cell. It has been argued that the retrograde tracer method could reveal a greater percentage of collateral projections than the antidromic stimulation technique (e.g., Alheid et al., 1984), but it is clear that both methods are likely to underestimate the actual value. In some respects, a more satisfying result is obtained by labeling and reconstruction of individual axons, allowing direct visualization of an axon and its branches. This approach requires that an axon be completely labeled and then followed, often across many histological sections, to its terminations. For some studies, numerous axons can be labeled by small extracellular injections, and each animal may yield several axons (e.g., Muly and Fitzpatrick, 1992). In other studies, an axon (or its cell of origin) must be labeled by intracellular (or juxtacellular) injection (e.g., Deschênes et al., 1994). While this approach can allow correlation of physiological properties with projection patterns, the required amount of time and labor usually results in a relatively small number of axons reconstructed. Furthermore, the success of this approach declines rapidly as it is applied to longer pathways. The retrograde double-labeling methods remain the best choice for longer pathways. In addition, the retrograde tracing techniques allow assessment of a large number of cells (easily hundreds to thousands per animal), meaning that projection patterns that characterize a small percentage of cells can be revealed. In many cases, it could be argued that the best approach would be to obtain “population” data with retrograde multi-labeling methods and to confirm and supplement those data with single axon reconstructions.
In summary, our results confirm that most combinations of tracers will underestimate the extent of collateral projections. Nonetheless, the limitations can be minimized by careful selection of tracers and, when feasible, the use of multiple combinations of tracers. With careful experimental design, the multi-labeling method is likely to provide the best approach for characterizing the projection patterns of a large number of cells, and of revealing projection patterns that characterize a minority of cells in a population.
Acknowledgments
This research was supported by NIH grant DC04391 to BRS. We thank Ark Slusarczyk and Colleen Sowick for expert technical assistance. Special thanks to Jeff Wenstrup for comments on an earlier version of the manuscript.
List of Abbreviations
- Aq
cerebral aqueduct
- FB
Fast Blue
- FD
fluorescein dextran
- FG
FluoroGold
- FR
FluoroRuby (tetramethylrhodamine dextran)
- GB
green beads
- IC
inferior colliculus
- ps
pseudosylvian sulcus
- RB
red beads
- rs
rhinal sulcus
Footnotes
Publisher's Disclaimer: This is a PDF file of an unedited manuscript that has been accepted for publication. As a service to our customers we are providing this early version of the manuscript. The manuscript will undergo copyediting, typesetting, and review of the resulting proof before it is published in its final citable form. Please note that during the production process errors may be discovered which could affect the content, and all legal disclaimers that apply to the journal pertain.
References
- Alheid GF, Carlsen J, De Olmos J, Heimer L. Quantitative determination of collateral anterior olfactory nucleus projections using a fluorescent tracer with an algebraic solution to the problem of double retrograde labeling. Brain Res. 1984;292:17–22. doi: 10.1016/0006-8993(84)90885-0. [DOI] [PubMed] [Google Scholar]
- Apps R, Garwicz M. Precise matching of olivo-cortical divergence and cortico-nuclear convergence between somatotopically corresponding areas in the medial C1 and medial C3 zones of the paravermal cerebellum. Eur J Neurosci. 2000;12:205–214. doi: 10.1046/j.1460-9568.2000.00897.x. [DOI] [PubMed] [Google Scholar]
- Aschoff A, Holländer H. Fluorescent compounds as retrograde tracers compared with horseradish peroxidase (HRP). I. A parametric study in the central visual system of the albino rat. J Neurosci Methods. 1982;6:179–197. doi: 10.1016/0165-0270(82)90083-8. [DOI] [PubMed] [Google Scholar]
- Burger RM, Cramer KS, Pfeiffer JD, Rubel EW. Avian superior olivary nucleus provides divergent inhibitory input to parallel auditory pathways. J Comp Neurol. 2005;481:6–18. doi: 10.1002/cne.20334. [DOI] [PubMed] [Google Scholar]
- Choi D, Li D, Raisman G. Fluorescent retrograde neuronal tracers that label the rat facial nucleus: a comparison of Fast Blue, Fluoro-Ruby, Fluoro-Emerald, Fluoro-Gold and DiI. J Neurosci Methods. 2002;117:167–172. doi: 10.1016/s0165-0270(02)00098-5. [DOI] [PubMed] [Google Scholar]
- Coomes DL, Schofield RM, Schofield BR. Unilateral and bilateral projections from cortical cells to the inferior colliculus in guinea pigs. Brain Res. 2005;1042:62–72. doi: 10.1016/j.brainres.2005.02.015. [DOI] [PubMed] [Google Scholar]
- Dado RJ, Burstein R, Cliffer KD, Giesler GJ., Jr Evidence that Fluoro-Gold can be transported avidly through fibers of passage. Brain Res. 1990;533:329–333. doi: 10.1016/0006-8993(90)91358-n. [DOI] [PubMed] [Google Scholar]
- Deng C, Rogers LJ. Differential sensitivities of the two visual pathways of the chick to labelling by fluorescent retrograde tracers. J Neurosci Methods. 1999;89:75–86. doi: 10.1016/s0165-0270(99)00044-8. [DOI] [PubMed] [Google Scholar]
- Deschênes M, Bourassa J, Pinault D. Corticothalamic projections from layer V cells in rat are collaterals of long-range corticofugal axons. Brain Res. 1994;664:215–219. doi: 10.1016/0006-8993(94)91974-7. [DOI] [PubMed] [Google Scholar]
- Doucet JR, Molavi DL, Ryugo DK. The source of corticocollicular and corticobulbar projections in area Te1 of the rat. Exp Brain Res. 2003;153:461–466. doi: 10.1007/s00221-003-1604-4. [DOI] [PubMed] [Google Scholar]
- Féger J, Bevan M, Crossman AR. The projections from the parafascicular thalamic nucleus to the subthalamic nucleus and the striatum arise from separate neuronal populations: a comparison with the corticostriatal and corticosubthalamic efferents in a retrograde fluorescent double-labelling study. Neuroscience. 1994;60:125–132. doi: 10.1016/0306-4522(94)90208-9. [DOI] [PubMed] [Google Scholar]
- Fisher RS, Boylan MK, Hull CD, Buchwald NA, Levine MS. Branched projections of cat sensorimotor cortex: multiple retrograde labeling via commissural corticocortical, decussated corticostriatal and undecussated corticostriatal axons. Brain Res. 1986;384:395–400. doi: 10.1016/0006-8993(86)91180-7. [DOI] [PubMed] [Google Scholar]
- Güntürkün O, Melsbach G, Hörster W, Daniel S. Different sets of afferents are demonstrated by the fluorescent tracers Fast Blue and Rhodamine. J Neurosci Methods. 1993;49:103–111. doi: 10.1016/0165-0270(93)90114-7. [DOI] [PubMed] [Google Scholar]
- Hallman LE, Schofield BR, Lin CS. Dendritic morphology and axon collaterals of corticotectal, corticopontine, and callosal neurons in layer V of primary visual cortex of the hooded rat. J Comp Neurol. 1988;272:149–160. doi: 10.1002/cne.902720111. [DOI] [PubMed] [Google Scholar]
- Illert M, Fritz N, Aschoff A, Holländer H. Fluorescent compounds as retrograde tracers compared with horseradish peroxidase (HRP). II. A parametric study in the peripheral motor system of the cat. J Neurosci Methods. 1982;6:199–218. doi: 10.1016/0165-0270(82)90084-x. [DOI] [PubMed] [Google Scholar]
- Kaneko T, Saeki K, Lee T, Mizuno N. Improved retrograde axonal transport and subsequent visualization of tetramethylrhodamine (TMR)-dextran amine by means of an acidic injection vehicle and antibodies against TMR. J Neurosci Methods. 1996;65:157–165. doi: 10.1016/0165-0270(95)00162-x. [DOI] [PubMed] [Google Scholar]
- Köbbert C, Apps R, Bechmann I, Lanciego JL, Mey J, Thanos S. Current concepts in neuroanatomical tracing. Prog Neurobiol. 2000;62:327–351. doi: 10.1016/s0301-0082(00)00019-8. [DOI] [PubMed] [Google Scholar]
- Kuypers HGJM, Huisman AM. Fluorescent neuronal tracers. In: Federoff S, editor. Advances in Cellular Neurobiology. Vol. 5. Academic Press; New York: 1984. pp. 307–340. [Google Scholar]
- Lanciego JL, Luquin MR, Guillen J, Gimenez-Amaya JM. Multiple neuroanatomical tracing in primates. Brain Res Protoc. 1998;2:323–332. doi: 10.1016/s1385-299x(98)00007-5. [DOI] [PubMed] [Google Scholar]
- Li H, Mizuno N. Collateral projections from single neurons in the dorsal column nuclei to the inferior colliculus and the ventrobasal thalamus: a retrograde double-labeling study in the rat. Neurosci Lett. 1997;225:21–24. doi: 10.1016/s0304-3940(97)00183-3. [DOI] [PubMed] [Google Scholar]
- Muly EC, Fitzpatrick D. The morphological basis for binocular and ON/OFF convergence in tree shrew striate cortex. J Neurosci. 1992;12:1319–1334. doi: 10.1523/JNEUROSCI.12-04-01319.1992. [DOI] [PMC free article] [PubMed] [Google Scholar]
- Novikova L, Novikov L, Kellerth JO. Persistent neuronal labeling by retrograde fluorescent tracers: a comparison between Fast Blue, Fluoro-Gold and various dextran conjugates. J Neurosci Methods. 1997;74:9–15. doi: 10.1016/s0165-0270(97)02227-9. [DOI] [PubMed] [Google Scholar]
- Richmond FJR, Gladdy R, Creasy JL, Kitamura S, Smits E, Thomson DB. Efficacy of seven retrograde tracers, compared in multiple-labelling studies of feline motoneurones. J Neurosci Methods. 1994;53:35–46. doi: 10.1016/0165-0270(94)90142-2. [DOI] [PubMed] [Google Scholar]
- Schofield BR. Superior paraolivary nucleus in the pigmented guinea pig: separate classes of neurons project to the inferior colliculus and the cochlear nucleus. J Comp Neurol. 1991;312:68–76. doi: 10.1002/cne.903120106. [DOI] [PubMed] [Google Scholar]
- Schofield BR, Cant NB. Organization of the superior olivary complex in the guinea pig: II. Patterns of projection from the periolivary nuclei to the inferior colliculus. J Comp Neurol. 1992;317:438–455. doi: 10.1002/cne.903170409. [DOI] [PubMed] [Google Scholar]
- Schofield BR, Coomes DL, Schofield RM. Cells in auditory cortex that project to the cochlear nucleus in guinea pigs. J Assoc Res Otolaryngol. 2006;7:95–109. doi: 10.1007/s10162-005-0025-4. [DOI] [PMC free article] [PubMed] [Google Scholar]