

Abstract
To explore the temporal sequence of, and the relationship between, the left and right hemispheres (LH and RH) during semantic memory (SM) processing we identified the neural networks involved in the performance of functional MRI semantic object retrieval task (SORT) using group independent component analysis (ICA) in 47 healthy individuals. SORT requires participants to determine whether word pairs describing object features combine to retrieve an object. Functional network connectivity (FNC) was used to assess the correlations between components’ time courses. Results showed that semantic left and right hemisphere networks comprise two independent ICA components. The components’ time courses were highly correlated and RH activation preceded that of the LH. Moreover, this correlation was significantly stronger in better vs. poorer performers of the SORT. These results indicate an early activation of the RH that is closely followed by activation of the LH, to facilitate performance during word retrieval from SM.
Keywords: Semantic memory, independent component analysis, ICA, functional network connectivity, FNC, right hemisphere
1. Introduction
Semantic memory (SM) refers to the general knowledge of concepts and facts, including word meaning, and involves encoding and retrieval of information in multiple domains (Hart et al., 2007; Tulving, 1972). Even though language is often predominantly lateralized to the left cerebral hemisphere (LH), there is evidence that semantic processing involves the right cerebral hemisphere (RH) as well (for review see Beeman & Chiarello, 1998; Jung-Beeman, 2005). However, the temporal sequence of, and the relationship between, activity in the hemispheres are not yet understood.
Commonly, studies investigating the two hemispheres’ role in semantic processing have used semantic priming paradigms. These investigations are based on the finding that a target word is processed faster and more accurately when preceded by a semantic associated prime (white-black) as compared to an unassociated prime (hand-black). To evaluate laterality differences in semantic priming, the target words are presented laterally to either the left or right visual fields; hence, to right or left hemisphere, respectively. Although not always consistent, studies that investigated word pairs that are weakly associated found an enhanced priming effect in the RH compared to the LH (e.g. Chiarello & Richards 1990; Atchley et al., 1999). These results, as well as results from lesion studies (e.g. Beeman, 1993), suggest that the LH is involved in strong activation of small and focused semantic fields while RH weakly activates large diffuse semantic fields and is crucial in tasks that require accessing multiple possible representations (Jung-Beeman, 2005; Lindell, 2006). In assessing the temporal sequence of the two hemispheres’ individual activations, several studies used different length of stimulus onset asynchrony (SOA), with inconclusive results (Chiarello et al., 2003; Hutchinson et al., 2003; Yochim et al., 2005; Koivisto, 1997).
To evaluate the neural mechanism related to semantic memory in healthy individuals and patients with different mental illnesses associated with impaired SM, we used the functional MRI (fMRI) semantic object retrieval task (SORT). This paradigm taps into specific form of semantic association by entailing the retrieval of non-presented specific object from semantic memory storage based on two of its features. Participants have to determine whether two features (e.g., “desert” and “humps”) elicit the retrieval of a specific object (e.g., “camel”). Thus SORT explores the integrity of both object and feature representational levels, the access between them, the semantic process of retrieval and it engages fewer non-semantic cognitive processes in its performance than commonly used tests of semantic memory. It has been shown not to a have ceiling effect and participants’ performance is stable across age, education, IQ and depression status (Kraut et al. 2006a). It is also relatively short and easy to administer, can be given to clinical populations and has proven to be sensitive to specific deficits in mental and neural illnesses, such as formal thought disorder in schizophrenia (Assaf et al. 2006b) and dementia in Alzheimer disease (Kraut et al. 2006a; 2007). Contrasting word pairs that healthy participants combined to retrieve objects to pairs that did not result in retrieval while undergoing fMRI allowed for exploration of brain areas specifically involved in object retrieval from semantic memory. These included traditional language (and more specifically semantic) related areas, including bilateral inferior frontal gyri (IFG), left inferior parietal lobule (IPL) and middle temporal gyrus/inferior temporal sulcus (MTG/ITS) (Assaf et al., 2006a). Unpublished data from our lab, using a larger sample size, additionally showed involvement of the right IPL and MTG/ITS. Importantly, the SORT requires activation of multiple representations of the features represented by each word in different semantic memory subsystems (e.g., the visual system for the image of feature, the premotor area for the manipulability feature, the somatosensory region for touch representation, etc.; Hart et al., 2007). In addition, the task potentially requires activation of multiple possible relationships between the feature pairs, and then narrowing down the semantic search to activate the most appropriate item memory. Each of these activates different brain regions in both the right and left hemispheres (Beeman, 1993, 1994; Jung-Beeman, 2005; Chiarello, 1988).
In the current study we investigated the temporal relationship between the LH and RH during retrieval from semantic memory in healthy individuals performing the fMRI SORT task. We used group independent component analysis (ICA; Calhoun et al., 2001; McKeown et al., 1998) to identify spatially independent components of brain areas with hemodynamic time courses that closely co-varied. Thus, the regions comprising each component are conceptualized as part of a specific network (Calhoun et al., 2001). Though the ICA components are maximally spatially independent, they may not be temporally independent and significant temporal correlation may exist between them. To assess these temporal relationships, we applied a functional network connectivity (FNC) analysis (Jafri et al., 2008), which is based on a constrained maximal lagged correlation, to the ICA components’ time courses. Once these correlations are determined within subject, we test for within- and between-group differences in the inter-component correlations (Jafri et al., 2008). We hypothesized that activation in the two hemispheres is unique and distinct in time, such that the RH activates first to activate more primitive sensorimotor feature representations, while the LH is activated second, to narrow the search and retrieve the correct lexical referent once the memory has been correctly retrieved. If this model is correct we anticipated that (1) activations in LH and RH would be spatially independent, i.e. they would manifest in two different ICA components; and (2) the activation in the two hemispheres would correlate with each other such that RH activation precedes LH activation. Since narrowing down the semantic search is crucial to the correct retrieval of objects on the SORT task (i.e. to performance on the task), we further predicted that (3) the correlations between activations in the right and left hemispheres would be significantly stronger in individuals performing better on this task.
2. Method
2.1. Participants
Forty-seven healthy, right handed (as assessed by the Edinburgh Handedness Inventory), native English speakers (28 males and 19 females) were recruited from the Greater Hartford (CT) area, to perform the SORT. None had participated in previous studies using any version of this task (Assaf et al., 2006a; Assaf et al., 2006b; Kraut et al., 2002, 2003, 2006a, 2007). Participants were between the ages of 18 and 54 (mean age 26 years, SD=8.6), with 11 to 20 years of education (mean of 14.8 years, SD=2.1) and had no current or past history of axis I diagnosis, as assessed by the structured clinical interview for DSM-IV axis I disorders (SCID; First et al., 2002); and no major physical illness, current or past history of neurological disease or substance abuse, or history of head trauma causing loss of consciousness. Full-scale IQ was assessed using the WAIS information and block design subsets (score range: 85–138, mean=115.1, SD=11.6). All participants provided written informed consent, which was approved by Hartford Hospital institutional review board, after receiving a complete study description and were paid $20 per hour for their participation.
2.2. Stimuli and Procedures
Prior to scanning, all participants underwent out-of-scanner training in the semantic object-retrieval task, to ensure they understood the instructions and could perform the task. Stimuli, conceptually similar, but different from those later used during the fMRI scan, were presented on a computer monitor and feedback was provided by the examiner.
While being scanned, each participant performed an updated version of the SORT originally described by Kraut et al. (Kraut et al., 2002, 2003) and modified by Assaf et al. (Assaf et al., 2006a; 2006b; Figure 1). The task stimuli were visually presented word pairs describing object features. Participants were instructed to push a button with their dominant index finger if the two words evoked a third object and their dominant middle finger if they did not. Thus, the task consisted of two types of word pairs: (1) 46 retrieval (R) pairs (as opposed to only 16 pairs previously, (Assaf et al., 2006a; 2006b), where the two words described features of an object that combine to elicit an object that was not presented (e.g., “honey” and “stings”, which evoke the object “bee”), and (2) 46 non-retrieval (NR) pairs (instead of 16 pairs in prior version), where the words did not combine to retrieve such an object (e.g., “quacks” and “honey”).
Figure 1. Schematic representation of the semantic object retrieval task (SORT).
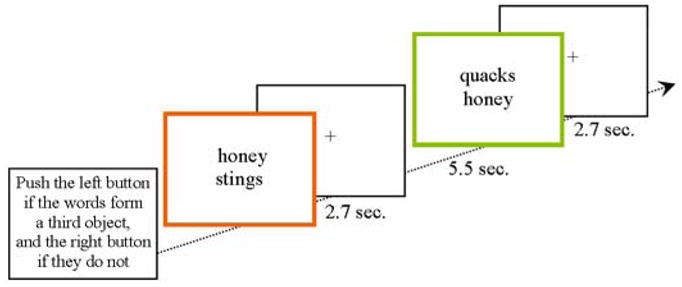
The task includes 46 retrieval pairs (R, orange square) and 46 non-retrieval pairs (NR, green square). The words pairs are presented for 2.7 seconds with a fixation cross of 5.5 seconds in between them. Colors are presented for demonstration purposes only. During the actual run the word pairs are presented in the center of a screen without a frame.
To minimize stimulus-specific effects due to the words themselves, stimuli used in the NR pairs were recombinations of words used in the R pairs. Using E-prime (Psychology Software Tools, Inc.), word pairs were presented in lower case in the central aspect of the viewing screen, with one word above the other, as black letters against a white background, on a screen located 1–2 inches in front of participants’ eyes. Each pair was presented for 2.7 seconds and was not terminated by participants’ button press, with 5.5 seconds inter-stimulus interval, during which participants were instructed to fixate on a centrally presented cross. The order of the R and NR word pairs was pseudo-randomized and was consistent for all participants; hence the SOA between stimuli of the same type was a multiple of 8.2 which is essentially a sparse, jittered stimuli presentation (Dale and Buckner, 1997).
Out-of-scanner debriefing was done immediately post-scan. Word pairs were presented on a computer monitor, in the same order as in-scanner, and participants read them out loud and replicated their prior answers. For every word pair the participant identified as a positive retrieval, he/she was asked to indicate the object elicited by the stimuli. For every incorrect response the participant was asked to define the cue words.
2.3. Scanning Procedures
Blood oxygenation level dependent (BOLD) signal was obtained with T2*-weighted echo planar imaging (EPI) sequence (TR/TE=1860/27 msec, Flip angle=70°, Field of view=22 cm with a 64 × 64 acquisition matrix) using a Siemens Allegra 3 Tesla scanner. We acquired 36 contiguous axial functional slices of 3 mm thickness with 1 mm gap, yielding 3.4×3.4×4 mm voxels. Overall, the task consisted of 426 images including 6 ‘dummy’ images at the beginning of the scan to allow global image intensity to reach equilibrium. The dummy images were not included in the data analysis.
2.4. Behavioral Data Analysis
First, we segregated the recorded responses to each of the word pair subtypes (R/NR) and evaluated the accuracy and reaction time for each, based on data collected during the fMRI scan and debriefing. To differentiate between good and poor performers a discrimination index was calculated as hit rate minus false alarm rate (i.e. true positives minus false positives). This index reflects the participant’s success in discriminating R from NR word pairs; the closer the score to 1, the better the performance. Participants were classified into one of 2 groups based on median split at 0.808, such that good performers’ (n=20) scores were higher than this value and poor performers’ (n=27) scores equal or lower. Two-sample t-test analyses assessed between-group behavioral differences in age, years of education and IQ; and chi-square tests assessed group differences on gender and race. Repeated measure 2 (groups: good/poor performers) × 2 (condition: R/NR) ANOVAs assessed between group differences on accuracy and reaction time. Follow-ups t-tests were performed.
2.5. Imaging Data Analysis
Most research on neural correlates of semantic processing relies on subtractive method (e.g. Thompson-Schill et al., 1997; Assaf et al., 2006a; Kraut et al., 2002). Our objective was to highlight the temporal dynamics between hemispheric networks using ICA and FNC analyses as described below.
2.5.1. Preprocessing
Data were preprocessed using SPM2 (Wellcome Department of Cognitive Neurology). Each individual’s data set was realigned to the first ‘non-dummy’ image using the INRIAlign toolbox (A. Roche, INRIA Sophia Antipolis, EPIDAURE Group), spatially normalized to the Montreal Neurological Institute space (Friston et al., 1995), and spatially smoothed with 9 mm3 Gaussian kernel. Reported coordinates were converted from Montreal Neurological Institute space to standardized Talairach space (Talairach & Tournoux, 1988) using an algorithm developed by Matthew Brett (http://imaging.mrc-cbu.cam.ac.uk/imaging/MniTalairach).
2.5.2. GLM individual designs
Based on the analysis of the behavioral data, a general linear model (GLM) was calculated in SPM separately for each subject using the correct and incorrect R and NR events as its regressors. For each subject, the duration of each individual event was determined by in-scanner reaction time (from stimulus onset to button press). Default hemodynamic delay of 6 seconds was used to model the events.
2.5.3 Component Estimation
(Note: For ICA and FNC analyses we followed the procedures described in Jafri et al., 2008). Group spatial ICA was conducted for all 47 participants using the infomax algorithm (Bell & Sejnowski 1995). Data were decomposed into twenty-five components using the GIFT software (http://icatb.sourceforge.net/, version 1.3b). Dimension estimation, to determine the number of components, was performed using the minimum description length criteria, modified to account for spatial correlation (Li et al., 2006). The mean dimension estimation was 21.9 (SD=7.5). We rounded this number slightly upwards and estimated 25 components. Single subject time courses and spatial maps were then computed (called back-reconstruction), during which the aggregate components and the results from data reduction were used to compute the individual subject components (Calhoun et al., 2001b).
2.5.4. Component Selection
A systematic process was used to inspect and select the components of interest from the 25 estimated components (Stevens, et al. 2007). The association of each component’s spatial map with a priori mask maps of gray matter, white matter, and cerebral spinal fluid within standardized brain space (provided in WFU Pickatlas, Maldjian et al., 2003) helped to identify those components whose patterns of correlated signal change were largely constrained to gray matter. Components with high correlation to a priori localized CSF or white matter, or with low correlation to gray matter, were inferred to be likely artifactual. Visual inspection of discarded components suggested that they represented eye movements, head motion, or cardiac-induced pulsatile artifact at the base of the brain. Seven components were selected as of interest for further analysis. To evaluate the association between these components’ time courses and SORT, each subject’s GLM canonical hemodynamic response model from SPM2 was entered into a temporal sorting analysis using the GIFT software. The individual beta values related to the SORT R and NR regressors in each component were entered into a one sample ttest, and the resulting t values were converted into a goodness of fit score (R2).
Analysis in GIFT also produced subject-specific time courses for each of the 7 selected components for each of the 47 subjects. Prior to computing correlations, component time courses were filtered through a band-pass Butterworth filter, with cut-off frequencies set at 0.008 Hz and 0.15 Hz. The high-pass filter was similar to the SPM2 default cut-off value (0.0078 Hz), while the low-pass filter was determined by subjects’ individual spectras related to the SORT GLMs. No subject had data with frequency higher than 0.15 Hz.
2.5.5. Correlation and lag computation
The ICA algorithm assumes that the time courses of the responses in cortical areas within one component are synchronous (Calhoun, et al. 2004). Though the components are spatially independent, significant temporal correlations can exist between them. We examined this possibility directly by computing a constrained maximal lagged correlation. Using this approach, we computed a correlation and a lag value for each subject (Jafri et al., 2008).
The time courses from the seven components for all subjects were first interpolated, using low-pass temporal interpolation implemented in the ‘interp’ function in Matlab (Programs for Digital Signal Processing, IEEE Press, New York, 1979, Algorithm 8.1) and then, consistent with the methods paper introduction the FNC approach (Jafri et al., 2008), the data was sampled to 50 ms bins to enable detection of sub TR hemodynamic delay differences between subjects (Jafri et al., 2008; Henson et al, 2002; Worsley et al, 2006; Calhoun et al, 2000; Ford et al, 2005; Bandettini 1999). The maximal lagged correlation was then examined between all pair-wise combinations where the number of combinations of 7 components, taken 2 at a time results in 21 possible combinations. In other words, we examine the correlation between two time courses, X and Y, when Y is circularly shifted from −5 to +5 seconds around X. The maximal correlation value and corresponding lag were saved for each time course pair.
Correlation and lag values were calculated for all subjects and were later averaged for good and poor performers groups separately, where correlation values represented the dependency of two (out of 7) networks on each other. Using a non-parametric randomization analysis (Holmes et al., 1996; Raz et al., 2003), statistically significant correlation combinations from the 21 possible combinations were extracted for all subjects (corrected for multiple comparisons using a false discovery rate (FDR) with significance level represented by qFDR (Genovese et al., 2002)<0.05), resulting a map of functional network connectivity (Figure 2). We first z-transformed the individual correlation values, subsequently randomly flipped the value sign of half of the sample, and averaged the flipped and non-flipped values of the whole sample. This was repeated 3000 times. The actual mean value was compared to the randomized means. The adjusted p value represents the percentage of times the randomized means were higher than the actual mean. Lag values corresponding to the significant correlation combinations were also extracted. These lag values represent the amount of delay between two correlated component time courses averaged across all subject.
Figure 2. Functional network connectivity map.

The map includes the seven components (A–G) selected for the correlation and lag analysis. Each component was entered into a one-sample t-test in SPM2 and is thresholded at p<0.05 (corrected for multiple comparisons using the family wise error approach in SPM2). All lines show significant correlations within the entire sample (qFDR<0.05) and the arrows represent the direction of the delay between two components. Black lines represent correlations equal or greater than r=0.2 while gray lines represent weaker correlations. The dashed line depicts a correlation where there was a significant difference in the correlation values of good and poor performers, such that good performers show greater correlation than poor performers (p=0.02). In all maps the left (L, in map G) and right (R, in map C) panels represent the left and right hemispheres, respectively.
2.5.6. Correlation and lag computation for group difference
Non-parametric randomization tests were also used to test group differences in correlations values (Holmes et al., 1996; Raz et al., 2003). We performed group-comparison analyses rather than regression analyses since we wanted to minimize the assumption made on the relationship between the performance scores and correlation values (regression analysis assumes linear relationship) and we chose a less stringent assumption that the group means were different. We initially calculated the differences between the mean z-scores of good and poor performers (Δmg-p). Next, we calculated an adjusted P value for each correlation with re-sampling method: we randomly re-sampled the 47 participants for 2 groups 3,000 times, assigning 23 and 24 participants for each group. Mean difference value was calculated for each group-pair assignment (e.g. Δmi1–i2). The adjusted P value represent the percentage of times this mean difference was higher than the mean difference between the good and poor performers (Δmg–p).
In addition the same analysis was done to evaluate significant group differences in the lag value for each components-pair. This analysis revealed the amount of mean lag between pair-wise components for both groups.
3. Results
3.1. Behavioral Data
Demographic and performance information are summarized in Table 1. In summary, there were no group differences on age, gender, race and years of education. There was a significant group difference on full-scale IQ, such that good performers (as defined by the discrimination index) had higher IQ than poor performers. We therefore used IQ as a covariate in all subsequent between-groups analyses. On task performance, there was a main effect of group (good/poor performers) and condition (R/NR) on both accuracy and reaction time (accuracy – group: F(1,45)=29.6, p<0.0001, condition: F(1,45)=8.2, p=0.006; RT – group: F(1,45)=8.3, p=0.006, condition: F(1,45)=71.1, p<0.0001) such that good performers had higher hit rate and shorter reaction times when compared to poor performers and all participants had higher correct responses on NR pairs than R pairs; in addition, the reaction times for the NR pairs were longer. However, when controlling for IQ, the only result that was still significant was Group effect for accuracy (F(1,44)=19.3, p<0.0001). Importantly, group differences on the discrimination index (which was used as the grouping factor) was still significant when controlling for IQ (p<0.0001).
Table 1. Demographic and behavioral information for the all sample and for the good and poor performers groups.
(Data represents average scores ± standard deviation and range in parentheses)
| All Participants (n=47) |
Good Performers (n=20) |
Poor Performers (n=27) |
Statistics | p | |
|---|---|---|---|---|---|
|
| |||||
| Age (years) | 26.6±8.6 | 25.3±7.6 | 27.6±9.1 | t (45)=−0.3 | n.s. |
|
| |||||
| Gender (Male/Female) | 28/19 | 11/9 | 17/10 | χ2 (1)=0.3 | n.s. |
|
| |||||
| Race (White/Black/Hispanic/Other) | 37/3/5/2 | 17/0/2/1 | 20/3/3/1 | χ2 (3)=2.4 | n.s. |
|
| |||||
| Education (years) | 14.8±2.1 | 14.5±2.1 | 15.0±2.1 | t (45)=−0.7 | n.s. |
|
| |||||
| Full-Scale IQ | 115.1±11.6 | 122.0±7.9 | 109.9±11.3 | t (45)=4.1 | 0.0001 |
|
| |||||
| Discrimination Index | 0.78±0.14 (0.30–0.98) | 0.88±0.04 (0.83–0.98) | 0.70±0.14 (0.30–0.808) | t (45)=5.4 | 0.0001 |
|
| |||||
| Retrieval Pairs (R) | |||||
| Correct Button Press (max=46) | 40.0±4.9 (21–46) | 43.1±1.9 (40–46) | 37.7±5.1 (21–44) | t (45)=4.4 | 0.0001 |
|
| |||||
| Reaction Time (msec) | 1543.6±281.6 | 1412.0±272.1 | 1641.1±250.9 | t(45)=−3.0 | 0.005 |
|
| |||||
| No-Retrieval Pairs (NR) | |||||
| Correct Button Press (max=46) | 42.4±3.5 (30–46) | 44.1±1.7 (41–46) | 41.2±3.9 (30–46) | t (45)=3.1 | 0.003 |
|
| |||||
| Reaction Time (msec) | 1852.3±387.8 | 1691.3±328.7 | 1971.4±407.8 | t (45)=−2.5 | 0.01 |
3.2. Functional Imaging Data
3.2.1. Correlation Computation for all Subjects
Figure 2 shows the seven components (A–G) selected for the connectivity analysis. Table 2 summaries the regions activated in each component. The temporal sorting analysis showed that 4 of the components were among the 7 components with the highest correlation value for either R or NR conditions (R2 range for these conditions was 0.00009–0.55; Component A: R=0.53 (p<0.0001), NR=0.08 (p=0.04); B: R=0.18 (p=0.003), NR=0.15 (p=0.007); C: R=0.41 (p<0.0001), NR=0.29 (p<0.0001), D: R=0.18 (p=0.003), NR=0.40 (p<0.0001); E: R=0.03 (n.s.), NR=0.0004 (n.s.); F: R=0.004 (n.s.), NR=0.03 (n.s.) and G: R=0.49 (p<0.0001), NR=0.50 (p<0.0001)); i.e. all components but E and F were task related.
Table 2. Regions activated in each component.
| Anatomic Location | Left Hemisphere | Right Hemisphere | ||
|---|---|---|---|---|
| Talairach Coordinates | t Score | Talairach Coordinates | t Score | |
| Component A: Left Hemisphere Network | ||||
| Middle Frontal Gyrus (BA 9) | −48, 16, 30 | 26.6 | ||
| Inferior Parietal Lobule (BA 39, 40, 7) | −42, −44, 44 | 24.5 | 39, −59, 36 | 8.8 |
| Middle Temporal Gyrus (BA 21, 37) | −59, −35, −1 | 20.6 | 59, −41, −11 | 8.9 |
| Inferior Frontal Gyrus (BA 44, 45, 47) | −48, 32, −2 | 20.6 | 33, 34, −14 | 9.1 |
| Pre-SMA, Medial Frontal Gyrus (BA 8, 6) | −6, 26, 46 | 19.5 | 3, 26, 46 | 9.8 |
| Insula | −33, 17, −6 | 14.3 | ||
| Cerebellum | 12, −80, −24 | 12.9 | ||
| Precentral Gyrus (BA 4, 6) | −51, −10, 36 | 12.1 | 48, −10, 36 | 6.0 |
| Hippocampus | −30, −9, −12 | 11.7 | ||
| Orbital Gyrus (BA 11) | −3, 43, −20 | 8.2 | ||
| Caudate Body | −15, 4, 14 | 9.1 | ||
| Precuneus (BA 7) | −3, −62, 45 | 7.9 | ||
| Thalamus | −6, −14, 12 | 7.2 | ||
| Component B: Right Hemisphere Network | ||||
| Inferior Parietal Lobule (BA 39, 40, 7) | −42, −47, 49 | 17.9 | 53, −42, 38 | 21.1 |
| Middle Frontal Gyrus (BA 10, 46, 9, 8) | −39, 55, 0 | 11.0 | 52, 52, −5 | 20.9 |
| Precentral Gyrus (BA 9) | 45, 19, 35 | 15.4 | ||
| Cerebellum | −15, −83, −21 | 14.0 | ||
| Pre-SMA, Medial Frontal Gyrus (BA 8, 6) | 6, 29, 46 | 13.7 | ||
| Inferior Frontal Gyrus (BA 44, 45, 47) | 50, 20, 2 | 13.0 | ||
| Precuneus (BA 7) | −30, −50, 49 | 6.8 | 36, −65, 42 | 12.6 |
| Insula | 36, 21, −3 | 11.9 | ||
| Middle Temporal Gyrus (BA 21, 37) | 65, −41, −6 | 11.8 | ||
| Posterior Cingulate Cortex (BA 31, 24, 23) | −3, −22, 31 | 8.8 | 3, −25, 34 | 11.3 |
| Anterior Cingulate Cortex (BA 32) | 6, 41, 6 | 8.9 | ||
| Component C: Pre-SMA/Thalamus | ||||
| Pre-SMA (BA 6, 8, 32) | −3, 25, 35 | 30.2 | 3, 22, 35 | 32.3 |
| Middle Frontal Gyrus/Precentral Gyrus (BA 6, 8, 46) | −48, 5, 38 | 18.1 | 48, 5, 36 | 16.9 |
| Inferior Frontal Gyrus/Insula (BA 47, 44, 13) | −39, 12, −1 | 15.3 | 45, 14, −3 | 18.0 |
| Superior Frontal Gyrus (BA 9) | −30, 45, 30 | 14.2 | 33, 48, 24 | 16.7 |
| Inferior Parietal Lobule (BA 40) | −45, −33, 43 | 13.6 | ||
| Thalamus | −9, −14, 9 | 11.1 | 9, −8, 9 | 9.6 |
| Postcentral Gyrus (BA 3, 2, 4) | −42, −18, 48 | 11.0 | ||
| Putamen | −15, 8, −8 | 10.2 | 21, 8, −8 | 10.4 |
| Component D: Default Mode Network | ||||
| Posterior Cingulate Cortex (BA 31, 24, 23) | −3, −56, 36 | 24.5 | 0, −42, 35 | 24.9 |
| Inferior Parietal Lobule (BA 39, 40) | −48, −56, 36 | 17.5 | 53, −56, 36 | 19.7 |
| Anterior Cingulate Cortex/Medial Frontal Gyrus | −3, 49, −10 | 10.2 | 3, 49, −10 | 11.1 |
| Precentral Gyrus (BA 4) | −36, −16, 39 | 9.1 | 42, −13, 37 | 10.5 |
| Superior Frontal Gyrus (BA 8) | −24, 34, 43 | 9.1 | 21, 40, 39 | 7.9 |
| Transverse Temporal Gyrus (BA 41) | 42, −26, 12 | 8.7 | ||
| Parahippocampal Gyrus | −27, −30, −11 | 8.0 | ||
| Thalamus | −12, −23, 7 | 7.1 | 12, −20, 9 | 7.8 |
| Component E: Temporal-Frontal Network | ||||
| Superior Temporal Gyrus (BA 42, 41, 22) | −56, −25, 15 | 27.9 | 53, −20, 15 | 24.3 |
| Insula | −42, 0, 0 | 20.0 | 42, −3, 3 | 24.1 |
| Cingulate Gyrus (BA 24) | −3, 5, 41 | 18.4 | 3, 2, 41 | 23.1 |
| Inferior Parietal Lobule (BA 39, 40) | −59, −22, 23 | 20.4 | 59, −25, 26 | 21.5 |
| Thalamus | −12, −20, 1 | 12.4 | 12, −17, 4 | 13.6 |
| Middle Temporal Gyrus (BA 37) | −60, −58, 3 | 10.3 | 59, −61, 3 | 12.6 |
| Middle Fontal Gyrus (BA 46) | −48, 42, 20 | 10.5 | ||
| Precuneus (BA 7) | −9, −77, 40 | 8.1 | 3, −74, 40 | 10.5 |
| Cerebellum | −12, −62, −17 | 8.7 | 12, −62, −12 | 8.9 |
| Component F: Parietal-Frontal Network | ||||
| Precuneus (BA 7, 19) | −12, −68, 48 | 27.1 | 9, −67, 53 | 30.4 |
| Inferior Parietal Lobule (BA 40) | −54, −33, 49 | 15.5 | 39, −38, 49 | 9.6 |
| Middle Frontal Gyrus (BA 10, 9, 46) | −42, 42, 15 | 12.1 | 36, 45, 30 | 10.2 |
| Middle Frontal Gyrus (BA 11) | −30, 34, −19 | 10.2 | ||
| Caudate Head and Body | −12, 20, −6 | 10.9 | 15, 23, −6 | 8.8 |
| Middle Temporal Gyrus (BA 21) | −50, −67, 9 | 9.9 | 56, −62, −10 | 10.5 |
| Parahippocampus | −33, −30, −21 | 8.9 | 36, −24, −21 | 8.9 |
| Superior Temporal Gyrus (BA 38) | 39, 2, −15 | 8.5 | ||
| Superior Frontal Gyrus (BA 6) | −27, 9, 60 | 8.1 | 27, 9, 60 | 8.2 |
| Cingulate Cortex (BA 32) | 3, 14, 38 | 7.61 | ||
| Component G: Occipital-Pre/Postcentral Gyrus-SMA | ||||
| Inferior/Middle Occipital Gyri (BA 17, 18, 19, 37) | −39, −88, −6 | 18.0 | 33, −93, 7 | 18.8 |
| Postcentral Gyrus (BA 3, 1, 2) | −56, −9, 45 | 18.8 | 56, −9, 47 | 8.3 |
| Precentral Gyrus (BA 4, 6) | −53, 5, 41 | 18.8 | 59, 11, 35 | 12.0 |
| Fusiform Gyrus (BA 19, 37) | −42, −45, −18 | 16.3 | 48, −56, −12 | 13.7 |
| Superior Frontal Gyrus, SMA (BA 6) | −3, 8, 49 | 13.8 | 0, 11, 49 | 13.5 |
| Orbital Gyrus (BA 11) | −9, 43, −20 | 14.1 | 12, 34, −17 | 13.4 |
| Sucallosal Gyrus (BA 25) | −6, 8, −11 | 11.8 | 12, 11, −13 | 13.1 |
| Midbrain | −9, −18, −4 | 7.5 | 9, −15, −4 | 6.6 |
Figure 2 also shows the functional network connectivity (FNC) diagram for all subjects. Significant correlations (qFDR<0.05) were found between the following components pairs (the direction of the correlation, i.e. which component preceded the other, is depicted by the arrow direction both here and in Figure 1. For example if component A precedes component B, this is shown as A→B and vice-versa): A←B (r=0.45, p=0.002, lag=0.71s); component B preceded A by 0.71 seconds), A←G (r=0.09, p=0.005, lag=0.27s), B→E (r=0.1, p=0.01, lag=2.52s), B←F (r=0.25, p=0.01, lag=1.28s), C←D (r=0.12, p<0.0001, lag=0.06s), D←G (r=-0.08, p=0.003, lag=0.72s), E←G (r=0.15, p=0.01, lag=1.99s), and F→G (r=0.35, p=0.003, lag=0.41s). Lag values of these pairs were not significantly different.
3.2.2. Group Differences in Correlation and Lag Computation
Randomization analysis found significantly greater correlation for the good performers compared to the poor performers when controlling for full scale IQ only in the A–B pair (p=0.02). No pair showed greater correlation for the poor performers. No significant group differences in lag values were found in any of the combination pairs (p<0.05 uncorrected).
4. Discussion
Using ICA and FNC, we identified and characterized seven maximally spatially independent networks involved in the performance of the SORT, including left and right hemisphere networks, and their intercorrelations. We start by discussing the results pertaining to the two hemispheric networks, the major focus of the current work, and then briefly discuss results related to the other 5 components.
The left hemisphere network (A in Fig. 2) includes the left inferior and middle frontal gyrus (Broca’s area), inferior parietal lobule, middle temporal gyrus and pre-SMA. These brain areas are known to be involved in semantic memory processes (Martin and Chao, 2001; Hart & Gordon 1990). Importantly, using standard GLM analysis we have previously shown that these areas are specifically involved in the process of object retrieval based on features, from semantic memory (Assaf et al., 2006a). The current analysis demonstrates the concurrent activation of these regions as a network during the semantic retrieval of objects from semantic memory.
The right hemisphere network (B in Fig. 2) areas closely correspond to the areas included in the left hemisphere network. Previous studies, including neuroimaging studies, have pointed to involvement of the right hemisphere in semantic processing, including category-related knowledge (Fuggetta et al., 2008), meaning selection (Meyer & Federmeier, 2008), lexical-semantic retrieval (Wierenga et al., 2008), nonverbal sound semantic memory (Kraut et al., 2006b), abstract item meaning (Dhond et al., 2007), emotional correlates of semantic items (Calvo & Avero, 2008), emotional prosody of items (Mitchell, 2007), and attentional influences that modulate semantic processing. Using the SORT, we previously demonstrated that chronic schizophrenia patients over-activate these right hemisphere areas when retrieving objects from semantic memory, suggesting that abnormal activation of these regions during semantic processes can be associated with mental disorders (Assaf et al., 2006b). As we predicted, the current results confirm the independent activation of the right and left semantic areas during semantic processing.
The FNC analysis demonstrated a significant correlation between the hemodynamic time courses of the two hemispheric networks, and, consistent with our hypothesis, that brain signal changes first in the right hemisphere and then in the left. It has been suggested that the RH activates wide semantic network with multiple possible associations and that the LH selects the narrower response from this semantic network, by inhibiting the irrelevant responses (Beeman, 1993; Chiarello, 1988). More recently, Hutchinson et al. (2003) and Yochim et al. (2005) showed, using visual half-field lexical decision tasks with different SOAs, that RH primes more quickly than the LH. However, other studies suggest early activation of the LH rather than the RH (Koivisto, 1997). Our study is the first to support the former temporal sequence of hemispheric activation during semantic processing with measure of hemodynamic time course data during semantic processing. Importantly, the same hemispheric temporal relationship was recently demonstrated during visuospatial attention processing (Siman-Tov et al., 2007). Theoretically, the time lag between the two networks can be due to temporal differences in blood supply to the different brain regions. However, in our case the RH and LH semantic components include the same brain areas in each hemisphere, which are likely supplied by roughly symmetrical vascular beds with presumably close-to-identical blood supply, and thus should have similar timing/delays in hemodynamic time courses. In addition, the difference between good and poor performers strengthens our contention, as in this case the group difference in timing between the same brain regions is compared.
Given the recent behavioral evidence for interhemispheric transfer of information during semantic processing (Hutchinson et al., 2003; Yochim et al., 2005), our results suggest an influence of the RH on the LH semantic areas to facilitate the performance of the SORT (wide activation of the semantic memory network by the former and subsequent selection of the proper semantic definition by the LH). Notably, among all networks’ correlations demonstrated in our study, the only one that was significantly different between good and poor performers of the SORT was that between the left and right hemispheric networks, such that good performers showed stronger correlation than poor performers (even when controlling for IQ). This result further emphasizes the importance of the connection between these networks for proper semantic processing.
It is important to note that we do not suggest that the time courses of the left and right hemispheric networks are related to semantic processes exclusively. First, similar networks were demonstrated with resting state data (e.g. Fox et al., 2005; Damoiseaux et al., 2006). Second, only 53% and 18% of the left and right (respectively) hemisphere components’ time courses variance is explained by our semantic task (as demonstrated by the correlation analysis with the R condition in the temporal sorting analysis). These facts are not surprising considering the other functions that share the same hemispheric location (e.g. working memory and attention processes; for review see Cabeza & Nyberg, 2000) and it is possible that these networks represent more generic-cognitive networks or are involved in non-semantic top-down and bottom-up attention regulation (Corbetta & Shulman 2002). The current analysis suggests that these networks are related to semantic processes, but cannot rule out other roles.
In addition, the ICA signal is a compound signal that incorporates intrinsic neural variability. Therefore, it is possible that some of our results are driven by this intrinsic signal as oppose to task-related hemodynamic responses (Calhoun et al., 2008). However, one of the strengths of ICA is its ability to find noise related components signal artifacts (McKeown, et al. 2003) and some researchers have used it as a method for removing noise from MRI signal (e.g. Thomas et al., 2002; Kochiyama et al., 2005; Tohka et al., 2008). Though it is not necessary to correct the data with specific noise-reduction algorithms, such as RETROICOR, and we also do not do this in our original FNC paper (Jafri 2008), there are always additional steps which may be incorporated to this method in the future.
The other five ICA components identified by our analysis to be significantly task-related during SORT include: the Pre-SMA (BA 6) and thalamus (component C in Fig. 2), the default mode network (D), the Temporal-Frontal network (E), the Occipital-Pre/Postcentral gyrus-SMA network (G) and the Parietal-Frontal network (F). We will shortly discuss these networks and potential role in SORT and the correlation between them. We have previously shown, using traditional GLM analyses, that the pre-SMA and thalamus are involved in this task (Assaf et al., 2006a; Hart et al., 2007; Kraut et al., 2002, 2003). It has been suggested that the pre-SMA and the thalamus are involved in engaging and framing the object search and in modulating synchronization of neural activity in brain areas encoding for different components of an object in semantic memory resulting in features coactivation and binding to the retrieval of the integrated object (for review see Hart et al., 2007). Notably, these regions were also part of other components (i.e. A, B, D and E), demonstrating high correlations between their hemodynamic time course and those of the other components.
The default mode network activation includes bilateral inferior parietal lobules, posterior cingulate cortex and anterior cingulate cortex. This network is known to be active during passive states, when a person is awake but resting quietly, and de-active during a range of cognitive tasks (e.g. Raichle et al., 2001; McKiernan et al., 2003; Buckner and Vincent 2007; Raichle and Snyder 2007; but see Morcom and Fletcher 2007). Importantly, this network was demonstrated in other resting state scans (e.g. Jafri et al., 2008; Esposito et al., 2008) as well as during scans involving other cognitive tasks, such an auditory oddball task (Calhoun et al., 2008).
The parietal-frontal network (component F) includes the precuneus as well as other parietal regions (i.e. IPL) and the middle frontal gyri bilaterally. The precuneus is known to be involved in mental imagery and episodic and autobiographical memory retrieval (Cavanna, 2007; Cavanna & Trimble, 2006) and there is growing evidence that it is also part of the “default mode”, or “consciousness”, neural network (Cavanna, 2007). Finally, components E and G are related to auditory and visual networks, respectively, which engage feature-object representations in the respective semantic memory subsystems. The involvement of these three networks (E–G) was also demonstrated with other resting state and task related fMRI data (e.g. Jafri et al., 2008; Calhoun et al., 2008).
As seen in figure 2, we identified several significant correlations between our seven components, in addition to the correlation between the left and right semantic networks. However, some of these correlations were weak (i.e. r<0.2) and therefore likely not meaningful. The two stronger correlations involved the parietal-frontal network, which preceded the activation of both the right hemisphere and the occipital (i.e. visual) networks. These data support the known widespread connectivity between the precuneus and frontal and visual cortical regions (Cavanna, 2007; Cavanna & Trimble, 2006).
To summarize, in the current fMRI study we have identified seven neural components involved in object retrieval in semantic memory using ICA. One of these networks depicts a set of regions in the left hemisphere that is known to be involved in semantic retrieval. We also identified a right hemisphere component that is almost a ‘mirror-image’ of the former network. Importantly, the time courses of ICA spatially independent components can correlate, and by using an FNC analysis we demonstrated a significant correlation between the time courses of these two components, such that the right hemisphere network activation precedes the left. This correlation is significantly stronger in good performers, highlighting the importance of this inter-hemispheric connection to semantic memory retrieval efficiency. To our knowledge, this is the first neuroimaging study to demonstrate a temporal relationship between the right and left hemisphere during semantic processing.
Acknowledgments
This work was partially supported by The Patrick and Catherine Weldon Donaghue Medical Research Foundation (PI: M. Assaf), NIMH grants: RO1 MH-60504, R01 MH43775 and RO1 MH-52886 (PI: G.D. Pearlson) and NIBIB grant: R01 EB-000840 (PI: V.D. Calhoun). The authors would like to thank Dr. Michael Stevens for helpful comments to the manuscript.
Footnotes
Parts of this work were presented in an abstract format at the Cognitive Neuroscience Society and the International Society for Magnetic Resonance in Medicine 2008 annual meetings.
Publisher's Disclaimer: This is a PDF file of an unedited manuscript that has been accepted for publication. As a service to our customers we are providing this early version of the manuscript. The manuscript will undergo copyediting, typesetting, and review of the resulting proof before it is published in its final citable form. Please note that during the production process errors may be discovered which could affect the content, and all legal disclaimers that apply to the journal pertain.
References
- Atchley RA, Burgess C, Keeney M. The effect of time course and context on the facilitation of semantic features in the cerebral hemispheres. Neuropsychology. 1999;13(3):389–403. doi: 10.1037//0894-4105.13.3.389. [DOI] [PubMed] [Google Scholar]
- Assaf M, Calhoun VD, Kuzu CH, Kraut M, Rivkin PR, Hart J, Pearlson GD. Neural correlates of the object-recall process in semantic memory. Psychiatry Research. 2006a;147:115–126. doi: 10.1016/j.pscychresns.2006.01.002. [DOI] [PubMed] [Google Scholar]
- Assaf M, Rivkin PR, Kuzu CH, Calhoun VD, Kraut M, Groth KM, Yassa MA, Hart J, Pearlson GD. Abnormal object recall and anterior cingulate over activation correlate with formal thought disorder in schizophrenia. Biological Psychiatry. 2006b;59:452–459. doi: 10.1016/j.biopsych.2005.07.039. [DOI] [PubMed] [Google Scholar]
- Bandettini PA. The Temporal Resolution of Functional MRI. Medical Radiology Diagnostic Imaging and Radiation Oncology. 1999:205–220. [Google Scholar]
- Beeman M. Semantic processing in the right hemisphere may contribute to drawing inferences from discourse. Brain & Language. 1993;44:80–120. doi: 10.1006/brln.1993.1006. [DOI] [PubMed] [Google Scholar]
- Beeman M, Friedman RB, Grafman J, Perez E, Diamond S, Beadle Lindsay M. Summation priming and coarse semantic priming. Journal of Cognitive Neuroscience. 1994;6:26–45. doi: 10.1162/jocn.1994.6.1.26. [DOI] [PubMed] [Google Scholar]
- Bell AJ, Sejnowski TJ. An information-maximization approach to blind separation and blind deconvolution. Neural Computation. 1995;7(6):1129–1159. doi: 10.1162/neco.1995.7.6.1129. [DOI] [PubMed] [Google Scholar]
- Buckner RL, Vincent JL. Unrest at rest: default activity and spontaneous network correlations. Neuroimage. 2007;37(4):1091–6. doi: 10.1016/j.neuroimage.2007.01.010. discussion 1097–9. [DOI] [PubMed] [Google Scholar]
- Cabeza R, Nyberg L. Imaging cognition II: An empirical review of 275 PET and fMRI studies. J Cogn Neurosci. 2000;12:1–47. doi: 10.1162/08989290051137585. [DOI] [PubMed] [Google Scholar]
- Calhoun VD, Adali T, Kraut M, Pearlson GD. Aweighted-least squares algorithm for estimation and visualization of relative latencies in event-related functional MRI. Magn Res Med. 2000;44(6):947–954. doi: 10.1002/1522-2594(200012)44:6<947::aid-mrm17>3.0.co;2-5. [DOI] [PubMed] [Google Scholar]
- Calhoun VD, Adali T, Pearlson GD, Pekar JJ. Spatial and temporal independent component analysis of functional MRI data containing a pair of task-related waveforms. Human Brain Mapping. 2001a;13:43–53. doi: 10.1002/hbm.1024. [DOI] [PMC free article] [PubMed] [Google Scholar]
- Calhoun VD, Adali T, Pearlson GD, Pekar JJ. A method for making group inferences from functional MRI data using independent component analysis. Human Brain Mapping. 2001b;14(3):140–151. doi: 10.1002/hbm.1048. [DOI] [PMC free article] [PubMed] [Google Scholar]
- Calhoun VD, Kiehl KA, Liddle PF, Pearlson GD. Aberrant localization of synchronous hemodynamic activity in auditory cortex reliably characterizes schizophrenia. Biological Psychiatry. 2004;55(8):842–849. doi: 10.1016/j.biopsych.2004.01.011. [DOI] [PMC free article] [PubMed] [Google Scholar]
- Calhoun VD, Kiehl KA, Pearlson GD. Modulation of temporally coherent brain networks estimated using ICA at rest and during cognitive tasks. Human Brain Mapping. 2008;29:828–838. doi: 10.1002/hbm.20581. [DOI] [PMC free article] [PubMed] [Google Scholar]
- Calvo MG, Avero P. Affective priming of emotional pictures in parafoveal vision: left visual field advantage. Cognitive, Affective, & Behavioral neuroscience. 2008;8:41–53. doi: 10.3758/cabn.8.1.41. [DOI] [PubMed] [Google Scholar]
- Cavanna AE. The precuneus and consciousnes. CNS Spectrums. 2007;12:545–552. doi: 10.1017/s1092852900021295. [DOI] [PubMed] [Google Scholar]
- Cavanna AE, Trimble MR. The precuneus: a review of its functional anatomy and behavioural correlates. Brain. 2006;129:564–583. doi: 10.1093/brain/awl004. [DOI] [PubMed] [Google Scholar]
- Chiarello C. Semantic Priming in the intact brain: separate roles for the right and left hemispheres? In: Chiarello C, editor. Right hemisphere contributions to lexical semantics. Berlin Heidelberg New York: Springer-Verlag; 1988. [Google Scholar]
- Chiarello C, Burgress C, Richards L, Pollock A. Semantic and associative priming in the cerebral hemispheres: Some words do, some words don’t… sometimes, some places. Brain & Language. 1990;38:75–104. doi: 10.1016/0093-934x(90)90103-n. [DOI] [PubMed] [Google Scholar]
- Chiarello C, Richards L. Another look at categorical priming in the cerebral hemispheres. Neuropsychologia. 1992;30(4):381–392. doi: 10.1016/0028-3932(92)90111-x. [DOI] [PubMed] [Google Scholar]
- Chiarello C, Liu S, Shears C, Quan N, Kacinik N. Priming of strong semantic relations in the left and right visual fields: a time-course investigation. Neuropsychologia. 2003;41(6):721–732. doi: 10.1016/s0028-3932(02)00220-8. [DOI] [PubMed] [Google Scholar]
- Corbetta M, Shulman GL. Control of goal-directed and stimulus-driven attention in the brain. Nat Rev Neurosci. 2002;3:201–215. doi: 10.1038/nrn755. [DOI] [PubMed] [Google Scholar]
- Dale AM, Buckner RL. Selective Averaging of rapidly presented individual trials using fMRI. Hum Brain Mapp. 1997;5:329–340. doi: 10.1002/(SICI)1097-0193(1997)5:5<329::AID-HBM1>3.0.CO;2-5. [DOI] [PubMed] [Google Scholar]
- Damoiseaux JS, Rombouts SA, Barkhof F, Scheltens P, Stam CJ, Smith SM, Beckmann CF. Consistent resting-state networks across healthy subjects. Proc Natl Acad Sci U S A. 2006;103:13848–13853. doi: 10.1073/pnas.0601417103. [DOI] [PMC free article] [PubMed] [Google Scholar]
- Dhond RP, Witzel T, Dale AM, Halgren E. Spatiotemporal cortical dynamics underlying abstract and concrete word reading. Human Brain Mapping. 2007;28:355–362. doi: 10.1002/hbm.20282. [DOI] [PMC free article] [PubMed] [Google Scholar]
- Esposito F, Aragri A, Pesaresi I, Cirillo S, Tedeschi G, Marciano E, Goebel R, Di Salle F. Independent component model of the default-mode brain function: combining individual-level and population-level analyses in resting-state fMRI. Magnetic Resonance Imaging. 2008;26(7):905–913. doi: 10.1016/j.mri.2008.01.045. [DOI] [PubMed] [Google Scholar]
- First MB, Spitzer RL, Gibbon M, Williams JBW. Structured Clinical Interview for DSM-IV-TR Axis I Disorders, Research Version, Patient Edition. (SCID-I/P) New York: Biometrics Research, New York State Psychiatric Institute; 2002. [Google Scholar]
- Ford JM, Johnson MB, Whitfield SL, Faustman WO, Mathalon DH. Delayed hemodynamic responses in schizophrenia. NeuroImage. 2005;26 (3):922–931. doi: 10.1016/j.neuroimage.2005.03.001. [DOI] [PubMed] [Google Scholar]
- Fox MD, Snyder AZ, Vincent JL, Corbetta M, Van Essen DC, Raichle ME. The human brain is intrinsically organized into dynamic, anticorrelated functional networks. Proc Natl Acad Sci U S A. 2005;102:9673–9678. doi: 10.1073/pnas.0504136102. [DOI] [PMC free article] [PubMed] [Google Scholar]
- Friston KJ, Ashburner J, Frith CD, Poline J-B, Heather JD, Frackowiak RSJ. Spatial registration and normalization of images. Human Brain Mapping. 1995;2:165–189. [Google Scholar]
- Fuggetta G, Rizzo S, Pobric G, Lavidor M, Walsh V. Functional Representation of Living and Nonliving Domains across the Cerebral Hemispheres: A Combined Event-related Potential/Transcranial Magnetic Stimulation Study. Journal of Cognitive Neuroscience. 2008 doi: 10.1162/jocn.2008.21030. in-press. [DOI] [PubMed] [Google Scholar]
- Genovese CR, Lazar NA, Nichols T. Thresholding of statistical maps in functional neuroimaging using the false discovery rate. Neuroimage. 2002;15:870–878. doi: 10.1006/nimg.2001.1037. [DOI] [PubMed] [Google Scholar]
- Hart J, Jr, Gordon B. Delineation of single-word semantic comprehension deficits in aphasia, with anatomical correlation. Annals of Neurology. 1990;27:226–231. doi: 10.1002/ana.410270303. [DOI] [PubMed] [Google Scholar]
- Hart J, Jr, Anand R, Zoccoli S, Maguire M, Gamino J, Tillman G, King R, Kraut MA. Neural substrates of semantic memory. Journal of the International Neuropsychological Society. 2007;13:865–880. doi: 10.1017/S135561770707110X. [DOI] [PubMed] [Google Scholar]
- Henson RN, Price CJ, Rugg MD, Turner R, Friston KJ. Detecting latency differences in event-related BOLD responses: application to words versus nonwords and initial versus repeated face presentations. Neuroimage. 2002;15(1):83–97. doi: 10.1006/nimg.2001.0940. [DOI] [PubMed] [Google Scholar]
- Holmes AP, Blair RC, Watson JD, Ford I. Nonparametric analysis of statistic images from functional mapping experiments. Journal of Cerebral Blood Flow & Metabolism. 1996;16:7–22. doi: 10.1097/00004647-199601000-00002. [DOI] [PubMed] [Google Scholar]
- Hutchinson A, Whitman RD, Abeare C, Raiter J. The unification of mind: Integration of hemispheric semantic processing. Brain & Language. 2003;87:361–368. doi: 10.1016/s0093-934x(03)00133-0. [DOI] [PubMed] [Google Scholar]
- Jafri MJ, Pearlson GD, Stevens M, Calhoun VD. A method for functional network connectivity among spatially independent resting-state components in schizophrenia. Neuroimage. 2008;39:1666–1681. doi: 10.1016/j.neuroimage.2007.11.001. [DOI] [PMC free article] [PubMed] [Google Scholar]
- Jung-Beeman M. Bilateral brain processes for comprehending natural language. Trends in Cognitive Sciences. 2005;9:512–518. doi: 10.1016/j.tics.2005.09.009. [DOI] [PubMed] [Google Scholar]
- Koivisto M. Time course of semantic activation in the cerebral hemispheres. Neuropsychologia. 1997;35:497–504. doi: 10.1016/s0028-3932(96)00100-5. [DOI] [PubMed] [Google Scholar]
- Kochiyama T, Morita T, Okada T, Yonekura Y, Matsumura M, Sadato N. Removing the effects of task-related motion using independent-component analysis. Neuroimage. 2005;25(3):802–814. doi: 10.1016/j.neuroimage.2004.12.027. [DOI] [PubMed] [Google Scholar]
- Kraut MA, Kremen S, Segal JB, Calhoun V, Moo LR, Hart J., Jr Object activation from features in the semantic system. Journal of Cognitive Neuroscience. 2002;14:24–36. doi: 10.1162/089892902317205294. [DOI] [PubMed] [Google Scholar]
- Kraut MA, Calhoun V, Pitcock JA, Cusick C, Hart J., Jr Neural hybrid model of semantic object memory: implications from event-related timing using fMRI. Journal of the International Neuropsychological Society. 2003;9:1031–1040. doi: 10.1017/S135561770397007X. [DOI] [PubMed] [Google Scholar]
- Kraut MA, Cherry B, Pitcock JA, Vestal L, Henderson VW, Hart J., Jr The Semantic Object Retrieval Test (SORT) in normal aging and Alzheimer disease. Cognitive and Behavioral Neurology. 2006a;19:177–184. doi: 10.1097/01.wnn.0000213922.41008.22. [DOI] [PubMed] [Google Scholar]
- Kraut MA, Pitcock JA, Calhoun V, Li J, Freeman T, Hart J., Jr Neuroanatomic organization of sound memory in humans. Journal of Cognitive Neuroscience. 2006b;18:1877–1888. doi: 10.1162/jocn.2006.18.11.1877. [DOI] [PubMed] [Google Scholar]
- Kraut MA, Cherry B, Pitcock JA, Anand R, Li J, Vestal L, Henderson VW, Hart J., Jr The Semantic Object Retrieval Test (SORT) in amnestic mild cognitive impairment. Cogn Behav Neurol. 2007;20(1):62–67. doi: 10.1097/WNN.0b013e3180335f7d. [DOI] [PubMed] [Google Scholar]
- Li Y, Adali T, Calhoun VD. Estimating the number of independent compomemts for fMRI data. Human Brain Mapping. 2007;28:1251–1266. doi: 10.1002/hbm.20359. [DOI] [PMC free article] [PubMed] [Google Scholar]
- Lindell AK. In your right mind: right hemisphere contributions to language processing and production. Neuropsychology Review. 2006;16:131–148. doi: 10.1007/s11065-006-9011-9. [DOI] [PubMed] [Google Scholar]
- Maldjian JA, Laurienti PJ, Kraft RA, Burdette JH. An automated method for neuroanatomic and cytoarchitectonic atlas-based interrogation of fmri data sets. NeuroImage. 2003;19:1233–1239. doi: 10.1016/s1053-8119(03)00169-1. [DOI] [PubMed] [Google Scholar]
- Martin A, Chao LL. Semantic memory and the brain: structure and processes. Current Opinion in Neurobiology. 2001;11:194–201. doi: 10.1016/s0959-4388(00)00196-3. [DOI] [PubMed] [Google Scholar]
- McKeown MJ, Makeig S, Brown GG, Jung TP, Kindermann SS, Bell AJ, Sejnowski TJ. Analysis of fMRI data by blind separation into independent spatial components. Human Brain Mapping. 1998;6(3):160–188. doi: 10.1002/(SICI)1097-0193(1998)6:3<160::AID-HBM5>3.0.CO;2-1. [DOI] [PMC free article] [PubMed] [Google Scholar]
- McKeown MJ, Hansen LK, Sejnowsk TJ. Independent component analysis of functional MRI: what is signal and what is noise? Curr Opin Neurobiol. 2003;13(5):620–9. doi: 10.1016/j.conb.2003.09.012. [DOI] [PMC free article] [PubMed] [Google Scholar]
- McKiernan KA, Kaufman JN, Kucera-Thompson J, Binder JR. A parametric manipulation of factors affecting task-induced deactivation in functional neuroimaging. Journal of Cognitive Neuroscience. 2003;15(3):394–408. doi: 10.1162/089892903321593117. [DOI] [PubMed] [Google Scholar]
- Meyer AM, Federmeier KD. The divided visual world paradigm: Eye tracking reveals hemispheric asymmetries in lexical ambiguity resolution. Brain Research. 2008;1222:166–183. doi: 10.1016/j.brainres.2008.05.033. [DOI] [PMC free article] [PubMed] [Google Scholar]
- Mitchell RL. fMRI delineation of working memory for emotional prosody in the brain: commonalities with the lexico-semantic emotion network. Neuroimage. 2007;36:1015–1025. doi: 10.1016/j.neuroimage.2007.03.016. [DOI] [PubMed] [Google Scholar]
- Morcom AM, Fletcher PC. Does the brain have a baseline? Why we should be resisting a rest. Neuroimage. 2007;37:1073–1082. doi: 10.1016/j.neuroimage.2007.06.019. [DOI] [PubMed] [Google Scholar]
- Raichle ME, MacLeod AM, Snyder AZ, Powers WJ, Gusnard DA, Shulman GL. A default mode of brain function. The Proceedings of the National Academy of Sciences. 2001;98(2):676–682. doi: 10.1073/pnas.98.2.676. [DOI] [PMC free article] [PubMed] [Google Scholar]
- Raichle ME, Snyder AZ. A default mode of brain function: a brief history of an evolving idea. Neuroimage. 2007;37:1083–1090. doi: 10.1016/j.neuroimage.2007.02.041. [DOI] [PubMed] [Google Scholar]
- Raz J, Zheng H, Ombao H, Turetsky B. Statistical tests for fMRI based on experimental randomization. Neuroimage. 2003;19:226–232. doi: 10.1016/s1053-8119(03)00115-0. [DOI] [PubMed] [Google Scholar]
- Siman-Tov T, Mendelsohn A, Schonberg T, Avidan G, Podlipsky I, Pessoa L, Gadoth N, Ungerleider LG, Hendler T. Bihemispheric leftward bias in a visuospatial attention-related network. Journal of Neuroscience. 2007;27(42):11271–11278. doi: 10.1523/JNEUROSCI.0599-07.2007. [DOI] [PMC free article] [PubMed] [Google Scholar]
- Stevens MC, Kiehl KA, Pearlson G, Calhoun VD. Functional neural circuits for mental timekeeping. Human Brain Mapping. 2007;28(5):394–408. doi: 10.1002/hbm.20285. [DOI] [PMC free article] [PubMed] [Google Scholar]
- Talairach J, Tournoux P. A co-planar stereotaxic atlas of a human brain. New York: Thieme; 1988. [Google Scholar]
- Thomas CG, Harshman RA, Menon RS. Noise reduction in BOLD-based fMRI using component analysis. Neuroimage. 2002;17(3):1521–37. doi: 10.1006/nimg.2002.1200. [DOI] [PubMed] [Google Scholar]
- Thompson-Schill SL, D’Esposito M, Aguirre GK, Farah MJ. Role of left inferior prefrontal cortex in retrieval of semantic knowledge: a reevaluation. Proceedings of the National Academy of Sciences of the United States of America. 1997;94:14792–14797. doi: 10.1073/pnas.94.26.14792. [DOI] [PMC free article] [PubMed] [Google Scholar]
- Tohka J, Foerde K, Aron AR, Tom SM, Toga AW, Poldrack RA. Automatic independent component labeling for artifact removal in fMRI. Neuroimage. 2008;39(3):1227–45. doi: 10.1016/j.neuroimage.2007.10.013. [DOI] [PMC free article] [PubMed] [Google Scholar]
- Tulving E. Episodic and semantic memory. In: Tulving E, Donaldson W, editors. Organization of memory. New York: Academic Press; 1972. [Google Scholar]
- Wierenga CE, Benjamin M, Gopinath K, Perlstein WM, Leonard CM, Rothi LJ, Conway T, Cato MA, Briggs R, Crosson B. Age-related changes in word retrieval: role of bilateral frontal and subcortical networks. Neurobiology of Aging. 2008;29:436–451. doi: 10.1016/j.neurobiolaging.2006.10.024. [DOI] [PubMed] [Google Scholar]
- Worsley KJ, Taylor JE. Detecting fMRI activation allowing for unknown latency of the hemodynamic response. Neuroimage. 2006;29(2):649–54. doi: 10.1016/j.neuroimage.2005.07.032. [DOI] [PubMed] [Google Scholar]
- Yochim BP, Kender R, Abeare C, Gustafson A, Whitman RD. Semantic activation within and across the cerebral hemispheres: what’s left isn’t right. Laterality. 2005;10:131–148. doi: 10.1080/13576500342000356. [DOI] [PubMed] [Google Scholar]