

Abstract
Identification of the protein constituents of cell organelles forms the basis for studies to define the roles of specific proteins in organelle structure and functions. Over the past decade, the use of mass spectrometry-based proteomics has dissected various organelles and allowed the association of many novel proteins with particular organelles. This review chronicles the evolution of organelle proteomics technology, and discusses how many limitations, such as organelle heterogeneity and purity, can be avoided with recently developed quantitative profiling approaches. Although many challenges remain, quantitative profiling of organelles holds the promise to begin to address the complex and dynamic shuttling of proteins among organelles that will be critical for application of this advanced technology to disease-based changes in organelle function.
Keywords: organelle proteomics, subtractive organelle proteomics, quantitative organelle profiling, digital organelle signature, mass spectrometry
1. Introduction
Eukaryotic cells are organized into functionally distinct, membrane-enclosed compartments or organelles, such as the nucleus, endoplasmic reticulum (ER), Golgi, and mitochondria. Comprehensive knowledge of the organelle constituents, in particular proteins, can provide important information on the structure and function of the cell. Traditionally, microscopy is used to characterize the subcellular localization of individual proteins, employing antibodies or expression of tagged proteins. In the post-genomics era, global analysis of subcellular localization of large fractions of the proteome has become possible. Successful studies in yeast employed fluorescently tagged proteins to characterize their proteome-wide subcellular localizations (1, 2). However, such tag-based microscopic analyses cannot decipher more complex mammalian systems, primarily due to technical difficulties with the generation of genome-wide tagging constructs that can consistently express mammalian proteins at wild type levels.
An alternative approach to analyze the association of proteins with specific organelles is to isolate organelles using biochemical methods followed by identification of proteins in the isolated organelles. Mass spectrometry (MS)-based proteomics has proven to be a powerful tool to identify and quantify proteins in various complex protein systems, including organelles (3). Data generated using the combined approach of biochemical isolation of organelles and MS analysis over the past decade have established the association of a number of novel proteins with particular subcellular fractions. However, the difficulties with purification of the organelle in question to homogeneity as well protein identification problems with MS analysis result in a high false identification rate. These problems have led to the development of more advanced methods to determine protein associations among subcellular fractions (4–6). Assisted by quantitative profiles of subcellular distributions and improved protein identification with the new generation of mass spectrometers (7), the accuracy of protein associations with specific organelles has been significantly improved. In this review, we focus on the evolution of technology for organelle proteomics research, starting from simple cataloging attempts in the early years to the quantitative organelle profiling analysis that emerged about two years ago. Example organelles are used to discuss the application of individual methodologies, and limitations and advantages of the approaches are provided. Perspectives regarding future directions and challenges are also considered. For comprehensive profiles of specific organelles, readers are referred to previously published review articles (8–10) and other original publications in the field that cannot be covered in this review due to space limitation.
2. Cataloguing proteins from isolated organelles identifies organelle-associated proteins and contaminants
The initial approach used to profile organelle proteins was to isolate organelles by traditional subcellular fractionation methods, such as differential centrifugation and density gradient fractionation, followed by identification of protein components in the target organelles using mass spectrometry (Figure 1A). Application of this strategy over the past decade has led to the identification of protein components of numerous organelles listed in Table 1. These studies have provided a wealth of information on the proteins associated with particular organelle fractions, including many novel proteins. However, the success of this method depends heavily upon purification of the target organelles to near homogeneity with sufficient protein recovery for in-depth analysis. It is difficult, if not impossible, to obtain a “pure” organelle from subcellular fractionation approaches. For example, in profiling the Golgi proteome using density gradient centrifugation and MS analysis, only 151 of the 421 total identified proteins were annotated as either bona fide or novel putative Golgi proteins (11). In addition to the limitations of separation approaches, organelles are frequently heterogeneous in their size and ultrastructural properties although they are microscopically defined by their morphology. Therefore, data acquired by such high-throughput analysis need to be further tested by other experimental and bioinformatics approaches to remove false positive contaminants. Unfortunately, many databases have utilized data from such cataloguing studies, and it is thus critical to determine the basis of any protein organelle association.
Figure 1. Development of new strategies for proteomics analysis to more accurately associate proteins with specific organelles.
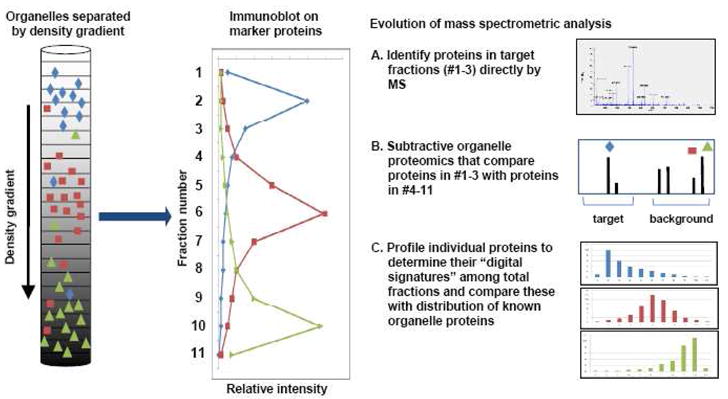
Partial separation of 3 organelles (individual organelles displayed with different colors and shapes) by density gradient fractionation are shown schematically on the left. The middle panel demonstrates a typical distribution pattern of individual fractions analyzed by immunoblot analysis of organelle marker proteins. Three different approaches to analyze the mass spectrometric data are illustrated in the right panel: A. direct identification of proteins in specific fractions of purified organelle; B. organelle fraction identifications after subtraction of proteins in background fractions using different qualitative and quantitative approaches; C. identification and quantification of proteins in all fractions, and establishment of a quantitative distribution pattern among all of the fractions for each protein to create an organelle signature based on the distribution of organelle marker proteins. The third approach can be used to profile organelles and predict subcellular localization of unknown proteins.
Table 1.
MS-based proteomics analysis has evolved to optimize the assignment of proteins with specific organelles
| Organelle | Isolation method | Proteomics approach | Species | Tissue/cell type | Reference |
|---|---|---|---|---|---|
| Cataloguing proteins from isolated organelles | |||||
| Traditional fractionation: | |||||
| Clathrin-coated vesicle | Differential and density gradient centrifugation | 1D, LC-MS/MS | Rat | Brain | (41) |
| Endoplasmic reticulum | Density gradient centrifugation | 2D, MS/MS | Mouse | Liver | (42) |
| Endoplasmic reticulum- Golgi intermediate compartment | Density gradient centrifugation | 1D, LC-MS/MS | Human | HepG2 liver cell line | (43) |
| Exosome | Differential centrifugation | 1/2D, LC-MS/MS | Human | Melanoma cell lines SK-MEL-28 and MeWo; urine | (44, 45) |
| Golgi | Detergent extraction, anion-exchange chromatography | 2D, LC-MS/MS | Rat | Liver | (46) |
| Detergent partitioning | 2D, LC-MS/MS, Edmon sequencing | Rat | Liver | (47) | |
| Density gradient fractionation, high PH and detergent extraction | 2D, LC-MS/MS | Rat | Liver, epithelial cells | (48) | |
| Lipid raft | Density gradient fractionation | 1D, LC-MS/MS | Human | Monocytic cell line THP-1 | (49) |
| Density gradient fractionation | 2D, MS/MS | Human | Jurkat T cell line | (50) | |
| Mitochondria | Differential and density gradient centrifugation | 1D, LC-MS/MS | Human & mouse | Heart, Jurkat A3 cell line, & brain, heart, kidney, liver | (39, 51, 52) |
| Nuclear pore | Differential centrifugation | 1D, MS/MS | Rat & yeast | Liver & N/A | (53, 54) |
| Nucleolus | Differential centrifugation | LC-MS/MS | Human | Hela cell line | (36, 55) |
| Plasma membrane | Density gradient centrifugation | 1/2D, LC-MS/MS | Rat & mouse | Lung endothelial cells; brain cortex & hippocampal | (56, 57)] |
| Spindle pole | Differential centrifugation | 1D, LC-MS/MS | Human | Hela S3 cell line | (58) |
| Synaptic vesicle and postsynaptic density fractions | Differential and density gradient centrifugation | 1/2D, LC-MS/MS | Rat | Brain | (59, 60) |
| Biochemical enrichment: | |||||
| Lysosome | Affinity purification via mannose-6-phosphate receptor | 2D, LC-MS/MS | Human & mouse | U937 and MCF7 cell line & embryonic fibroblasts | (15, 16) |
| Triton filling and density gradient fractionation | 1D, LC-MS/MS | Rat | Liver | (14) | |
| Mitochondria | Differential centrifugation and free flow electrophoresis | 2D, MS/MS | Yeast | (20, 21) | |
| Density gradient fractionation and free flow electrophoresis | LC MS/MS | Yeast | (22) | ||
| Phagosome | Latex bead-containing phagosome | 2D, LC-MS/MS | Mouse | J774 macrophage-like cell line; Macrophage | (12, 13) |
| Plasma membrane | Isolation of biotinylated cell surface proteins | 2D, LC-MS/MS | Human | Neuroblastoma, lung, epithelial, colon cells | (18, 19) |
| Postsynaptic protein complex | Antibody-based affinity purification | 1D, LC-MS/MS | Rat | Brain | (61) |
| Spliceosome | Gel filtration and affinity purification | 1/2D, LC-MS/MS | Yeast | (62) | |
| Affinity purification of tagged splicesome | LC-MS/MS | Human | Hela cell line | (17) | |
|
| |||||
|
Subtractive organelle proteomics | |||||
| Clathrin-coated vesicle | Differential and density gradient centrifugation | 2D-DIGE, LC-MS/MS, iTRAQ | Human | Hela cell line | (28) |
| Lipid raft | Density gradient fractionation | LC-MS/MS, SILAC | Human | Hela cell line | (26) |
| Nuclear envelope | Differential centrifugation | LC-MS/MS | Rodent | Liver | (23) |
| Nuclear extract | Differential centrifugation | 2D, LC-MS/MS | Mouse | Embryonic stem cells and embryonic germ cells | (63) |
| Peroxisome | Density gradient fractionation | LC-MS/MS, ICAT | Yeast | (29) | |
| Plasma membrane | Fractionation for plasma membranes and caveolae | 1/2D, LC-MS/MS | Rat | Various tissues, cell line | (56) |
| Postsynaptic density fractions | Differential and density gradient centrifugation | MS/MS, ICAT | Rat | Brain | (32) |
| Vacuolar membrane | Density centrifugation | LC-MS/MS | Yeast | (64) | |
|
| |||||
|
Quantitative profiling for organelle signatures | |||||
| Centrosome | Density gradient fractionation | LC-MS/MS, PCP | Human | Lymphoblastic cell line KE-37 | (33) |
| Endoplasmic reticulum, Golgi | Differential centrifugation and density gradient fractionation | 1D, LC-MS/MS, redundant peptide(spectral) counting | Rat | Liver | (6) |
| Endoplasmic reticulum, Golgi, Mitochondria, Plasma membrane, | Differential centrifugation and density gradient fractionation | LC-MS/MS, ICAT, iTRAQ | Arabidopsi s thaliana | (4, 35) | |
| Endoplasmic reticulum, Golgi, Endoplasmic reticulum/Golgi vesicles, Mitochondria, Nucleus, Plasma membrane | Density gradient fractionation | LC-MS/MS, PCP | Mouse | Liver | (5) |
| Peroxisome | Density gradient fractionation | 1D, LC-MS/MS, PCP | Mouse | Kidney | (34) |
Key to abbreviations used in the table: LC, liquid chromatography; MS/MS, tandem mass spectrometry, 1/2D, one- or two-dimensional gel electrophoresis; 2D-DIGE, two-dimensional difference gel electrophoresis; iTRAQ, isobaric tags for relative and absolute quantification; SILAC, stable isotope-labeling with amino acids in cell culture; ICAT, isotope-coated affinity tag; PCP, protein correlation profiling.
In an effort to improve specificity of organelle isolation and reduce possible contaminants, different biochemical enrichment approaches have been reported for purification of several specific organelles (see Table 1, biochemical enrichment). For example, to isolate the phagosome, macrophages were fed latex beads that altered their physical properties and allowed their separation from other organelles (12, 13). A similar approach has been reported for isolation of lysosomes filled with Triton WR1339 (14) that altered the lysosomal centrifugation properties. A more specific approach to isolate organelles is to use affinity chromatography targeting organelle-specific proteins. Successful application was reported for purification of a subset of lysosomal proteins carrying mannose-6-phosphate modifications. Proteins with the mannose-6-phosphate structure were affinity purified on immobilized mannose-6-phosphate receptor and then identified by MS (15, 16). Affinity purification can also be achieved by specifically tagging organelle specific proteins. To profile the spliceosome, Zhou and colleagues tagged pre-mRNA (used to reconstitute the spliceosome) with three hairpins that can be specifically recognized by a bacteriophage coat protein MS2. Then the tagged spliceosome, bound with the MS2 fused with maltose-binding protein, was subsequently purified using maltose-binding protein affinity chromatography. The acquired spliceosome was functional in splicing mRNA, and 145 spliceosomal proteins were identified from this complex (17). A tagging strategy was also utilized to isolate plasma membrane proteins. The plasma membrane proteins were effectively fractionated by labeling the lysine residues of the extracellular domain of cell surface proteins with biotin tags. The labeled plasma membrane proteins were affinity purified using streptavidin or avidin chromatography and subsequently identified by MS (18, 19). In addition to enrichment approaches, advanced biochemical separation technology, such as free-flow electrophoresis, has been utilized to purify mitochondria based on their surface charge with improved proteome coverage (20–22). Although such biochemical approaches increase the purity of isolated organelles in comparison with the use of simple, density gradient fractionation methods, complete removal of contaminant proteins is hard to achieve. Therefore, elimination of false-positive identifications again requires further testing, or application of other proteomic strategies discussed below.
3. Subtractive organelle proteomics help distinguish organelle-associated proteins from background proteins
Subtractive proteomics strategies were developed to reduce the frequency of false-positive contaminants in organelle fractions (23). To examine proteins in a nuclear envelope fraction by MS, a post-nuclear microsomal fraction was also analyzed in parallel. Proteins identified in the microsomal fractions, presumably containing no nuclear envelope, were considered as background and then subtracted from the proteins in the nuclear envelope fraction. Using this strategy, 80 nuclear envelope proteins were identified with high fidelity. However, this background subtraction scheme utilizes two protein lists from separate proteomics analyses, and thus can lead to both false negative and false positive identifications. For example, a false negative result can arisefrom subtraction of any identification in the background sample, even if its amount is significantly less than that in the test sample. On the other hand, differences in sample complexities and dynamic ranges between the test and background fractions can lead to identifications in the test but not the background sample and thus generate false positive results. Consequently, such qualitative-based subtractive proteomics have been most useful for samples with similar compositions, and for data acquired with high performance mass spectrometers.
Some of the limitations of early subtractive proteomics have been circumvented by the development of quantitative proteomics approaches that allow comparison of the relative abundance of proteins from the target and control fraction in the identical analytical environment following sample combination. Foster and colleagues utilized SILAC-based isotope labeling to analyze lipid rafts (24, 25), with heavy isotopes for samples containing lipid rafts and light isotopes for control samples treated with cholesterol-disrupting agents to remove lipid rafts (26). Following cell lysis, samples with equal amounts of protein were combined, prepared for lipid raft fractionation, and then analyzed by MS. This quantitative proteomics analysis allowed assignment of proteins with different heavy/light ratios into three protein groups: raft proteins (ratio > 7.5), raft-associated proteins (ratio > 3.0 but <7.5), or nonspecific proteins (ration < 3.0). A second study to profile clathrin-coated vesicles used heavy and light iTRAQ reagents to label an untreated sample and one in which the clathrin heavy chain was knocked down by siRNA (27). The combined samples were processed, analyzed by MS and the acquired proteins with light/heavy ratios >2 were referred to as clathrin coated vesicle-associated proteins (28). For both of these studies, the application of quantified ratios between the sample and control fractions was the basis for subtraction of false identifications, an advance that lowers error rates. However, the use of arbitrary thresholds rather than statistical analyses as the basis for assignment of organelle associations remains a limitation.
A unique attribute of quantitative subtractive proteomics is that it is less dependent upon absolute purification of organelle fractions, and thus can even be applied when ideal fractionations are not possible. This is illustrated by the method used to monitor the relative enrichment of proteins during purification of yeast peroxisomes (29) in which samples before and after a specific affinity purification step were differentially labeled with light and heavy ICAT reagent (30), respectively. True peroxisomal proteins, which were enriched during the affinity purification, were expected to have relatively high heavy/light ratios, and statistical analysis was then applied to the quantified proteins. Proteins with ratios significantly higher than a statistically determined threshold were assigned to the peroxisomal protein group, while all the others were assigned to the background group and subtracted. To monitor the enrichment of specific organelles, similar studies targeting zymogen granules using iTRAQ and postsynaptic density fractions using ICAT have been reported (31, 32). An advantage of quantitative subtractive proteomics is that it can be used to profile any organelle fractions that utilize enrichment or purification steps. As shown in Figure 1 (method B), the target organelle protein (displayed as a blue diamond) in a partially enriched organelle sample from a density gradient fractionation is predominantly distributed in fractions 1–3 among the 11 acquired fractions. Consequently, labeling fractions 1–3 (enriched) and fractions 4–11 (depleted) with light and heavy isotope reagents, respectively, leads to elevated light/heavy ratios in MS analysis of proteins associated with the target organelle. Other proteins with low light/heavy ratios are considered as background and are subtracted from the positive dataset. Application of the quantitative subtractive organelle proteomics represents a significant advance and has led to improved accuracy of protein organelle profiling, even with fractions of partially purified organelles.
4. Quantitative profiling of organelles improves the quality of organelle assignment
Quantitative proteomics has also been used to directly monitor protein distributions among subcellular fractions. As illustrated in Figure 1 (method C), MS analysis of all 11 partially separated fractions can measure the relative abundance of each identified protein among different fractions. Application of bioinformatics analysis can therefore be used to obtain a quantitative distribution pattern for each protein among all fractions. Proteins with similar distribution patterns are assumed to be in the same organelle. By examining the relative match of the quantitative distribution of each protein with that of the organelle marker proteins, the organelle association for each protein can be determined. This is akin to the traditional protein organelle assignment using subcellular fractionation except that proteins are quantified by MS instead of by immunoblot.
In the past several years, quantitative protein profiling has been successfully used to analyze organelles. Profiling the centrosome was the focus of the first report that measured the relative precursor ion intensities of peptides identified by MS in sequential sucrose gradient fractions (33). The authors developed a method termed protein correlation profiling (PCP) to acquire the distribution pattern among fractions for each protein. A consensus distribution pattern shared by many known centrosomal proteins was derived that constituted a digital organelle signature for the centrosome. This digital organelle signature was useful in predicting novel centrosomal proteins as illustrated by the validation of 19 of the 23 novel centrosomal proteins using other subcellular localization approaches. A similar PCP-based approach successfully profiled the mouse peroxisome (34).
The PCP platform was subsequently further expanded as a means to characterize multiple organelles simultaneously, including the nucleus, ER, Golgi, ER/Golgi vesicles, plasma membrane, and mitochondria (5). Digital signatures (or quantitative distribution patterns) for these organelles were successfully acquired from partially separated subcellular fractions. In addition to the PCP, the digital organelle signatures can also be acquired from the subcellular fractions using other quantitative proteomics methods. An example is an analysis platform termed “localization of organelle proteins by isotope tagging” (LOPIT) in which the commercial available stable isotope labeling reagents (ICAT and iTRAQ) were used for the quantitation (4, 35). Using LOPIT, digital signatures were successfully acquired for organelles of endoplasmic reticulum, Golgi, plasma membrane, vacuole, and mitochondria on fractions labeled with isotopic reagents. Similarly, organelle signatures for the ER, Golgi and Golgi-derived COPI-coated vesicles (transport vesicles between the Golgi and ER) were determined in an independent study by simply quantifying redundant peptides for each identified protein combined with significant bioinformatics support (6). Together, these studies demonstrate that multiple organelles can be profiled simultaneously from a partially fractionated sample utilizing various quantitative proteomics methods, and can allow acquisition of digital signatures for the organelles based upon statistical analysis.
The quantitative proteomics platforms described above have successfully identified quantitative organelle patterns, and significantly improve the quality of organelle assignment for each identified protein. Advantages of these quantitative platforms include the fact that organelles can be profiled without the necessity of complete purification of the target organelles, and data from organelle profiles can be more accurately managed with quantitative annotations. In addition, the acquired organelle signatures appear to be more robust, in large part because they are defined by consensus distribution patterns shared by a group of known resident proteins rather than by one or two marker protein(s) used in traditional organelle analysis. The ability to profile multiple organelles from a single fractionation experiment represents a significant advance, and provides the possibility to analyze the complexity of proteins shuttling among organelles.
5. Conclusion and challenges
Although organelle proteomics has a relatively short history of about 10 years, it has developed rapidly and has provided important information on the constitution and functional organization of organelles. While the accuracy of assigned organelle associations has remained a serious limitation, significant improvements have been made recently that reduce the false positive rate. The new generation of mass spectrometers with high mass accuracy and resolving power, particularly the FT-ICR and LTQ-Orbitrap (7), have made a major contribution to this improvement. Data quality with new quantitative proteomic approaches is better controlled and documented, even with the similar organelle purification methods. Application of this advanced technology to additional organelle analyses has the potential to provide a more comprehensive and accurate understanding of the subcellular localization of the proteome.
However, organelle proteomics must still surmount at least two major challenges. The first is to develop strategies to profile dynamic changes in organelle constituents following different stimuli. Although organelles are composed of resident proteins, many proteins shuttle among different organelles, and their redistribution is critical for different organelle functions. Current organelle profiles are often measured under steady state conditions, but evaluation of changes in protein distribution under different conditions could provide important clues to protein function and the specific impact of molecular perturbations, including various disease states. The recent emergence of quantitative organelle proteomics technologies, especially those able to profile multiple organelles at the same time (4–6), provide the necessary tools to dissect dynamic states of organelles by comparing different snapshots of the organelle profiles. Early attempts at dynamic profiling are beginning to appear (36, 37). However, such approaches are still in their infancy and face the difficult task of distinguishing proteins dynamically shuttling among organelles from the contaminants. It will require accurate and reproducible organelle assignment for all proteins at each measured state before such comparisons are possible..
A second challenge is to determine the extent to which the composition of organelles may vary between different cells and tissues. Several proteomics studies suggest that organelle constituents may be distinct in different tissues (38–40). As shown in Table 1, the majority of tissue proteomics have been conducted on liver samples. A recent publication illustrates the power of dynamic profiling of synaptic proteins to identify protein changes within one hour of treatment (65). The continued expansion of organelle profiling to more diversified samples can be expected in the next few years, and is particularly important, as illustrated in the recent publication profiling synaptic proteins (65), to the application of basic cell biological studies to disease-based pathology.
Acknowledgments
This work was supported in part by Federal funds from the National Heart, Lung and Blood Institute and National Institutes of Health, under Contract N01-HV-28179, and HL18645.
Footnotes
Publisher's Disclaimer: This is a PDF file of an unedited manuscript that has been accepted for publication. As a service to our customers we are providing this early version of the manuscript. The manuscript will undergo copyediting, typesetting, and review of the resulting proof before it is published in its final citable form. Please note that during the production process errors may be discovered which could affect the content, and all legal disclaimers that apply to the journal pertain.
References
- 1.Huh WK, Falvo JV, Gerke LC, Carroll AS, Howson RW, Weissman JS, O’Shea EK. Global analysis of protein localization in budding yeast. Nature. 2003;425:686–691. doi: 10.1038/nature02026. [DOI] [PubMed] [Google Scholar]
- 2.Matsuyama A, Arai R, Yashiroda Y, Shirai A, Kamata A, Sekido S, Kobayashi Y, Hashimoto A, Hamamoto M, Hiraoka Y, et al. ORFeome cloning and global analysis of protein localization in the fission yeast Schizosaccharomyces pombe. Nat Biotech. 2006;24:841–847. doi: 10.1038/nbt1222. [DOI] [PubMed] [Google Scholar]
- 3.Aebersold R, Mann M. Mass spectrometry-based proteomics. Nature. 2003;422:198–207. doi: 10.1038/nature01511. [DOI] [PubMed] [Google Scholar]
- 4.Dunkley TP, Hester S, Shadforth IP, Runions J, Weimar T, Hanton SL, Griffin JL, Bessant C, Brandizzi F, Hawes C, et al. Mapping the Arabidopsis organelle proteome. Proc Natl Acad Sci U S A. 2006;103:6518–6523. doi: 10.1073/pnas.0506958103. [DOI] [PMC free article] [PubMed] [Google Scholar]
- 5.Foster LJ, de Hoog CL, Zhang Y, Zhang Y, Xie X, Mootha VK, Mann M. A mammalian organelle map by protein correlation profiling. Cell. 2006;125:187–199. doi: 10.1016/j.cell.2006.03.022. [DOI] [PubMed] [Google Scholar]
- 6.Gilchrist A, Au CE, Hiding J, Bell AW, Fernandez-Rodriguez J, Lesimple S, Nagaya H, Roy L, Gosline SJ, Hallett M, et al. Quantitative proteomics analysis of the secretory pathway. Cell. 2006;127:1265–1281. doi: 10.1016/j.cell.2006.10.036. [DOI] [PubMed] [Google Scholar]
- 7.Domon B, Aebersold R. Mass spectrometry and protein analysis. Science. 2006;312:212–217. doi: 10.1126/science.1124619. [DOI] [PubMed] [Google Scholar]
- 8.Brunet S, Thibault P, Gagnon E, Kearney P, Bergeron JJ, Desjardins M. Organelle proteomics: looking at less to see more. Trends Cell Biol. 2003;13:629–638. doi: 10.1016/j.tcb.2003.10.006. [DOI] [PubMed] [Google Scholar]
- 9.Warnock DE, Fahy E, Taylor SW. Identification of protein associations in organelles, using mass spectrometry-based proteomics. Mass Spectrom Rev. 2004;23:259–280. doi: 10.1002/mas.10077. [DOI] [PubMed] [Google Scholar]
- 10.Yates JR, 3rd, Gilchrist A, Howell KE, Bergeron JJ. Proteomics of organelles and large cellular structures. Nat Rev Mol Cell Biol. 2005;6:702–714. doi: 10.1038/nrm1711. [DOI] [PubMed] [Google Scholar]
- 11.Wu CC, MacCoss MJ, Mardones G, Finnigan C, Mogelsvang S, Yates JR, 3rd, Howell KE. Organellar proteomics reveals Golgi arginine dimethylation. Mol Biol Cell. 2004;15:2907–2919. doi: 10.1091/mbc.E04-02-0101. [DOI] [PMC free article] [PubMed] [Google Scholar]
- 12.Garin J, Diez R, Kieffer S, Dermine JF, Duclos S, Gagnon E, Sadoul R, Rondeau C, Desjardins M. The phagosome proteome: insight into phagosome functions. J Cell Biol. 2001;152:165–180. doi: 10.1083/jcb.152.1.165. [DOI] [PMC free article] [PubMed] [Google Scholar]
- 13.Houde M, Bertholet S, Gagnon E, Brunet S, Goyette G, Laplante A, Princiotta MF, Thibault P, Sacks D, Desjardins M. Phagosomes are competent organelles for antigen cross-presentation. Nature. 2003;425:402–406. doi: 10.1038/nature01912. [DOI] [PubMed] [Google Scholar]
- 14.Bagshaw RD, Mahuran DJ, Callahan JW. A proteomic analysis of lysosomal integral membrane proteins reveals the diverse composition of the organelle. Mol Cell Proteomics. 2005;4:133–143. doi: 10.1074/mcp.M400128-MCP200. [DOI] [PubMed] [Google Scholar]
- 15.Journet A, Chapel A, Kieffer S, Roux F, Garin J. Proteomic analysis of human lysosomes: application to monocytic and breast cancer cells. Proteomics. 2002;2:1026–1040. doi: 10.1002/1615-9861(200208)2:8<1026::AID-PROT1026>3.0.CO;2-I. [DOI] [PubMed] [Google Scholar]
- 16.Kollmann K, Mutenda KE, Balleininger M, Eckermann E, von Figura K, Schmidt B, Lubke T. Identification of novel lysosomal matrix proteins by proteome analysis. Proteomics. 2005;5:3966–3978. doi: 10.1002/pmic.200401247. [DOI] [PubMed] [Google Scholar]
- 17.Zhou Z, Licklider LJ, Gygi SP, Reed R. Comprehensive proteomic analysis of the human spliceosome. Nature. 2002;419:182–185. doi: 10.1038/nature01031. [DOI] [PubMed] [Google Scholar]
- 18.Zhang W, Zhou G, Zhao Y, White MA, Zhao Y. Affinity enrichment of plasma membrane for proteomics analysis. Electrophoresis. 2003;24:2855–2863. doi: 10.1002/elps.200305569. [DOI] [PubMed] [Google Scholar]
- 19.Shin BK, Wang H, Yim AM, Le Naour F, Brichory F, Jang JH, Zhao R, Puravs E, Tra J, Michael CW, et al. Global profiling of the cell surface proteome of cancer cells uncovers an abundance of proteins with chaperone function. J Biol Chem. 2003;278:7607–7616. doi: 10.1074/jbc.M210455200. [DOI] [PubMed] [Google Scholar]
- 20.Zischka H, Weber G, Weber PJ, Posch A, Braun RJ, Buhringer D, Schneider U, Nissum M, Meitinger T, Ueffing M, et al. Improved proteome analysis of Saccharomyces cerevisiae mitochondria by free-flow electrophoresis. Proteomics. 2003;3:906–916. doi: 10.1002/pmic.200300376. [DOI] [PubMed] [Google Scholar]
- 21.Zischka H, Braun RJ, Marantidis EP, Buringer D, Bornhovd C, Hauck SM, Demmer O, Gloeckner CJ, Reichert AS, Madeo F, et al. Differential Analysis of Saccharomyces cerevisiae Mitochondria by Free Flow Electrophoresis. 2006:2185–2200. doi: 10.1074/mcp.T600018-MCP200. [DOI] [PubMed] [Google Scholar]
- 22.Prokisch H, Scharfe C, Camp DG, 2nd, Xiao W, David L, Andreoli C, Monroe ME, Moore RJ, Gritsenko MA, Kozany C, et al. Integrative analysis of the mitochondrial proteome in yeast. PLoS Biol. 2004;2:e160. doi: 10.1371/journal.pbio.0020160. [DOI] [PMC free article] [PubMed] [Google Scholar]
- 23.Schirmer EC, Florens L, Guan T, Yates JR, 3rd, Gerace L. Nuclear membrane proteins with potential disease links found by subtractive proteomics. Science. 2003;301:1380–1382. doi: 10.1126/science.1088176. [DOI] [PubMed] [Google Scholar]
- 24.Ong SE, Blagoev B, Kratchmarova I, Kristensen DB, Steen H, Pandey A, Mann M. Stable isotope labeling by amino acids in cell culture, SILAC, as a simple and accurate approach to expression proteomics. Mol Cell Proteomics. 2002;1:376–386. doi: 10.1074/mcp.m200025-mcp200. [DOI] [PubMed] [Google Scholar]
- 25.Ong SE, Mann M. Stable isotope labeling by amino acids in cell culture for quantitative proteomics. Methods Mol Biol. 2007;359:37–52. doi: 10.1007/978-1-59745-255-7_3. [DOI] [PubMed] [Google Scholar]
- 26.Foster LJ, De Hoog CL, Mann M. Unbiased quantitative proteomics of lipid rafts reveals high specificity for signaling factors. Proc Natl Acad Sci U S A. 2003;100:5813–5818. doi: 10.1073/pnas.0631608100. [DOI] [PMC free article] [PubMed] [Google Scholar]
- 27.Ross PL, Huang YN, Marchese J, Williamson B, Parker K, Hattan S, Khainovski N, Pillai S, Dey S, Daniels S, et al. Multiplexed protein quantitation in saccharomyces cerevisiae using amine-reactive isobaric tagging reagents. Mol Cell Proteomics. 2004:M400129–MCP400200. doi: 10.1074/mcp.M400129-MCP200. [DOI] [PubMed] [Google Scholar]
- 28.Borner GH, Harbour M, Hester S, Lilley KS, Robinson MS. Comparative proteomics of clathrin-coated vesicles. J Cell Biol. 2006;175:571–578. doi: 10.1083/jcb.200607164. [DOI] [PMC free article] [PubMed] [Google Scholar]
- 29.Marelli M, Smith JJ, Jung S, Yi E, Nesvizhskii AI, Christmas RH, Saleem RA, Tam YY, Fagarasanu A, Goodlett DR, et al. Quantitative mass spectrometry reveals a role for the GTPase Rho1p in actin organization on the peroxisome membrane. J Cell Biol. 2004;167:1099–1112. doi: 10.1083/jcb.200404119. [DOI] [PMC free article] [PubMed] [Google Scholar]
- 30.Gygi SP, Rist B, Gerber SA, Turecek F, Gelb MH, Aebersold R. Quantitative analysis of complex protein mixtures using isotope-coded affinity tags. Nat Biotechnol. 1999;17:994–999. doi: 10.1038/13690. [DOI] [PubMed] [Google Scholar]
- 31.Chen X, Walker AK, Strahler JR, Simon ES, Tomanicek-Volk SL, Nelson BB, Hurley MC, Ernst SA, Williams JA, Andrews PC. Organellar proteomics: analysis of pancreatic zymogen granule membranes. Mol Cell Proteomics. 2006;5:306–312. doi: 10.1074/mcp.M500172-MCP200. [DOI] [PubMed] [Google Scholar]
- 32.Li KW, Hornshaw MP, vanMinnen J, Smalla KH, Gundelfinger ED, Smit AB. Organelle Proteomics of Rat Synaptic Proteins: Correlation-Profiling by Isotope-Coded Affinity Tagging in Conjunction with Liquid Chromatography-Tandem Mass Spectrometry to Reveal Post-synaptic Density Specific Proteins. J Proteome Res. 2005;4:725–733. doi: 10.1021/pr049802+. [DOI] [PubMed] [Google Scholar]
- 33.Andersen JS, Wilkinson CJ, Mayor T, Mortensen P, Nigg EA, Mann M. Proteomic characterization of the human centrosome by protein correlation profiling. Nature. 2003;426:570–574. doi: 10.1038/nature02166. [DOI] [PubMed] [Google Scholar]
- 34.Wiese S, Gronemeyer T, Ofman R, Kunze M, Grou CP, Almeida JA, Eisenacher M, Stephan C, Hayen H, Schollenberger L, et al. Proteomics characterization of mouse kidney peroxisomes by tandem mass spectrometry and protein correlation profiling. Mol Cell Proteomics. 2007;6:2045–2057. doi: 10.1074/mcp.M700169-MCP200. [DOI] [PubMed] [Google Scholar]
- 35.Dunkley TPJ, Watson R, Griffin JL, Dupree P, Lilley KS. Localization of Organelle Proteins by Isotope Tagging (LOPIT) Mol Cell Proteomics. 2004;3:1128–1134. doi: 10.1074/mcp.T400009-MCP200. [DOI] [PubMed] [Google Scholar]
- 36.Andersen JS, Lam YW, Leung AK, Ong SE, Lyon CE, Lamond AI, Mann M. Nucleolar proteome dynamics. Nature. 2005;433:77–83. doi: 10.1038/nature03207. [DOI] [PubMed] [Google Scholar]
- 37.Yan W, Hwang D, Aebersold R. Quantitative proteomic analysis to profile dynamic changes in the spatial distribution of cellular proteins. Methods Mol Biol. 2008;432:389–401. doi: 10.1007/978-1-59745-028-7_26. [DOI] [PubMed] [Google Scholar]
- 38.Kislinger T, Cox B, Kannan A, Chung C, Hu P, Ignatchenko A, Scott MS, Gramolini AO, Morris Q, Hallett MT, et al. Global survey of organ and organelle protein expression in mouse: combined proteomic and transcriptomic profiling. Cell. 2006;125:173–186. doi: 10.1016/j.cell.2006.01.044. [DOI] [PubMed] [Google Scholar]
- 39.Mootha VK, Bunkenborg J, Olsen JV, Hjerrild M, Wisniewski JR, Stahl E, Bolouri MS, Ray HN, Sihag S, Kamal M, et al. Integrated analysis of protein composition, tissue diversity, and gene regulation in mouse mitochondria. Cell. 2003;115:629–640. doi: 10.1016/s0092-8674(03)00926-7. [DOI] [PubMed] [Google Scholar]
- 40.Kavanagh DM, Powell WE, Malik P, Lazou V, Schirmer EC. Organelle proteome variation among different cell types: lessons from nuclear membrane proteins. Subcell Biochem. 2007;43:51–76. doi: 10.1007/978-1-4020-5943-8_5. [DOI] [PubMed] [Google Scholar]
- 41.Blondeau F, Ritter B, Allaire PD, Wasiak S, Girard M, Hussain NK, Angers A, Legendre-Guillemin V, Roy L, Boismenu D, et al. Tandem MS analysis of brain clathrin-coated vesicles reveals their critical involvement in synaptic vesicle recycling. Proc Natl Acad Sci U S A. 2004;101:3833–3838. doi: 10.1073/pnas.0308186101. [DOI] [PMC free article] [PubMed] [Google Scholar]
- 42.Knoblach B, Keller BO, Groenendyk J, Aldred S, Zheng J, Lemire BD, Li L, Michalak M. ERp19 and ERp46, new members of the thioredoxin family of endoplasmic reticulum proteins. Mol Cell Proteomics. 2003;2:1104–1119. doi: 10.1074/mcp.M300053-MCP200. [DOI] [PubMed] [Google Scholar]
- 43.Breuza L, Halbeisen R, Jeno P, Otte S, Barlowe C, Hong W, Hauri HP. Proteomics of endoplasmic reticulum-Golgi intermediate compartment (ERGIC) membranes from brefeldin A-treated HepG2 cells identifies ERGIC-32, a new cycling protein that interacts with human Erv46. J Biol Chem. 2004;279:47242–47253. doi: 10.1074/jbc.M406644200. [DOI] [PubMed] [Google Scholar]
- 44.Mears R, Craven RA, Hanrahan S, Totty N, Upton C, Young SL, Patel P, Selby PJ, Banks RE. Proteomic analysis of melanoma-derived exosomes by two-dimensional polyacrylamide gel electrophoresis and mass spectrometry. Proteomics. 2004;4:4019–4031. doi: 10.1002/pmic.200400876. [DOI] [PubMed] [Google Scholar]
- 45.Pisitkun T, Shen RF, Knepper MA. Identification and proteomic profiling of exosomes in human urine. Proc Natl Acad Sci U S A. 2004;101:13368–13373. doi: 10.1073/pnas.0403453101. [DOI] [PMC free article] [PubMed] [Google Scholar]
- 46.Taylor RS, Wu CC, Hays LG, Eng JK, Yates JR, 3rd, Howell KE. Proteomics of rat liver Golgi complex: minor proteins are identified through sequential fractionation. Electrophoresis. 2000;21:3441–3459. doi: 10.1002/1522-2683(20001001)21:16<3441::AID-ELPS3441>3.0.CO;2-G. [DOI] [PubMed] [Google Scholar]
- 47.Bell AW, Ward MA, Blackstock WP, Freeman HN, Choudhary JS, Lewis AP, Chotai D, Fazel A, Gushue JN, Paiement J, et al. Proteomics characterization of abundant Golgi membrane proteins. J Biol Chem. 2001;276:5152–5165. doi: 10.1074/jbc.M006143200. [DOI] [PubMed] [Google Scholar]
- 48.Wu CC, Yates JR, 3rd, Neville MC, Howell KE. Proteomic analysis of two functional states of the Golgi complex in mammary epithelial cells. Traffic. 2000;1:769–782. doi: 10.1034/j.1600-0854.2000.011004.x. [DOI] [PubMed] [Google Scholar]
- 49.Li N, Shaw AR, Zhang N, Mak A, Li L. Lipid raft proteomics: analysis of in-solution digest of sodium dodecyl sulfate-solubilized lipid raft proteins by liquid chromatography-matrix-assisted laser desorption/ionization tandem mass spectrometry. Proteomics. 2004;4:3156–3166. doi: 10.1002/pmic.200400832. [DOI] [PubMed] [Google Scholar]
- 50.Bini L, Pacini S, Liberatori S, Valensin S, Pellegrini M, Raggiaschi R, Pallini V, Baldari CT. Extensive temporally regulated reorganization of the lipid raft proteome following T-cell antigen receptor triggering. Biochem J. 2003;369:301–309. doi: 10.1042/BJ20020503. [DOI] [PMC free article] [PubMed] [Google Scholar]
- 51.Taylor SW, Fahy E, Zhang B, Glenn GM, Warnock DE, Wiley S, Murphy AN, Gaucher SP, Capaldi RA, Gibson BW, et al. Characterization of the human heart mitochondrial proteome. Nat Biotechnol. 2003;21:281–286. doi: 10.1038/nbt793. [DOI] [PubMed] [Google Scholar]
- 52.Rezaul K, Wu L, Mayya V, Hwang SI, Han D. A systematic characterization of mitochondrial proteome from human T leukemia cells. Mol Cell Proteomics. 2005;4:169–181. doi: 10.1074/mcp.M400115-MCP200. [DOI] [PMC free article] [PubMed] [Google Scholar]
- 53.Cronshaw JM, Krutchinsky AN, Zhang W, Chait BT, Matunis MJ. Proteomic analysis of the mammalian nuclear pore complex. J Cell Biol. 2002;158:915–927. doi: 10.1083/jcb.200206106. [DOI] [PMC free article] [PubMed] [Google Scholar]
- 54.Rout MP, Aitchison JD, Suprapto A, Hjertaas K, Zhao Y, Chait BT. The yeast nuclear pore complex: composition, architecture, and transport mechanism. J Cell Biol. 2000;148:635–651. doi: 10.1083/jcb.148.4.635. [DOI] [PMC free article] [PubMed] [Google Scholar]
- 55.Andersen JS, Lyon CE, Fox AH, Leung AK, Lam YW, Steen H, Mann M, Lamond AI. Directed proteomic analysis of the human nucleolus. Curr Biol. 2002;12:1–11. doi: 10.1016/s0960-9822(01)00650-9. [DOI] [PubMed] [Google Scholar]
- 56.Oh P, Li Y, Yu J, Durr E, Krasinska KM, Carver LA, Testa JE, Schnitzer JE. Subtractive proteomic mapping of the endothelial surface in lung and solid tumours for tissue-specific therapy. Nature. 2004;429:629–635. doi: 10.1038/nature02580. [DOI] [PubMed] [Google Scholar]
- 57.Nielsen PA, Olsen JV, Podtelejnikov AV, Andersen JR, Mann M, Wisniewski JR. Proteomic mapping of brain plasma membrane proteins. Mol Cell Proteomics. 2005;4:402–408. doi: 10.1074/mcp.T500002-MCP200. [DOI] [PubMed] [Google Scholar]
- 58.Sauer G, Korner R, Hanisch A, Ries A, Nigg EA, Sillje HH. Proteome analysis of the human mitotic spindle. Mol Cell Proteomics. 2005;4:35–43. doi: 10.1074/mcp.M400158-MCP200. [DOI] [PubMed] [Google Scholar]
- 59.Takamori S, Holt M, Stenius K, Lemke EA, Gronborg M, Riedel D, Urlaub H, Schenck S, Brugger B, Ringler P, et al. Molecular anatomy of a trafficking organelle. Cell. 2006;127:831–846. doi: 10.1016/j.cell.2006.10.030. [DOI] [PubMed] [Google Scholar]
- 60.Walikonis RS, Jensen ON, Mann M, Provance DW, Jr, Mercer JA, Kennedy MB. Identification of proteins in the postsynaptic density fraction by mass spectrometry. J Neurosci. 2000;20:4069–4080. doi: 10.1523/JNEUROSCI.20-11-04069.2000. [DOI] [PMC free article] [PubMed] [Google Scholar]
- 61.Dosemeci A, Makusky AJ, Jankowska-Stephens E, Yang X, Slotta DJ, Markey SP. Composition of the Synaptic PSD-95 Complex. Mol Cell Proteomics. 2007;6:1749–1760. doi: 10.1074/mcp.M700040-MCP200. [DOI] [PMC free article] [PubMed] [Google Scholar]
- 62.Neubauer G, King A, Rappsilber J, Calvio C, Watson M, Ajuh P, Sleeman J, Lamond A, Mann M. Mass spectrometry and EST-database searching allows characterization of the multi-protein spliceosome complex. Nat Genet. 1998;20:46–50. doi: 10.1038/1700. [DOI] [PubMed] [Google Scholar]
- 63.Buhr N, Carapito C, Schaeffer C, Kieffer E, Van Dorsselaer A, Viville S. Nuclear proteome analysis of undifferentiated mouse embryonic stem and germ cells. Electrophoresis. 2008;29:2381–2390. doi: 10.1002/elps.200700738. [DOI] [PubMed] [Google Scholar]
- 64.Wiederhold E, Gandhi T, Permentier HP, Breitling R, Poolman B, Slotboom DJ. The yeast vacuolar membrane proteome. Mol Cell Proteomics. 2008 doi: 10.1074/mcp.M800372-MCP200. E pub ahead of print. [DOI] [PubMed] [Google Scholar]
- 65.Van den Oever MC, Goriounova NA, Li KW, Van der Schors RC, Binnekade R, Schoffelmeer ANM, Mansvelder HD, Smit AB, Spijker S, De Vries TJ. Prefrontal cortex AMPA receptor plasticity is crucial for cue-induced relapse to heroin-seeking. Nat Neurosci. 2008;11:1053–1058. doi: 10.1038/nn.2165. [DOI] [PubMed] [Google Scholar]