

Abstract
Purpose
Micrometastatic cells detected in the bone marrow have prognostic significance in breast cancer. These cells are heterogeneous and likely do not exhibit uniform biological behavior. To understand the molecular diversity of disseminated cancer cells that reside in bone marrow, we enriched this cell population and did global gene expression profiling in the context of a prospective clinical trial involving women with clinical stage II/III breast cancer undergoing neoadjuvant chemotherapy.
Experimental Design
Enrichment of TACSTD1 (EpCAM)-expressing cells from bone marrow of breast cancer patients was achieved using immunomagnetic beads. Gene expression profiles were compared between enriched cell populations and whole bone marrow from 5 normal volunteers and 23 breast cancer patients after neoadjuvant chemotherapy treatment. Enriched cells from bone marrow samples of breast cancer patients before treatment or at 1 year follow-up were also analyzed (total of 87 data sets). The expression of transcripts specifically detected in enriched cell populations from breast cancer patients was correlated with 1-year clinical outcome using quantitative reverse transcription-PCR in an independent cohort of bone marrow samples.
Results
Analysis of EpCAM-enriched bone marrow cells revealed specific expression of a sub-group of transcripts, including the metastasis regulator, TWIST1. Most transcripts identified, including TWIST1, were not expressed in enriched populations of bone marrow from normal volunteers, suggesting that this expression profile reflects a signature of breast cancer bone marrow micrometastases that persist after chemotherapy. In an independent set of bone marrow samples obtained before any treatment, TWIST1 expression correlated with early disease relapse.
Conclusions
Disseminated breast cancer cells present in bone marrow after chemotherapy possess unique transcriptional signatures. Genes whose expression is overrepresented in these cell populations, such as TWIST1, may prove to be excellent markers of early distant relapse in breast cancer patients.
Metastasis is the leading cause of mortality in breast cancer patients. It is generally agreed that only a small and unique subset of cells within a primary tumor possess metastatic potential. Therefore, therapies that simply reduce primary tumor mass by removing proliferating cells often fail to cure patients (1). Furthermore, molecular profiles of primary, heterogeneous tumors may show limited resemblance to those of tumor cells that eventually progress to metastases (2). To understand the metastatic process and develop new therapeutic strategies to control recurrent disease, molecular characterization of metastatic tumor cells is essential.
Several clinical studies have shown that disseminated tumor cells (DTC) in the bone marrow of breast cancer patients are an independent predictor of metastatic disease development and overall poor prognosis (3). The proposed biological basis for this clinical observation is that bone marrow serves as an important reservoir that allows DTCs to adapt and disseminate to other organs (4). DTCs can persist for years and remain a predictor for disease recurrence (5). However, over 60% of patients with detectable DTCs at diagnosis remain relapse-free after a median follow-up of 6 years (6), indicating that not all DTCs have the potential to form metastatic disease. Those patients with detectable DTCs in their bone marrow after chemotherapy have a particularly poor prognosis, indicating that chemotherapy does not eliminate all DTCs and that those subpopulations of DTCs that survive cytotoxic chemotherapy have a high metastatic potential (7). The heterogeneity of DTCs has been confirmed by differential gene and protein expression studies (8), and this heterogeneity is reduced after adjuvant treatment (9).
DTCs are rare; thus, some efficient enrichment scheme is necessary to characterize these cells at the molecular level. Many enrichment schemes rely on positive immunomagnetic cell separation with antibodies to the TACSTD1 antigen (EpCAM), because of its frequent and relatively specific expression on epithelial cells (10, 11). Approximately 68% (range 48-100%) of cytokeratin-positive bone marrow DTCs are EpCAM positive (12). Furthermore, EpCAM overexpression in breast cancers is frequently associated with poor prognosis and metastatic disease development (13). To date, EpCAM seems to be the single best target for immunoselection of micrometastatic cells (11).
In the present study, we hypothesized that gene expression profiling of DTCs isolated from bone marrow of breast cancer patients after treatment with chemotherapy would enrich for chemotherapy persistent DTCs with high metastatic potential and identify novel, biologically relevant gene transcripts associated with early tumor relapse. We have analyzed bone marrow from 23 patients with clinical stage II/III breast cancer who received four cycles of neoadjuvant epirubicin/Taxotere chemotherapy. A set of expressed transcripts in enriched DTC populations, but not present in similarly processed bone marrow from normal volunteers, was identified. Expression of a subset of these transcripts was then correlated with either the presence or absence of disease recurrence within 1 year in an independent set of identically treated patients. One of the transcripts, TWIST1, is a known marker of tumor metastases, suggesting that this approach will yield other potentially useful markers that predict the development of metastatic disease in breast cancer patients.
Materials and Methods
Study population
One hundred and twenty patients diagnosed with clinical stage II or III breast cancer were prospectively enrolled into a neoadjuvant chemotherapy trial from 2003 through 2006. The protocol was approved by the institutional review board of Washington University and all patients signed written informed consent. Bone marrow aspirates were collected before the initiation of treatment, after completion of four cycles of epirubicin/Taxotere, and 1 year after diagnosis. Half of the patients received zoledronic acid every 3 weeks. All patients were treated at the Siteman Cancer Center at Washington University and follow-up data were obtained prospectively. The mean follow-up time was 2 years. All molecular analyses were conducted blind of the patients' clinicopathologic status. Bone marrow samples were collected from five healthy volunteers after informed consent in an institutional review board-approved protocol. The clinical trial study design and the origin of bone marrow samples that were used for initial microarray discovery sets and subsequent quantitative reverse transcription-PCR (qRT-PCR) validation studies are presented in Fig. 1.
Fig. 1.
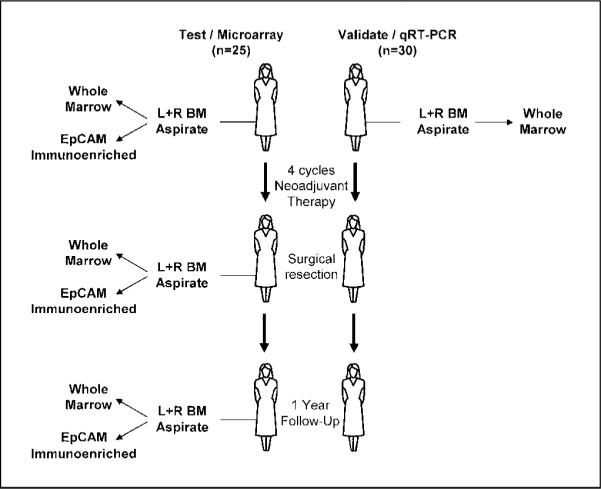
Study design and specimen selection for microarray and qRT-PCR validation analyses. From a total of 120 patients enrolled on a neoadjuvant trial of epirubicin/Taxotere, 79 samples obtained from 25 patients before and after neoadjuvant therapy were used for microarray analysis (left). These samples included both unfractionated bone marrow as well as matched bone marrow samples subjected to immunoselection of EpCAM or six other cell surface antigens. For specimens enriched by EpCAM immunoselection, 10 of the specimens were from patients before any treatment, 23 were from patients after four cycles of chemotherapy, 9 were from patients 1y to 16 mo after diagnosis, and 2 were from normal volunteers. Bilateral bone marrow samples were analyzed in 12 patients. In six cases, expression profiles of bone marrow samples were compared over time, both before and after neoadjuvant therapy. Four bone marrow samples from two patients also underwent a second enrichment after EpCAM selection with one of six antibodies. Finally, 17 EpCAM-selected bone marrow were processed for microarray analysis, but either yielded no biotinylated target (n = 7) or resulted in very low probe set calls on the array (n = 10), suggesting that no cells were captured from the sample. An independent group of 50 samples, obtained from 30 patients on the same trial, before any therapy, were chosen for biomarker validation (right).
Bone marrow aspiration and DTC enrichment
Twenty milliliters of bone marrow were collected from the right and left anterior iliac crests of breast cancer patients and subjected to hypotonic RBC lysis. For whole bone marrow samples, 5 × 10⁶ nucleated cells were pelleted and snap frozen for subsequent RNA isolation. For immunoenrichment, ~5 × 10⁷ nucleated cells were incubated with EpCAM immunomagnetic beads (DAKO) for 1 h at 4°C with shaking. The magnetic isolation was repeated five times to optimize capture of cells. Immunomagnetic beads were subsequently washed with cold PBS/1% FCS, as previously reported (11). For some experiments, the remaining effluent was incubated with one of six biotinylated antibodies (CXCR4, osteopontin, SCA-1, CD44, ABCG-2, EMMPRIN), which had been coupled to avidin magnetic beads. The immunomagnetic beads were isolated using a magnetic particle concentrator (Dynal MPC). Captured cells were then snap-frozen for RNA isolation. For cytokeratin staining and qRT-PCR experiments, whole bone marrow was enriched for mononucleated cells using a standard Ficoll-Hypaque gradient technique.
RNA isolation and gene expression profiling
Microarray expression profile analysis was initially done on 79 bone marrow samples from 25 patients enrolled on the trial. The characteristics of these patients are summarized in Supplementary Table S1. Total RNA was isolated from whole bone marrow or immunoselected bone marrow cells using TRIzol reagent (Invitrogen). For immunoselected cell samples, the method was scaled down by a factor of 10, and yeast tRNA was added to the cell lysate as a coprecipitant. RNA from total bone marrow samples, processed in parallel with immunoselected samples, was quantified and qualitatively assessed using an Agilent Bioanalyzer and RNA NanoChip assay. Because RNA yields from immunoselected cells were expectedly low, these RNAs were not qualitatively assessed.
Total bone marrow RNA was diluted to 50 ng/μL, and 1 μL was used for two-cycle biotinylated cRNA target synthesis (Affymetrix). The entire RNA yield from immunoselected cell populations was concentrated to 3 μL and similarly used. Biotinylated cRNA targets were synthesized using the Affymetrix two-cycle target preparation protocol and reagents as supplied by the manufacturer (Affymetrix). Resulting biotinylated cRNA was quantified and samples that yielded >15 μg of cRNA were used for GeneChip microarray hybridization. In 17 cases, RNAs from immunoselected cell populations failed to produce labeled cRNA target, presumably due to the absence of immunocaptured cells and corresponding RNA in the sample.
Fragmented, biotinylated cRNAs were hybridized to Affymetrix Human Focus gene expression microarrays following standard protocols. Arrays were hybridized, washed, and scanned following the manufacturer's protocol. Array images were processed using the Affymetrix Microarray Analysis Suite (MAS5) statistical algorithm. All arrays were scaled to a target intensity of 1,500 and data was exported to the Siteman Cancer Center Bioinformatics Core Facility6 for probe set annotation and further analysis. The complete microarray data set can be found at the aforementioned URL.
Quantitative RT-PCR
Two micrograms of each whole bone marrow RNA were converted to first-strand cDNA using Omniscript reverse transcriptase (Qiagen) and random hexamers. Resulting cDNA was diluted to an equivalent of 5 ng/μL of input RNA. Primer/probe sets for indicated transcripts were purchased from Applied Biosystems. Each reaction consisted of 10 μL of cDNA, TaqMan Master Mix (Applied Biosystems), and primer/probe set in a total volume of 50 μL, following the manufacturer's standard protocol. For each transcript/sample, duplicate or triplicate reactions were done in an ABI 7500 FAST Sequence Detection System. Resulting cycle threshold data was exported for further analysis.
Immunohistochemistry
Cytokeratin-positive cells in the bone marrow were independently identified by immunohistochemistry analysis of 2 million mononucleated bone marrow cells stained with the anticytokeratin antibody mixture AE1/AE3 (DAKO).
Data analysis and statistics
Annotated microarray data output was analyzed using a number of approaches as described in Results. Probe sets that were scored as not detectable (“A”) by the Affymetrix algorithm in all samples, as well as control probe sets were removed before further analysis. Data filtering, visualization, and ANOVA analysis was done using DecisionSite for Functional Genomics software (Spotfire). Class distinction analyses were done using the Significance Analysis of Microarray algorithm, version 2.21 (14). For hierarchical clustering, normalized microarray signal data was first transformed to a mean of 0 and SD of 1 (Z-score calculation).
For qRT-PCR data, duplicate or triplicate reactions with a cycle threshold (CT) value difference of >1.5 were excluded from further analysis. Each run with a specific primer/probe set was normalized to CT values using a glyceraldehyde-3-phosphate dehydrogenase primer/probe set on the same cDNA sample. This value was in turn normalized across the entire sample set by using the average ΔCT from three bone marrow samples from healthy volunteers, using the ΔΔCT method (15). Data for transcript expression levels were then expressed as fold difference relative to the average of normal bone marrow. In samples where a specific transcript was not detected (CT > 40), the fold difference in expression was defined as 1.0 (equal to that of the normal bone marrow average).
To correlate expression of the genes with clinical variables, a Fisher's exact test was done. For these analyses, patient specimens were considered to express the gene of interest if expression levels in bone marrow were at least 2 SDs above the mean expression of three bone marrow samples from volunteers. Patients were considered “positive” for biomarker gene expression or cytokeratin-positive cells when detected in at least one of the two bone marrow samples analyzed (left or right side). Logistic regression was used to estimate the odds of 1 year recurrence in patients who were positive relative to those who were negative for each of the markers analyzed.
Results
Sample selection and characteristics
We initially sought to identify patterns of gene expression that correlated with the persistence of bone marrow DTCs in breast cancer patients after chemotherapy. The clinical trial study design and the origin of bone marrow samples that were used for initial microarray discovery sets and subsequent qRT-PCR validation studies are presented in Fig. 1. Bone marrow aspirates were collected from patients with clinical stage II/III breast cancer before treatment, after four cycles of chemotherapy, and 1 year after diagnosis. For most cases, bone marrow was collected from both the right and left iliac crests. Expression profile analysis was completed on 79 bone marrow samples from 25 patients enrolled on this trial of neoadjuvant epirubicin/Taxotere who were randomized to zolendronic acid (Zometa). Thirteen (52%) of the tumors were estrogen receptor positive/progesterone receptor positive/Her2/neu negative; six (24%) of the tumors did not express any of the tumor biomarkers (triple negative); and four (16%) of the tumors overexpressed Her-2/neu. Additional characteristics of the study cohort are summarized in Supplementary Table S1. For the specimens enriched by EpCAM immunoselection, 10 of the specimens were from patients before any treatment, 23 were from patients after four cycles of chemotherapy, 9 were from patients 12 to 16 months after diagnosis, and 2 were from normal volunteers. Bilateral bone marrow samples were analyzed in 12 patients. In six cases, we were able to compare the expression profiles of bone marrow samples both before and after neoadjuvant chemotherapy. Seventeen EpCAM-selected bone marrow samples were processed for microarray analysis but yielded no biotinylated product (n = 7) or resulted in very low probe set calls on the array (n = 10), suggesting that no cells were captured from the sample.
Effective immunoenrichment of DTCs using the EpCAM antigen
We used previously documented methods to enrich for putative tumor cells from bone marrow cell populations using the TACSTD1 antigen, EpCAM (11). The estimated amount of contamination using this technique is in the range of 0.74% to 74% (11). As a pilot study in our laboratory showed, this methodology can selectively isolate breast tumor cells spiked into normal bone marrow with >80% recovery (data not shown). To confirm that EpCAM immunoselection enriched for DTCs in vivo, we examined a number of marker genes reported to be expressed by DTCs (16). Expression of TACSTD1 (EpCAM) itself was enriched over 5-fold compared with corresponding whole bone marrow in many, but not all immunoselected samples (Fig. 2). Keratin 19 and mammoglobin (SCGB2A2; ref. 17) were also enriched in some immunoselected cell samples (i.e., patient 3422) by as much as 100-fold. The enrichment for EpCAM expression was not a profound as expected, but this result is likely due to a background level of transcript expression in total bone marrow.
Fig. 2.

EpCAM selection enriches for tumor cell marker expression. Expression of tumor cell - associated transcripts EpCAM (TACSTD1), cytokeratin 19 (KRT19), and mammaglobin (SCGB2A2) are displayed as microarray signal values on the X axis of each graph. Dots, expression of each transcript in bone marrow cell samples selected with no antibody, EpCAM, or one of six other antibodies to tumor cell surface antigens. ○, immunoselected samples with overrepresentation of each transcript relative to unselected cells, referenced by the patient study number found in Supplementary Table S1.
EpCAM antigen may not be expressed on all DTCs and, in fact, may be absent on clinically relevant DTC subpopulations that continue to express other markers such as cytokeratin (9). Therefore, we examined whether similar immunoselection using other cell surface markers effectively captured different DTC subpopulations. In four bone marrow samples collected from two patients, cells not captured using EpCAM immunomagnetic beads were subsequently incubated with antibodies to the ABCG2, CD44, CXCR4, BSG (EMMPRIN), SPP1 (osteopontin), and CASP3 (Sca-1) antigens. Each of these genes has been reported to be a marker associated with DTCs, breast cancer stem cells, or breast tumor metastasis (18-22). As shown in Fig. 2, none of these subsequent enrichment schemes further selected for cytokeratin-expressing cell populations. Furthermore, as shown in Fig. 3, the molecular profiles of cells selected with each different antibody were generally indistinguishable from each other and whole bone marrow, and quite unlike those from many of the EpCAM-selected samples. Based on these data, we concluded that a second immunoselection using target antigens that have been associated with breast cancer did not identify populations of cells displaying unique signatures. This result may be related to the two patient specimens used for analysis.
Fig. 3.

Gene expression profiling reveals distinct classes of EpCAM-selected bone marrow cells in breast cancer patients. The Z-score normalized expression of ~7,000 transcripts was used to perform unsupervised, hierarchical clustering of all 87 samples subjected to gene expression microarray analysis. Each row represents a single sample, whereas each vertical line represents an individual probe set. Relative expression of each probe set in each sample is indicated from low (blue) to high (red). Chip #, unique array identifier. Patient, unique patient study number. Side, collection side (left or right anterior iliac crest) of bone marrow used for analysis. In some cases, side was not indicated at time of collection. Status, time point of bone marrow collection before neoadjuvant therapy (Pre), after completion of four cycles of therapy and at the time of definitive surgical resection (Post), or at 1y (1Year) or 16 mo (16 mo.) follow-up. Samples from normal volunteers are indicated in red (NL). Cells, number of cytokeratin-positive cells detected by immunocytochemistry of the same bone marrow specimen (ND, no data available). AB, antibody used for immunoselection of cells [ep, EpCAM (TACSTD1); op, osteopontin (SPP1); cx, CXCR4; 44, CD44; sc, sca-1 (CASP3); em, EMMPRIN (BSG); ab, ABCG2]. EpCAM-selected samples are highlighted in red. No notation indicates an unselected marrow sample. Clusters of samples showing similar expression profiles are indicated (A-G) and yellow boxes indicate transcripts overrepresented in select subsets of EpCAM-selected samples, as detailed in the text.
Breast cancer patient bone marrow shows distinct gene expression profiles
Unsupervised cluster analysis of all samples used in this study, based on the expression of ~7,000 gene transcripts, is shown in Fig. 3. From this analysis, several distinct classes of gene transcription are apparent. In particular, two subsets of EpCAM-selected bone marrow samples from predominantly posttherapy patients (“D” and “E”) form a distinct expression cluster from unselected marrow, normal marrow, and EpCAM-selected marrow from primarily pretherapy patients (“F” and “G”). We propose that those samples in groups D and E represent bone marrow containing DTCs that persist after chemotherapy, and display a discernibly unique and functionally relevant molecular profile. In fact, a number of notable transcripts overrepresented in patient cluster D include those associated with tumor invasion and metastasis (SPARCL1, MMP2, TNC, FMOD, TIMP4, and TWIST1), epithelial cells and breast cancer (EMP1, EMP2, AMPH, ESR1, and BCAR3), and growth factors associated with breast cancer progression (MDK and VEGFC). In contrast, transcripts overrepresented in cluster E include a preponderance of ribosomal proteins and translational initiation factors, cell cycle, and DNA repair genes (PCNA, CCNB2, CDC2, MYC, CHEK1, XRCC1, BCCIP, BRCA1, and RAD51), and breast cancer biomarkers (BCAS2, MUC1, and TACSTD1).
TWIST1 gene expression is part of a DTC signature
To maximize the possibility of identifying unique genes associated with DTCs that persist through chemotherapy, we directly compared 12 matched pairs of whole bone marrow and EpCAM-enriched samples from patients who had completed four cycles of chemotherapy. To determine whether the enriched cell expression profile was unique to EpCAM selection or an inconsequential result of cell processing, we also compared these expression profiles to those of cell populations selected with the six other antibodies described above. Finally, as a negative control, we compared these expression profiles to EpCAM-selected cells from bone marrow obtained from healthy volunteers.
Using the Significance Analysis of Microarrays algorithm (14), we identified 627 probe sets whose expression was significantly different between the 12 paired EpCAM-selected and unselected samples, with a predicted false discovery rate of 5%. Although the expression of these genes is significantly different between selected and unselected samples, we are unable to determine whether they are highly expressed in a few cells or present in the majority of DTC. As listed in Supplementary Table S2, 67 unique transcripts were overrepresented in EpCAM-selected samples at a level equal to or greater than that of the EpCAM antigen (TACSTD1) itself. Furthermore, 25 of these transcripts were undetectable in both EpCAM-selected and unselected bone marrow from healthy volunteers. We used the 67 transcript set to cluster 40 remaining samples that were not used for the initial analysis. As shown in Fig. 4, this gene signature does not simply distinguish EpCAM-selected cells from total bone marrow, but rather segregates patients into two distinct classes. Six patients showed enhanced expression of the DTC signature in their posttherapy bone marrow samples, whereas samples from remaining patients (both pretherapy and posttherapy) and healthy volunteers were relatively devoid of the DTC signature. Interestingly, enhanced expression of the DTC signature is not observed in the corresponding pretreatment specimens of four of the patients (2153, 1092, 6268, 5385). Currently, there is insufficient follow-up information regarding this set of patients and whether these patients with the DTC signature will have a shorter disease-free survival.
Fig. 4.

Clustering of an independent set of study samples based on a DTC signature. The Z-score normalized expression of 67 transcripts defined as the “DTC signature” (see Supplementary Table S2) was used to perform hierarchical clustering of 40 unselected or EpCAM-selected bone marrow samples omitted in the original creation of the signature gene list. Data representation and column annotations are as described in Fig. 3.
Although the biological significance of most individual transcripts identified in the DTC signature is not immediately obvious, one gene in this set, TWIST1, has been associated with breast cancer metastasis and accompanying epithelial to mesenchymal transition (23). For this reason, we chose to investigate the significance of TWIST1 expression in bone marrow of breast cancer patients.
TWIST1 expression in DTCs is associated with early relapse
The most clinically useful biomarker would be one that would indicate the potential of DTCs present in whole, unfractionated bone marrow to form distant metastasis at a time before any treatment intervention. To address this concept, an additional set of 50 bone marrow specimens obtained before any treatment intervention from 30 patients (Fig. 1) were assayed for expression of several DTC signature genes using qRT-PCR. In this validation set, 15 patients progressed or developed metastatic disease within 1 year and the remaining 15 patients had no evidence of disease at 1 year. Specimens from the two groups were matched for expression of estrogen receptor, progesterone receptor, and Her-2/neu expression. All patients in the validation set were subsequently treated with identical chemotherapy regimens. There was no statistically significant relationship between progression or early metastatic disease development and other tumor markers (estrogen receptor, progesterone receptor, Her-2), grade of tumor, or response of the primary tumor to neoadjuvant chemotherapy (data not shown). Importantly, progression at 1 year was also unrelated to the presence of cytokeratin-positive cells in bone marrow, as assessed by traditional immunocytochemistry (Fig. 5).
Fig. 5.

Correlation of DTC signature genes with early metastasis or progression in breast cancer patients. Fifty bone marrow samples from 30 women, obtained before any neoadjuvant chemotherapy, were assessed for the expression of cytokeratin 19 (KRT19), TWIST1, SNAI2, FZD7, GPR161, PIR, and mammaglobin (SCGB2A2) by quantitative RT-PCR. These same samples were also assessed by cytokeratin immunocytochemistry. Fold overexpression of each transcript relative to its average expression in normal volunteer bone marrow is indicated on the Y-axis. Individual bone marrow samples are arranged on the X-axis. Those samples whose expression is above 2 SDs from the mean expression in normal marrow (filled symbols) are referenced by individual patient number. Circles, patients with metastasis or local progression at 1y; triangles, patients with stable disease. The table summarizes the number of patients positive for each biomarker and correlation with clinical status at 1y.
Expression of TWIST1, as well as GPR161 and PIR (Supplementary Table S2), were measured in addition to expression of cytokeratin 19, a marker associated with epithelial cells, and mammaglobin, a marker associated with breast cancer cells (24). GPR161 and PIR were chosen for further analysis because of their expression characteristics. Both had low q-value% scores (an indicator of false discovery), both were not expressed in normal bone marrow, and each was expressed at levels higher than TACSTD1 (5- and 7.7-fold, respectively). Because of recent evidence suggesting coordinate regulation with TWIST1 in breast cancer metastasis and WNT pathway signaling, we also measured expression of SNAI2 and FZD7 transcripts for comparison (25). Overall, there was markedly variable expression of all seven transcripts in the 50 bone marrow samples analyzed. Transcript expression could not be detected above background levels of normal bone marrow for the majority of the specimens. Given the relatively few numbers of DTCs that may be present in unselected bone marrow, this is perhaps not unexpected. Nevertheless, a number of patient specimens did show selective increases of transcript expression. As shown in Fig. 5, both PIR and GPR161 expression were detected in patient specimens, but neither was correlated with local progression or metastasis at 1 year. Similarly, cytokeratin 19 and mammaglobin were expressed, but not correlated with early clinical progression. Interestingly, expression of cytokeratin 19 transcript was also not correlated with cytokeratin staining from the same bone marrow specimen, a finding that has been previously reported by others (24, 26). In contrast, 7 of 15 patients with clinical progression within 1 year of diagnosis versus 0 of 15 patients with no evidence of disease at 1 year, expressed levels of TWIST1 transcript above background. This difference was statistically significant (P < 0.0063). Although SNAI2 and FZD7 transcripts were also detected in patients with clinical progression (5 of 15 and 2 of 15 cases, respectively), unlike TWIST1, expression was also frequently detected in bone marrow from patients who showed no disease at 1 year after initial diagnosis.
Discussion
In this study, we have used an immunomagnetic capture strategy to enrich for EpCAM-expressing cells from the bone marrow of breast cancer patients. Global gene expression profiling of these cells was subsequently used to identify potential transcriptional signatures that are indicative of functionally significant micrometastatic tumor cells and their potential to progress to clinically evident metastatic disease. Among the transcripts identified, expression of the metastasis regulator TWIST1 was frequently observed in the bone marrow of breast cancer patients before any chemotherapy. Expression of TWIST1 correlated with the rapid occurrence of distant metastasis or local progression, within 1 year from initial diagnosis, whereas traditional immunocytochemistry or qRT-PCR analysis of cytokeratin did not.
Several investigators have used a similar approach to molecularly characterize DTCs in patient bone marrow using capture antibodies such as EpCAM (10, 11). However, it is known that DTCs lacking EpCAM expression do exist and, in particular, may be more prominent after chemotherapy exposure (9). Therefore, it is formally not possible to distinguish those cells that have lost EpCAM expression and are not captured, versus those cells that retain EpCAM expression, are captured, but are not detected due to loss of cytokeratin expression. This may explain the lack of correlation between number of cells detected in bone marrow by cytokeratin staining and EpCAM selection. In this study, we attempted to isolate DTCs that may not be captured by EpCAM targeting in a subset of samples by subsequent selection using antibodies directed against six other surface antigens reported to be expressed on metastatic breast tumor cells or breast cancer stem cells. None of the samples analyzed using these antibodies exhibited unique expression profiles, suggesting that we were unable to further select additional DTC subsets based on expression of these antigens.
Identification and molecular characterization of DTCs in bone marrow has been hampered by the extremely low frequency of these cells, even in patients with advanced-stage disease. In this study, even at a prevalence of 10 to 20 DTCs per million nucleated marrow cells, we would predict recovery of only 400 to 800 cells from the analyzed samples. Transcript detection using PCR-based strategies are relatively straightforward with these few cells, although linear transcript amplification and microarray analysis are more problematic (27). In fact, numerous EpCAM-selected samples in this study (included several from normal marrow donors) failed to produce microarray results, suggesting that too few cells were present for analysis in these samples.
EpCAM expression is also not absolutely specific for tumor cells, and is likely expressed on some cellular components of normal bone marrow (28). Therefore, many of the expression signatures identified in this study (including those from EpCAM-selected normal bone marrow) likely originate from non-DTC sources. Nevertheless, many transcripts identified were specific to a subset of EpCAM-selected samples from breast cancer patients and were not detected in normal marrow, suggesting that these markers are specific for DTCs. Interestingly, even if the expression of these signature genes do not directly originate from DTCs themselves, it is possible that the expression signature of other bone marrow elements may be equally informative with regard to the presence and metastatic potential of DTCs that lie within them, due to tumor-environment signaling interactions (29, 30). In the future, it will be interesting to determine how many “DTC signature” transcripts are actually expressed by other bone marrow elements.
Several lines of evidence further suggest that the expression signatures identified in this study truly reflect the presence of DTCs. Woelfle et al. (31) showed that the process of immunoselection itself does not substantially alter cellular expression profiles. This finding was confirmed in our study in that selection of cells with alternate antibodies and of cells from normal marrow does not recapitulate the signature obtained from EpCAM-selected cells from breast cancer patients. In EpCAM-selected cells, several known tumor markers such as cytokeratin 19 (KRT19) and mammaglobin (SCGB2A2) were enriched in many samples, indicating the successful isolation of true DTCs. Finally, in an independent set of samples, the DTC signature did not simply segregate EpCAM-selected versus unselected marrow, but rather defined two distinct classes of patients, presumably those with and without chemotherapy-persistent DTCs.
The identified DTC signature initially consisted of a large number of transcripts whose expression was enriched in EpCAM-selected cells. However, only a small number of these transcripts showed a comparable degree of enrichment to the EpCAM transcript itself, TACSTD, and only a further subset set of these transcripts were undetectable in normal marrow. The biological significance of many of the individual DTC transcripts is uncertain, with one notable exception, TWIST1. The TWIST1 gene is a basic helix-loop-helix transcription factor that directs mesodermal cell fates (32). Expression has been associated with epithelial-mesenchymal transition, a critical component of the metastatic cascade, whereby transformed epithelial cells lose normal cell-cell interaction and adopt a mesenchymal phenotype (25). Expression of TWIST1 has been associated with poor outcome in multiple tumors, including melanomas, breast adenocarcinomas, and gliomas (23, 33, 34). Moreover, increased TWIST1 protein levels are associated with resistance or reduced sensitivity to cytotoxic drugs (35).
For the initial microarray analysis, bone marrow samples obtained after chemotherapy were purposefully chosen to identify gene signatures associated with persistent DTCs that are more likely to have clinical significance with regard to metastasis and overall survival. To determine the predictive strength of gene expression on clinical outcome, treatment-naïve bone marrow samples from an independent subset of patients on the same clinical protocol were chosen for marker validation. Two transcripts from the DTC signature, PIR and GPR161, were not correlated with clinical outcome in this validation set. In addition to the many possible technical explanations for this result, it is possible that chemotherapy exposure selects for DTC subclones or alters DTC expression profiles such that expression of these genes is not relevant in pretreatment samples. Most importantly, however, we were able to confirm that TWIST1 expression even in pretreatment bone marrow did correlate with the occurrence of distant metastases or local progression at 1 year, whereas other traditional measures did not.
In the epithelial-mesenchymal transition regulatory pathway, TWIST1 may play a role similar to Snail genes (32). Members of the Snail family are involved in repression of E-cadherin, cell movement, breast cancer recurrence, and metastases development (36-39). Genes from this family may be involved in the progression of breast adenocarcinoma and, therefore, along with TWIST1, may serve as a marker of metastatic potential. In this study, we found that SNAI2 was expressed in a third of the bone marrow specimens tested. Unlike TWIST1 expression, however, not all SNAI2-positive patients developed metastatic disease or clinical progression within 1 year. Further follow-up of these patients will allow us to better determine the clinical specificity and sensitivity of SNAI2 versus TWIST1 bone marrow expression.
Finally, we observed no correlation between the development of early metastatic disease and the expression of two other transcripts frequently used to detect DTCs in blood, bone marrow, and lymph nodes—cytokeratin 19 and mammaglobin (24). Unlike these two markers, we propose that TWIST1 may provide a more accurate functional indicator of DTC with high metastatic potential. In this sense, TWIST1 and other transcripts identified through the approach outlined in this study may be more robust markers for predicting clinical outcome in certain subpopulations of breast cancer patients compared with any other conventional pathologic or molecular marker currently available.
One limitation of our study is the cohort of patents from whom the specimens were collected. All patients received a uniform chemotherapy regimen and the outcome focused on patients with early recurrent disease. Thus, our findings would benefit by confirmation in a larger cohort of patients undergoing a variety of chemotherapy regimens using multivariate analysis.
Supplementary Material
Acknowledgments
We thank Dr. Daniel Link for assistance in procurement of normal volunteer bone marrow and the staff members of Alvin J. Siteman Cancer Center Tissue Procurement and Multiplexed Gene Analysis Cores for excellent technical assistance.
Grant support: National Cancer Institute grant CA111530-01 and the Barnes Jewish Hospital Foundation (R.L. Aft), the Alvin J. Siteman Cancer Center Support Grant P30 CA91842, and the Clinical Trials Core of the Siteman Cancer Center at Washington University and Barnes-Jewish Hospital in St. Louis, MO. M.A. Watson, T.P. Fleming, and Washington University may receive royalty income from licensing associated with the mammaglobin (SCGB2A2) gene.
Footnotes
Note: Supplementary data for this article are available at Clinical Cancer Research Online (http://clincancerres.aacrjournals.org/).
References
- 1.Yoshida BA, Sokoloff MM, Welch DR, et al. Metastasis-suppressor genes: a review and perspective on an emerging field. J Natl Cancer Inst. 2000;92:17–30. doi: 10.1093/jnci/92.21.1717. [DOI] [PubMed] [Google Scholar]
- 2.Weigelt B, Peterse JL. van't Veer LJ Breast cancer metastasis: markers and models. Nat Rev Cancer. 2005;5:591–602. doi: 10.1038/nrc1670. [DOI] [PubMed] [Google Scholar]
- 3.Braun S, Vogl FD, Naume B, et al. A pooled analysis of bone marrow micrometastasis in breast cancer. N Engl J Med. 2005;353:793–802. doi: 10.1056/NEJMoa050434. [DOI] [PubMed] [Google Scholar]
- 4.Pantel K, Woelfle U. Detection and molecular characterisation of disseminated tumour cells: implications for anti-cancer therapy. Biochim Biophys Acta. 2005;1756:53–64. doi: 10.1016/j.bbcan.2005.07.002. [DOI] [PubMed] [Google Scholar]
- 5.Janni W, Hepp F, Rjosk D, et al. The fate and prognostic value of occult metastatic cells in the bone marrow of patients with breast carcinoma between primary treatment and recurrence. Cancer. 2001;92:46–53. doi: 10.1002/1097-0142(20010701)92:1<46::aid-cncr1290>3.0.co;2-6. [DOI] [PubMed] [Google Scholar]
- 6.Gebauer G, Merkle E, Beck EP, Lang N, Jager W. Epithelial cells in bone marrow of breast cancer patients at time of primary surgery: clinical outcome during long-term follow-up. J Clin Oncol. 2001;19:3669–74. doi: 10.1200/JCO.2001.19.16.3669. [DOI] [PubMed] [Google Scholar]
- 7.Braun S, Kentenich C, Janni W, et al. Lack of effect of adjuvant chemotherapy on the elimination of single dormant tumor cells in bone marrow of high-risk breast cancer patients. J Clin Oncol. 2000;18:80–6. doi: 10.1200/JCO.2000.18.1.80. [DOI] [PubMed] [Google Scholar]
- 8.Klein CA, Blankenstein TJ, Schmidt-Kittler O, et al. Genetic heterogeneity of single disseminated tumour cells in minimal residual cancer. Lancet. 2002;360:683–9. doi: 10.1016/S0140-6736(02)09838-0. [DOI] [PubMed] [Google Scholar]
- 9.Thurm H, Ebel S, Kentenich C, et al. Rare expression of epithelial cell adhesion molecule on residual micrometastatic breast cancer cells after adjuvant chemotherapy. Clin Cancer Res. 2003;9:2598–604. [PubMed] [Google Scholar]
- 10.Woelfle U, Breit E, Zafrakas K, et al. Bi-specific immunomagnetic enrichment of micrometastatic tumour cell clusters from bone marrow of cancer patients. J Immunol Methods. 2005;300:136–45. doi: 10.1016/j.jim.2005.03.006. [DOI] [PubMed] [Google Scholar]
- 11.Choesmel V, Anract P, Hoifodt H, Thiery JP, Blin N. A relevant immunomagnetic assay to detect and characterize epithelial cell adhesion molecule-positive cells in bone marrow from patients with breast carcinoma: immunomagnetic purification of micrometastases. Cancer. 2004;101:693–703. doi: 10.1002/cncr.20391. [DOI] [PubMed] [Google Scholar]
- 12.Braun S, Hepp F, Sommer HL, Pantel K. Tumor-antigen heterogeneity of disseminated breast cancer cells: implications for immunotherapy of minimal residual disease. Int J Cancer. 1999;84:1–5. doi: 10.1002/(sici)1097-0215(19990219)84:1<1::aid-ijc1>3.0.co;2-a. [DOI] [PubMed] [Google Scholar]
- 13.Spizzo G, Went P, Dirnhofer S, et al. High Ep-CAM expression is associated with poor prognosis in node-positive breast cancer. Breast Cancer ResTreat. 2004;86:207–13. doi: 10.1023/B:BREA.0000036787.59816.01. [DOI] [PubMed] [Google Scholar]
- 14.Sharov AA, Dudekula DB, Ko MS. A web-based tool for principal component and significance analysis of microarray data. Bioinformatics. 2005;21:2548–9. doi: 10.1093/bioinformatics/bti343. [DOI] [PubMed] [Google Scholar]
- 15.Livak KJ, Schmittgen TD. Analysis of relative gene expression data using real-time quantitative PCR and the 2(-ΔΔC(T)) method. Methods. 2001;25:402–8. doi: 10.1006/meth.2001.1262. [DOI] [PubMed] [Google Scholar]
- 16.Pantel K, Otte M. Occult micrometastasis: enrichment, identification and characterization of single disseminated tumour cells. Semin Cancer Biol. 2001;11:327–37. doi: 10.1006/scbi.2001.0388. [DOI] [PubMed] [Google Scholar]
- 17.Watson MA, Fleming TP. Mammaglobin, a mammary-specific member of the uteroglobin gene family, is over-expressed in human breast cancer. Cancer Res. 1996;56:860–5. [PubMed] [Google Scholar]
- 18.Klein CA, Seidl S, Petat-Dutter K, et al. Combined transcriptome and genome analysis of single micrometastatic cells. Nat Biotechnol. 2002;20:387–92. doi: 10.1038/nbt0402-387. [DOI] [PubMed] [Google Scholar]
- 19.Kang Y, Siegel PM, Shu W, et al. A multigenic program mediating breast cancer metastasis to bone. Cancer Cell. 2003;3:537–49. doi: 10.1016/s1535-6108(03)00132-6. [DOI] [PubMed] [Google Scholar]
- 20.Al-Hajj M, Wicha MS, Benito-Hernandez A, Morrison SJ, Clarke MF. Prospective identification of tumorigenic breast cancer cells. Proc Natl Acad Sci U S A. 2003;100:3983–8. doi: 10.1073/pnas.0530291100. [DOI] [PMC free article] [PubMed] [Google Scholar]
- 21.Welm BE, Tepera SB, Venezia T, Graubert TA, Rosen JM, Goodell MA. Sca-1(pos) cells in the mouse mammary gland represent an enriched progenitor cell population. Dev Biol. 2002;245:42–56. doi: 10.1006/dbio.2002.0625. [DOI] [PubMed] [Google Scholar]
- 22.Sarkadi B, Ozvegy-Laczka C, Nemet K, Varadi A. ABCG2—a transporter for all seasons. FEBS Lett. 2004;567:116–20. doi: 10.1016/j.febslet.2004.03.123. [DOI] [PubMed] [Google Scholar]
- 23.Yang J, Mani SA, Donaher JL, et al. Twist, a master regulator of morphogenesis, plays an essential role in tumor metastasis. Cell. 2004;117:927–39. doi: 10.1016/j.cell.2004.06.006. [DOI] [PubMed] [Google Scholar]
- 24.Benoy IH, Elst H, Van der Auwera I, et al. Real-time RT-PCR correlates with immunocytochemistry for the detection of disseminated epithelial cells in bone marrow aspirates of patients with breast cancer. Br J Cancer. 2004;91:1813–20. doi: 10.1038/sj.bjc.6602189. [DOI] [PMC free article] [PubMed] [Google Scholar]
- 25.Thiery JP, Sleeman JP. Complex networks orchestrate epithelial-mesenchymal transitions. Nat Rev Mol Cell Biol. 2006;7:131–42. doi: 10.1038/nrm1835. [DOI] [PubMed] [Google Scholar]
- 26.Schoenfeld A, Kruger KH, Gomm J, et al. The detection of micrometastases in the peripheral blood and bone marrow of patients with breast cancer using immunohistochemistry and reverse transcriptase polymerase chain reaction for keratin 19. Eur J Cancer. 1997;33:854–61. doi: 10.1016/s0959-8049(97)00014-2. [DOI] [PubMed] [Google Scholar]
- 27.Nygaard V, Hovig E. Options available for profiling small samples: a review of sample amplification technology when combined with microarray profiling. Nucleic Acids Res. 2006;34:996–1014. doi: 10.1093/nar/gkj499. [DOI] [PMC free article] [PubMed] [Google Scholar]
- 28.Lammers R, Giesert C, Grunebach F, Marxer A, Vogel W, Buhring HJ. Monoclonal antibody 9C4 recognizes epithelial cellular adhesion molecule, a cell surface antigen expressed in early steps of erythropoiesis. Exp Hematol. 2002;30:537–45. doi: 10.1016/s0301-472x(02)00798-1. [DOI] [PubMed] [Google Scholar]
- 29.Roodman GD. Mechanisms of bone metastasis. N Engl J Med. 2004;350:1655–64. doi: 10.1056/NEJMra030831. [DOI] [PubMed] [Google Scholar]
- 30.Phadke PA, Mercer RR, Harms JF, et al. Kinetics of metastatic breast cancer cell trafficking in bone. Clin Cancer Res. 2006;12:1431–40. doi: 10.1158/1078-0432.CCR-05-1806. [DOI] [PMC free article] [PubMed] [Google Scholar]
- 31.Woelfle U, Breit E, Pantel K. Influence of immunomagnetic enrichment on gene expression of tumor cells. J Transl Med. 2005:3–12. doi: 10.1186/1479-5876-3-12. [DOI] [PMC free article] [PubMed] [Google Scholar]
- 32.Castanon I, Baylies MK. A Twist in fate: evolutionary comparison of Twist structure and function. Gene. 2002;287:11–22. doi: 10.1016/s0378-1119(01)00893-9. [DOI] [PubMed] [Google Scholar]
- 33.Elias MC, Tozer KR, Silber JR, et al. TWIST is expressed in human gliomas and promotes invasion. Neoplasia. 2005;7:824–37. doi: 10.1593/neo.04352. [DOI] [PMC free article] [PubMed] [Google Scholar]
- 34.Hoek K, Rimm DL, Williams KR, et al. Expression profiling reveals novel pathways in the transformation of melanocytes to melanomas. Cancer Res. 2004;64:5270–82. doi: 10.1158/0008-5472.CAN-04-0731. [DOI] [PubMed] [Google Scholar]
- 35.Wang X, Ling MT, Guan XY, et al. Identification of a novel function of TWIST, a bHLH protein, in the development of acquired Taxol resistance in human cancer cells. Oncogene. 2004;23:474–82. doi: 10.1038/sj.onc.1207128. [DOI] [PubMed] [Google Scholar]
- 36.Hajra KM, Chen DY, Fearon ER. The SLUG zinc-finger protein represses E-cadherin in breast cancer. Cancer Res. 2002;62:1613–8. [PubMed] [Google Scholar]
- 37.Cano A, Perez-Moreno MA, Rodrigo I, et al. The transcription factor snail controls epithelial-mesenchymal transitions by repressing E-cadherin expression. Nat Cell Biol. 2000;2:76–83. doi: 10.1038/35000025. [DOI] [PubMed] [Google Scholar]
- 38.Barrallo-Gimeno A, Nieto MA. The Snail genes as inducers of cell movement and survival: implications in development and cancer. Development. 2005;132:3151–61. doi: 10.1242/dev.01907. [DOI] [PubMed] [Google Scholar]
- 39.Moody SE, Perez D, Pan TC, et al. The transcriptional repressor Snail promotes mammary tumor recurrence. Cancer Cell. 2005;8:197–209. doi: 10.1016/j.ccr.2005.07.009. [DOI] [PubMed] [Google Scholar]
Associated Data
This section collects any data citations, data availability statements, or supplementary materials included in this article.