

SUMMARY
The postsynaptic density (PSD) is crucial for synaptic functions, but the molecular architecture retaining its structure and components remains elusive. Homer and Shank are among the most abundant scaffolding proteins in the PSD, working synergistically for maturation of dendritic spines. Here, we demonstrate that Homer and Shank, together, form a mesh-like matrix structure. Crystallographic analysis of this region revealed a pair of parallel dimeric coiled-coils intercalated in a tail-to-tail fashion to form a tetramer, giving rise to the unique configuration of a pair of amino-terminal EVH1 domains at each end of the coiled-coil. In neurons, the tetramerization is required for structural integrity of the dendritic spines and recruitment of proteins to synapses. We propose that the Homer-Shank complex serves as a structural framework and as an assembly platform for other PSD proteins.
Keywords: Postsynaptic density, Homer, Shank, crystal structure, coiled-coil, synapse, scaffolding protein
INTRODUCTION
The postsynaptic density (PSD) is an electron-dense structure attached to the cytoplasmic surface of the excitatory postsynaptic membrane in the central nervous system. It is considered to play a major role in the function and structure of the synapse (Okabe, 2007; Sheng and Hoogenraad, 2007). The PSD consists of hundreds of proteins, which are involved in diverse functions such as signal transduction, structural regulation, and metabolism. In contrast to our extensive knowledge of the constituents of the PSD, the molecular architecture that retains the structure of the PSD is not fully understood.
Homer/cupidin/Vesl/PSD-Zip45 and Shank/ProSAP/Spank/CortBP/Synamon/SSTRIP are among the most abundant scaffolding proteins in the PSD. Homer is alternatively spliced into long and short forms (Figure 1A). The long forms contain an EVH1 (Ena/VASP homology 1) domain and a coiled-coil region, which forms a homo-tetramer (Hayashi et al., 2006). In contrast, the short forms are monomers containing only the EVH1 domain. The EVH1 domain binds to various scaffolding and signal transduction molecules, such as type I metabotropic glutamate receptors (mGluR), IP3 receptors (IP3R), Shank, transient receptor potential canonical (TRPC) family channels, and dynamin3 (Shiraishi-Yamaguchi and Furuichi, 2007; Worley et al., 2007). The crystal structure of the Homer EVH1 domain was solved, showing the mechanism of mGluR binding (Beneken et al., 2000). On the other hand, the three dimensional structure of the coiled-coil region, and hence the overall structure of Homer, is unknown.
Figure 1. Formation of a high-order complex between Homer and Shank.

(A) Domain structures of Homer and Shank.
(B) Formation of a high-order complex between Homer1b and Shank1CΔPEST. Homer and Shank were mixed at a concentration of 19 μM each, and centrifuged after overnight incubation at 4 °C. The pellets (p) and the supernatants (s) in the same volume were separated by SDS-PAGE and stained by Coomassie. Shank1CΔPEST (C) is a construct with the PDZ domain, the Homer binding site, and a SAM domain. Shank1DΔPEST (D) is a construct with the PDZ domain and the Homer binding site.
(C) A summary of four repeated experiments similar to (B). Error bars show standard errors.
(D) Hydrodynamic radius distribution measured by dynamic light scattering of Shank, Homer, and a mixture of the two. The “arrow” indicates a high-order complex. Note that because this peak is at the upper limit of measurement, at 3.6 μm, the reading of Mass (%) estimated as globular proteins could be inaccurate.
(E) The stoichiometry of the complex between Homer1b and ShankC1ΔPEST. Increasing concentrations (0–19 μM) of Homer1b were added to a fixed concentration of Shank (9.6 μM).
(F) The summary of the amount of Shank precipitate in three repeated experiments similar to (E).
(G–I) Electron microscopy images of Homer, Shank and Homer-Shank complex. Negative stain images of Homer1b (0.4 μM) (G), Shank1CΔPEST (0.4 μM), (H), and complex formed in the 1:1 molar ratio mixture of Homer1b and Shank1CΔPEST, each at 1 μM (I).
Shank is among the most abundant binding partners of Homer in the PSD (Cheng et al., 2006). It has an amino-terminal ankyrin repeat domain, an SH3 (Src homology 3) domain, a PDZ (PSD-95/Discs large/zona occludens-1) domain, a long proline rich sequence containing binding sites for Homer and cortactin, and a carboxy-terminal SAM (Sterile alpha motif) domain (Figure 1A)(Naisbitt et al., 1999; Tu et al., 1999). Through these domains, Shank interacts with many signaling and scaffolding molecules. Homer and Shank are major determinants of the size of dendritic spines and the PSD. Overexpression of Shank in neurons results in enlargement of dendritic spines, and the effect is significantly enhanced by coexpression of the long form of Homer (Sala et al., 2001).
In this study, we found that Homer and Shank form a high-order polymerized complex with a mesh-like network structure. This complex recruited another postsynaptic protein GKAP/SAPAP/DAP-1, which serves as an interface between Shank and PSD-95. The subsequent X-ray crystallographic analysis of the coiled-coil region revealed a characteristic anti-parallel tetrameric arrangement. This tetrameric structure is critical for forming the high-order complex, which in turn, is necessary for the structural and functional integrity of dendritic spines. We propose that this Homer-Shank complex is the structural framework of the PSD, which serves as a binding platform for other synaptic proteins.
RESULTS
Formation of a high order complex between Homer and Shank
Overexpression of Shank in neurons causes enlargement of dendritic spines, and coexpression of a long Homer, Homer1b, with Shank synergistically enhances the effect (Sala et al., 2001). We were intrigued by how Shank causes the enlargement of dendritic spines with a synergistic effect of Homer. Shank is known to homo-multimerize through interactions between its domains (Baron et al., 2006; Im et al., 2003; Romorini et al., 2004), while Homer1b forms a tetramer (Hayashi et al., 2006). We hypothesized that the tetrameric Homer crosslinks the multimeric Shank, resulting in the formation of a polymerized matrix structure. Such a complex does not have any theoretical limit in size, and reasonably explains the synergistic effect of Homer and Shank on the size of dendritic spines.
To test this hypothesis, we attempted to reconstitute the high-order complex using purified Shank and Homer1b. For stable expression and purification of Shank, we deleted the ankyrin repeats, the SH3 domain, and the proline-rich region predicted to be PEST sequences, while leaving the Homer binding site intact. This deletion construct retains the PDZ domain, the Homer binding site, and the SAM domain, and was named Shank1CΔPEST based on a naturally occurring alternatively spliced form of Shank1 lacking the amino-terminal domains (Lim et al., 1999).
The high-order complex formation was assessed by high-speed centrifugation. When tested individually, neither the purified Shank1CΔPEST nor Homer1b formed precipitate upon ultracentrifugation (Figure 1B, C). In contrast, when they were mixed at a 1:1 molar ratio, approximately 50% of Shank1CΔPEST and Homer1b were precipitated, suggesting the formation of a high molecular weight complex. On dynamic light scattering, a sensitive method for detecting large complex, Homer1b or Shank1CΔPEST alone had a single scattering peak corresponding to the hydrodynamic radii of 10.3 nm and 4.3 nm, respectively (Figure 1D). In contrast, the mixture of Homer1b and Shank1CΔPEST showed two peaks, one at 12.1 nm and the other at 3.6 μm, the upper limit of our instrument (Figure 1D). The latter peak corresponds to the polymerized complex between Homer1b and Shank1CΔPEST. The first peak, slightly larger than Homer1b alone, shows the interaction between Homer1b and Shank1CΔPEST.
Formation of the high-order complex required the specific interaction between Homer1b and Shank. Neither a Homer1b W24A mutant without the EVH1 domain ligand binding activity (Beneken et al., 2000), nor Shank1CΔPEST P1497L mutant with a mutation at the Homer binding site (Lim et al., 1999), formed the precipitate (Figure 1B, C). Shank1CΔPEST without the SAM domain (Shank1DΔPEST) did not form precipitates with Homer1b either, indicating that multimerization of Shank is required for the high-order complex formation. When varying amounts of Homer1b were incubated with a fixed amount of Shank1CΔPEST, the amount of Shank1CΔPEST in the precipitate was maximum when Homer and Shank were at a 1:1 ratio (Figure 1E, F).
The formation of the high-order matrix structure was further confirmed by negative stain electron microscopy. When observed individually, Homer1b appeared as highly flexible fibers, which likely represent the coiled-coil domain (Fig. 1G). Shank1CΔPEST had a globular structure, which likely represents the oligomerized SAM domains and the PDZ domains (Fig. 1H). In contrast, the Homer and Shank mixture showed a mesh-like structure in electron microscopic images (Fig. 1I). The mesh appears to contain hubs, possibly representing Shank oligomerized via its SAM domain and linked by the filamentous Homer.
Interaction between Homer-Shank high-order complex and other synaptic proteins
The mesh-like structure observed under electron microscopy is consistent with its ability to incorporate other PSD proteins. We therefore wanted to know if the Homer-Shank complex can recruit other PSD proteins. GKAP, another abundant PSD protein was chosen for its binding ability to Shank and PSD-95 (Naisbitt et al., 1999; Tu et al., 1999). When purified carboxy-terminal fragment of GKAP (451–666) was incubated with Homer and Shank, the GKAP fragment co-precipitated with the Homer-Shank complex without affecting the amount of Homer or Shank in the precipitates (Figure 2A, B). The amount of GKAP in the precipitates reached the plateau at the molar ratio of ~1.4 versus Homer/Shank.
Figure 2. Interaction between the Homer-Shank complex and other PSD proteins.

(A) Interaction of GKAP with the high-order complex between Homer and Shank. Increasing concentrations (0–26 μM) of GKAP fragment were added to the fixed amount of Homer1b and Shank1CΔPEST (4.3 μM each), then centrifuged.
(B) The summary of three independent experiments similar to (A). The fraction of Homer1b and Shank1CΔPEST in the precipitate, and the amount of GKAP in the precipitate expressed with the intensity of precipitated Homer1b as 100%, were plotted.
(C, D) Dose-dependent inhibition of the high-order complex formation between Homer and Shank by Homer1a. Increasing concentrations (0–190 μM) of Homer1a were added to Homer1b and Shank1CΔPEST (19 μM each) and centrifuged. (D) shows the summary of four repeated experiments.
(E, F) Effect of CaMKIIα phosphorylation on the high-order complex formation between Homer and Shank. CaMKIIαactivated by calcium and calmodulin were added to Homer1b or Homer3a and Shank1CΔPEST (8 μM each), then centrifuged after 30 min incubation at 25°C. (F) shows the summary of three repeated experiments.
We also examined whether the Homer1b and Shank complex formation can be regulated by mechanisms related to synaptic plasticity. First, we observed the effect of Homer1a, an activity induced form of Homer (Figure 1A). We added increasing amounts of Homer1a to a fixed amount of Homer1b-Shank1CΔPEST mixture. Precipitation was decreased to half when Homer1a was added at a ratio of 1:1, and fully prevented at a 5-fold excess of Homer1a to Homer1b (Figure 2C, D). This indicates that a competitive interaction between Homer1a and Homer1b on Shank prevents the complex formation.
Ca2+/calmodulin-dependent protein kinase II (CaMKII) is a key regulator of synaptic plasticity. Three CaMKII phosphorylation sites have been identified in Homer3a (Mizutani et al., 2008). We examined the effect of CaMKII-mediated phosphorylation on the formation of a Homer-Shank high-order complex. By adding the purified CaMKIIαactivated with Ca2+ and calmodulin to the mixture of Homer and Shank (Figure 2E, F), the complex formation between Homer3a and Shank1CΔPEST was inhibited, but not the complex formation between Homer1b and Shank1CΔPEST.
The coiled-coil region of Homer forms a hybrid of dimer and tetramer
The filamentous appearance of Homer, which connects hubs of Shank, suggests the importance of the coiled-coil region of Homer for the Homer-Shank network structure formation. To understand the structural basis of the functional importance of the coiled-coil region, we crystallized the carboxy-terminal 65 residues of Homer1b, which corresponds to one-third of the entire coiled-coil region (Figure 3). The 1.75 Å crystal structure was solved by the multiple-wavelength anomalous dispersion method, using a L308M mutant designed for selenomethionine labeling, and refined to an R/Rfree of 0.216/0.289 (see Table S1 for statistics). Most of the residues of the crystallized fragments were well ordered, and we could assign most of them to the electron density, with the exception of one or two residues from the both termini. The carboxy-terminal 75-residue fragment of Homer3a was also crystallized, and the 2.9 Å structure was solved by the molecular replacement method using the Homer1b structure as a search model, and refined to an R/Rfree of 0.252/0.287. The root mean square deviations of Cαpositions between each strand of the two structures were 0.72–1.09 Å. Due to the high structural similarity between Homer3a and Homer1b, we use Homer1b for analyses and discussions in the remainder of this study.
Figure 3. Crystal structure of the Homer coiled-coil region.

(A) Ribbon representation of the crystal structure of the carboxy-terminal half of Homer1b coiled-coil region CC2. The four strands are marked A–D.
(B) A model of the whole structure of long form of Homer. The model is constructed from the structure of the Homer1CC2 domain (blue), EVH1 domain (red) (Irie et al., 2002), and coiled-coil probability prediction and protease degradation sites (Hayashi et al., 2006). The CC1 and a part of the CC2 domain, whose atomic structures are not known, are in light green and light blue, respectively. Regions likely to be disordered are shown in grey.
(C) Primary sequence of the crystallized fragment. 1B, rat Homer1b; 3A, human Homer3a. Orange, aliphatic residues (I, L, V); blue, acidic (D, E); green, basic (K, R); grey, residues not in crystals. Mutations made in dimeric Homer1b I332R/I337E are shown below. “abcdefg” denotes positions in the heptad of coiled-coil.
(D) Distance between the A and the B strand, or the C and the D strand, are measured and plotted against the number of residues.
(E) Helical wheel representation of the dimeric (top) and tetrameric (bottom) region of Homer1b. Residues start from K290 at g position. Residues which make knobs-into-holes interactions with residues on the other strands are shown in blue. Residues changed in the dimeric mutant (I332 and I337) are shown in red. Residues outside the dotted circles are located within the wide dimeric region.
(F) Example of intermolecular salt bridges formed between residues at the e (E295 and E302) and g (K290 and R297) positions within the dimeric region.
(G) Large amino acids occupying the a and d positions in the wide dimeric region, Q319 and F322.
(H) Inter-chain interactions in the tetrameric region. Residues at d positions (L329, K336, L343, L350) form the A–D and B–C interface, and those at e positions (L330, I337, R344, L351) form the A–C and B–D interface.
(I) Hydrophobic core formed by leucines at a positions (L326, L333, L340, L347).
The structure showed an elongated rod-like structure 140 Å in length (Figure 3A). It consists of two pairs of parallel left-handed dimeric coiled-coils intercalating with each other at the very carboxy-termini, where it forms an anti-parallel tetrameric coiled-coil. The diameter of the coiled-coil at the dimeric region of each end is 15 Å, and the diameter at the tetrameric region at the center is 25 Å.
The overall length of the coiled-coil region is ~180 residues which can be translated to ~45 nm. Upstream of the coiled-coil region, there is a hinge region of ~60 residues, and the amino-terminal globular EVH1 domain. As a whole, Homer has a dumbbell-like tetrameric structure with a pair of EVH1 domains located at each end of the tetramer, separated by a dimer-tetramer hybrid coiled-coil (Figure 3B).
The primary sequence of the amino-terminal portion of the dimeric region (290–312) shows typical heptad repeats with the a and d positions occupied by aliphatic or small polar amino acids (Figure 3C, E). Most of the residues at the a and d positions form canonical knobs-into-holes interactions. The e and g positions are occupied by acidic or basic residues and are involved in the formation of inter-molecular salt bridges (Figure 3E, F). The space between the two helices starts to widen around residue 312 towards the carboxy side, thus allowing accommodation of larger amino acids at a and d positions such as Q319 (a position) and F322 (d position) (Figure 3D, E, G). Knobs-into-holes packing is rarely observed within this region. Eventually, the distance becomes sufficiently wide for the intercalation of another dimer to form a tail-to-tail tetramer in a left-handed antiparallel configuration via the carboxy-terminal 30 residues (Figure 3A, D, E). In the tetrameric region (326–354), the e positions, in addition to the a and d positions, are occupied by hydrophobic residues, typically leucine and isoleucine (Figure 3C, E). Unlike the dimeric region, the knobs-into-holes interactions are observed between the residues at the d (A–D and B–C) and e (A–C and B–D) positions (Figure 3H). The residues at the a positions, all occupied by leucines, do not form knobs-into-holes interactions but fill the cavity at the center of the four α-helices, thereby forming a hydrophobic core (Figure 3I). No fixed water molecules were observed in this cavity.
A dimeric mutant of Homer1b does not form a high-order complex with Shank
To explore the functional significance of the unusual antiparallel tetrameric structure, we attempted to disrupt this structure and dimerize by introducing point mutations based on the crystal structure. In the dimeric coiled-coil region, positively or negatively charged residues at the e and the g positions are common and they form either inter- or intra-chain salt bridges to stabilize the dimer, while these positions are occupied by aliphatic residues in the tetrameric region (Figures 3E, F, H). I337 (e position) of Homer1 forms a knobs-into-holes interaction with the adjacent chain (Figure 4A). We expected that changing I337 and the corresponding residue at the g position, I332, to a pair of positively and negatively charged residues would destabilize the hydrophobic interaction at the core of the tetramer and result in the formation of a stable dimer through electrostatic interactions between the parallel chains. As expected, the I332R/I337E double mutant had a Stokes radius of 6.8 nm, a significant reduction compared to wild type Homer1b and comparable to that of a deletion mutant of the tetrameric region, Homer1bΔ329 (6.5 nm, Figure 4B). To determine the oligomerization status unambiguously, we measured the molecular weight by sedimentation equilibrium experiments (Figure 4C). While the wild type had a molecular weight of 179 kDa, corresponding to 4.2mer, the I332R/I337E mutant was 85 kDa, corresponding to 2.0mer, and the Δ329 deletion mutant was 84 kDa, corresponding to 2.1mer.
Figure 4. Dimeric mutants of Homer.

(A) Structure around the mutated residues. The A chain (green) and B chain (yellow) are shown with I332 and I337 in black. The surface showing the electrostatic potential of the C and D chains is made half transparent to show the I332 and I337 on strand B.
(B) Elution profiles of purified Homer1b, and its mutants, from the Superose 6 gel filtration column. The void volume was 8.2 ml.
(C) Representative scans of sedimentation equilibrium analysis of Homer mutants done at centrifuge speed of 12,000 rpm. This sample was also centrifuged at 9,000 rpm and 15,000 rpm, and globally fitted to the equilibration model. Deviations from the calculated equilibrium are shown at the top. The same color code as in (B) is used.
(D, E) Disruption of the tetramer of wild type Homer1b by dimeric Homer1b-I332R/I337E mutant. HA-Homer1b and myc-Homer1b I332R/I337E were transfected individually or cotransfected in HEK-293T cells. The crude soluble fraction was separated with Superose 6 gel filtration column and the elution profile of each construct was monitored by Western blotting using anti-HA or anti-myc antibody.
(F, G) Loss of Shank crosslinking ability of the dimeric Homer1b I332R/I337E mutant in high-speed centrifugation assay (F) and in dynamic light-scattering assay (G). The graph in (F) shows a summary of four repeated experiments.
(H) Intact interaction between syntaxin 13 fragment and Homer1b wild type or Homer1b I332R/I337E mutant. Crude bacterial lysate expressing Homer1b or Homer1b I332R/I337E was loaded onto Ni-agarose beads with or without hexahistidine-tagged syntaxin 13 fragment, and eluted with imidazole. The eluted sample was separated with SDS-PAGE, and stained by Coomassie.
We tested if wild type Homer1b and Homer1b I332R/I337E interact with each other. We tagged them with HA and myc epitopes, respectively, and coexpressed in HEK293T cells. The proteins were separated on an analytical gel filtration column, and their elution profiles were monitored by Western blotting. Individually expressed HA-Homer1b and myc-Homer1b I332R/I337E were eluted as a single peak at the expected position of tetramer and dimer, respectively. When these two proteins are coexpressed, their elution profiles showed two peaks, both at the tetramer and the dimer molecular weights (Figure 4D, E). This shows that the dimeric mutant interacts with wild type Homer to make heteromeric dimers, although some of the heteromers still form tetramers.
Next, we studied if the tetramerization of Homer is important for Shank cross-linking activity. In both a high-speed centrifuge assay and a dynamic light scattering assay, the dimeric mutant Homer1b I332R/I337E did not show the formation of the high-order complex (Figure 4F, G). A small shift in the hydrodynamic radius by the addition of Shank1CΔPEST (from 6.8 nm to 7.5 nm) shows the interaction between the two proteins. This indicates that the specific spatial arrangement of the four EVH1 domains conferred by the coiled-coil domain is important for the Homer-Shank network formation. In contrast, this mutant does not change its interactions with syntaxin 13, which is known to interact with the coiled-coil region of Homer (Figure 4H) (Minakami et al., 2000).
Tetramerization of Homer1b is required for spine localization of Homer, Shank and PSD-95
Using the Homer1b I332R/I337E mutant, we studied the role of tetramerization of Homer in neurons. We first compared the synaptic localization between the wild type Homer1b and the dimeric mutant. We coexpressed the mGFP-tagged Homer or its mutant with cytosolic red fluorescent protein (DsRed2) to normalize volume, in CA1 pyramidal neurons of organotypically cultured hippocampal slices. Homer1b accumulated in spines with an average spine/dendrite ratio of 3.09 ± 0.04 (mean ± SEM) (Figure 5A, B). In marked contrast, the localization of the dimeric mutant Homer1b I332R/I332E was significantly reduced (1.49 ± 0.02), comparable to monomeric Homer1a (1.50 ± 0.02). These results show that the tetramer formation is critical for synaptic localization of Homer1b.
Figure 5. Effect of the dimeric mutant form of Homer on the localization of synaptic proteins.

(A) Loss of spine localization of the dimeric mutant of Homer. Representative images of CA1 pyramidal neurons in slice culture transfected with mGFP fusion proteins of Homer1a, Homer1b, Homer1b I332R/I337E (green) and DsRed2 (magenta). The fluorescence profiles across the line in the images are shown at the bottom. The peaks in the middle of the plot correspond with the dendritic shaft and those to the left are spine heads. The intensity is adjusted so that the peaks in both channels at the dendritic shaft are 1. Scale bar = 2 μm.
(B) Summary of spine localization of different constructs in a cumulative plot. Numbers of cells/spines analyzed are in parentheses.
(C) Representative images of neurons in hippocampal dissociated culture transfected with myc-Homer1b or myc-Homer1b I332R/I337E and stained with anti-myc and anti-Shank or anti-PSD-95. Scale bar = 10 μm.
(D, E) Summary of Shank and PSD-95 cluster density (D) and mean intensity of Shank and PSD-95 clusters (E) (T-test: * p < 0.05, ** p < 0.01). Data were obtained from 800–2500 dendritic spines from 6–12 transfected cells.
Given the importance of tetramerization of Homer1b for the formation of the high-order complex with Shank in vitro, we studied if Homer tetramerization is required for spine localization of Shank. We transfected dissociated cultures of hippocampal neurons with myc-Homer1b or its dimeric mutant. Transfected neurons were identified by anti-myc antibody staining, and the distribution of endogenous Shank was detected by an anti-Shank antibody. The expression of Homer1b I332R/I337E clearly reduced the number and the intensity of Shank clusters (Figure 5C–E).
To study if the expression of the dimeric mutant also affected the spine localization of other PSD proteins, we immunostained PSD-95, another major PSD protein which binds to receptors. The expression of Homer1b I332R/I337E significantly reduced the number of PSD-95 clusters (Figure 5C–E). These results suggest that the expression of the dimeric mutant of Homer interferes with normal synaptic localization of Shank by preventing the formation of a high-order complex, and also affects the localization of other synaptic proteins, such as PSD-95.
Tetramerization of Homer1b is necessary for maintenance of dendritic spine structure and synaptic function
Next, we investigated whether the tetramerization of Homer1b is required for the integrity of dendritic spine structure. We introduced myc-Homer1b or myc-Homer1b I332R/I337E, along with GFP as a volume-filler, into neurons in hippocampal dissociated culture and measured the morphology and density of spines. Compared with neurons expressing Homer1b, those expressing the dimeric Homer1b I332R/I337E had significantly reduced dendritic spine density (Figure 6A, B). The remaining spines were significantly longer and slightly thinner, typical of immature spines, though the difference in spine width did not reach statistical significance (Figure 6B). The same experiments using hippocampal organotypic slice culture showed a similar effect of myc-Homer1b I332R/I337E (data not shown). We also tested the effect of siRNA against Homer1 on the dendritic spine structure (Figure 6C, D). The siRNA reduced the number of mature spines, which is consistent with the phenotype of Homer1b I332R/I337E overexpression. There were phenotypic differences of the immature spines, that neurons expressing Homer1b I332R/I337E had fewer, longer spines, while those with Homer1 siRNA had increased number of shorter spines. This could be due to the difference in the mechanisms of suppression between these two methods. Importantly, the effect of siRNA was reversed by a rescue construct of Homer1bR with silent mutations at the siRNA target sequence, but not with a similar rescue construct with dimeric mutation (Homer1bR I332R/I337E). In addition, while the coexpression of Homer1b with Shank significantly increased the size of Shank clusters compared with Shank alone as previously reported (Sala et al., 2001), the effect was not observed in the Homer1b I332R/I337E mutant (Figure 6E, F).
Figure 6. Effect of the dimeric mutant form of Homer on dendritic spine structure and synaptic transmission.

(A, B) Morphological analysis of dendritic spines expressing Homer1b or Homer1b I332R/I337E using the cytosolic GFP expression. Representative images of hippocampal cultured neurons transfected with myc-Homer1b or myc-Homer1b I332R/I337E and GFP (A) and summary (B). The neurons were stained with anti-myc antibody. *: p < 0.05 by T-test. Data were obtained from 5310 (WT, 8 cells) and 1596 (I332R/I337E, 9 cells) dendritic spines. Scale bar, 10 μm.
(C, D) Morphological analysis of dendritic spines expressing GFP and pSuper empty, GFP and expression vector for siRNA against Homer1b (pSuper-Homer1b); GFP, pSuper-Homer1b, and wild type Homer1b with mutation that makes it resistant to siRNA (Homer1bR); or GFP, pSuper-Homer1b and Homer1bR with I332R/I337E mutation (Homer1bR I332R/I337E). The neurons were stained with anti-Homer1 antibody. (C) Sample images. (D) Data were obtained from 3433 (pSuper empty, 6 cells), 4560 (siRNA Homer1b, 6 cells), 4989 (siRNA Homer1b with Homer1bR I332R/I337E, 9 cells), and 5633 (siRNA Homer1b with Homer1bR, 9 cells) dendritic spines. Scale bar, 10 μm.
(E, F) Coexpression of Shank with Homer. The neurons were stained with anti-Shank or anti-Homer1 antibodies. (E) Sample images. (F) Data were obtained from 804 (Shank only, 6 cells), 852 (Shank and Homer1b, 6 cells), and 920 (Shank and Homer1b I332R/I337E, 10 cells) dendritic spines. Scale bar, 10 μm.
(G–J) Synaptic response from pairs of untransfected control cells and cells transfected with either Homer1b or Homer1b I332R/I337E. (G) Sample traces. Stimulation artifacts are truncated. (H) For each pair of cells, the amplitude of AMPA-R or NMDA-R EPSCs from transfected cell is plotted against that of control cell. Homer1b, AMPA-R, n=11; NMDAR n=10; AMPA-R/NMDA-R ratio n=10. Homer1b I332R/I337E, n=10 for each measurement. (I) The ratio of amplitude in transfected cells/untransfected cells. (J) The AMPA-R/NMDA-R-EPSC ratio normalized to the untransfected cells.
Finally, to assess the functional significance of Homer tetramerization on synaptic transmission, we analyzed the AMPA-R and NMDA-R mediated excitatory postsynaptic current (EPSC) of neurons transfected with Homer1b or Homer1b I332R/I337E (Figure 6G-J). The expression of Homer1b caused small and insignificant increases of both AMPA-R and NMDA-R-EPSC compared with untransfected neurons (Figure 6H, I). On the other hand, expression of Homer1b I332R/I337E caused significant decreases in the both currents. The effect is likely due to the combined effect of reduced size and number of dendritic spines and reduced amount of synaptic protein at the synapse. The AMPA/NMDA ratio did not change with the expression of the wild type or the mutant Homers, suggesting that the effect of the dimerization equally affected the two receptor populations (Figure 6J). These results indicate that tetramerization of Homer1b is important for structure and function of dendritic spines and synapse, through its ability to form a high-order complex with Shank.
DISCUSSION
The role of Homer and Shank in the PSD matrix
We found that Homer and Shank form a large precipitable complex as revealed by biochemistry and electron microscopy (Figure 1, 7A). Formation of the complex required the tetramerization of Homer, multimerization of Shank, and an interaction between the two proteins. The complex formation was optimal when the molar ratio was close to 1:1. The copy number of Homer and Shank per PSD as monomers is estimated to be anywhere around 60 to 370 and 150 to 310, respectively (Cheng et al., 2006; Peng et al., 2004; Sugiyama et al., 2005). Therefore, Shank and Homer exist at an optimal ratio for the formation of a high-order complex. The formation of the Homer – Shank network at around 1:1 stoichiometry reasonably explains the synergistic effect of Shank and Homer on enlargement of spines (Sala et al., 2001).
Figure 7. The model of interaction between Homer and Shank.
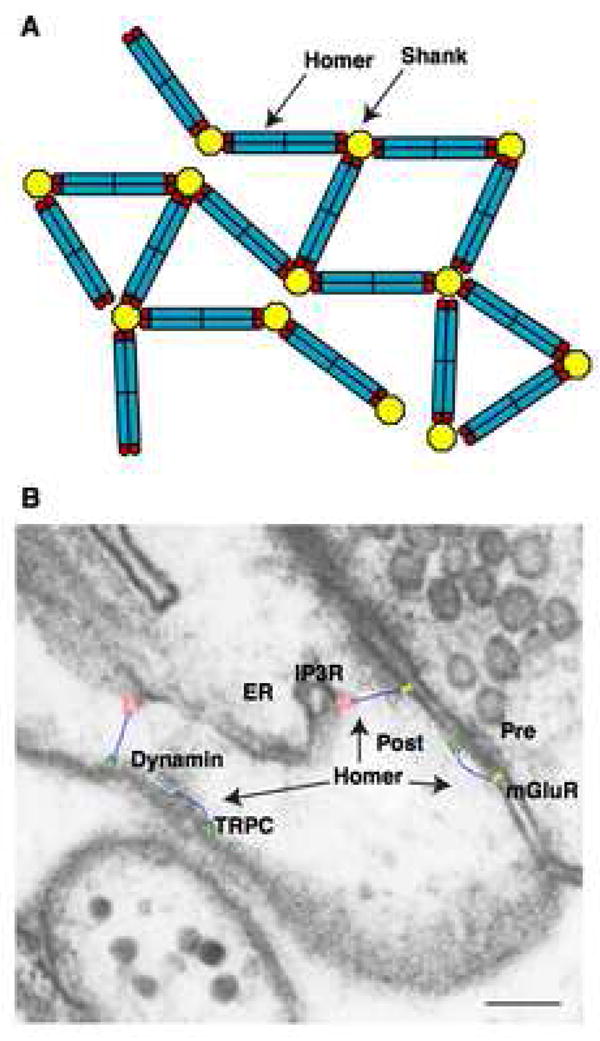
(A) A model of high-order complex between Homer and Shank. Currently, the oligomeric status of Shank is not known.
(B) Overlay of the structural model of Homer (blue) on the PSD. The structures of mGluR1 (yellow) is modeled based on the structure of mGluR1 extracellular ligand binding domain (Kunishima et al., 2000) and the structure of rhodopsin (Palczewski et al., 2000). The structures of IP3R (red) (Sato et al., 2004), TRPC (green) (Mio et al., 2007) and dynamin (Mears et al., 2007) are taken from electron microscopy images. All structures are depicted to scale on an electron microscope image of a hippocampal CA1 spine with smooth endoplasmic reticulum, obtained and modified from Spacek et al. (1997). Copyright 1997 by the Society for Neuroscience. The presynaptic terminal (Pre), postsynaptic terminal (Post) and endoplasmic reticulum (ER) are indicated. Scale bar = 0.1 μm.
Further analysis showed that another PSD protein, GKAP, stoichiometrically bound to the complex without disrupting the Homer–Shank complex. GKAP binds to MAGUK proteins, such as PSD-95 that further interact with many other synaptic proteins including AMPA-R and NMDA-R. Related to this in vitro reconstitution, the disruption of endogenous Homer-Shank complex in neurons by dimeric Homer expression reduced the number of immunopositive puncta of both Shank and PSD-95. The same construct also reduced both AMPA-R and NMDA-R mediated EPSC. The morphology of dendritic spines was also affected, which could be explained by the fact that Shank also interacts with proteins that physically or functionally associated with the cytoskeleton.
Based on these ultra-structural and biochemical evidences, we propose that the mesh-like complex of Homer and Shank serves as a structural framework for PSD which provides binding platform for other PSD proteins, with a role similar to the gephyrin polymer of inhibitory synapses (Fritschy et al., 2008). The flexible nature of the Homer-Shank matrix may contribute to the dynamic properties of the dendritic spines. Irregular polygonal mesh structure was observed previously in isolated PSD (Petersen et al., 2003). However, we cannot unequivocally conclude the identity of the reported mesh-like structure in native PSD with our reconstituted structure due to the presence of other proteins in the PSD such as CaMKII, actin and PSD-95.
There are a few functional differences of the SAM domain between Shank subtypes. The SAM domain of Shank3 was shown by X-ray crystallography and electron microscopy to form helical fibers and the fibers could be cross-linked by the divalent ion Zn2+ into the μm-sized sheet structure (Baron et al., 2006). In contrast, Shank1CΔPEST had a molecular weight comparable to a globular protein of 240 kDa, determined by gel filtration analysis (data not shown). The SAM domain is crucial for synaptic localization in Shank3, but not in Shank1 (Boeckers et al., 2005; Sala et al., 2001). Also, Zn2+ binds to the SAM domain of Shank3 but not of Shank1 (Baron et al., 2006). The requirement for the SAM domain in the formation of the high-order complex between Homer and Shank seems to conflict with the observation that Shank1 does not require the SAM domain for spine localization or spine enlargement. One explanation is that the interaction between the ankyrin repeats and the SH3 domain of Shank1 can contribute to the multimerization of Shank1 (Romorini et al., 2004), and can theoretically have a similar effect as SAM domain multimerization. We could not test this possibility because the Shank molecule containing the ankyrin repeats and the SH3 domain was not expressed as a soluble protein. Whatever the actual mechanism of Shank multimerization in neurons is, our proposed model of high-order matrix formation between Homer and Shank reasonably explains the observation that the expression level and interaction between these two proteins determines the size of dendritic spines and the PSD (Sala et al., 2001).
Crystal structure of the postsynaptic scaffolding protein Homer
The crystal structure of the very carboxy-terminus of long form of Homer forms an antiparallel tetrameric coiled-coil. The entire length of the coiled-coil region is estimated to be approximately 45 nm based on our crystal structure and other known dimeric coiled-coil structures. As a whole, a tetrameric Homer molecule has a dumbbell-like structure with a pair of EVH1 domains at both ends for ligand binding (Figure 3B). The structure may have flexibility at the hinge region and in a region between CC1 and CC2 (Figure 1A, 3B), as these regions appears not to have rigid, ordered structure as judged by their sensitivity to protease degradation (Hayashi et al., 2006).
This tetrameric arrangement is long enough to span the thickness of the postsynaptic density (30–50 nm) or other subcortical cytoskeletal networks. Thus, long form of Homer is capable of connecting a protein on the plasma membrane, such as mGluR or TRPC, with a protein on an intracellular organelle, such as IP3R, contributing to the functional coupling of these proteins to regulate intracellular Ca2+ signalling (Figure 7B). Having two EVH1 domains at each end of the molecule can potentially control the activity of its binding partners through the regulation of their oligomerization or conformational state. For example, mGluR works as a dimer (Kunishima et al., 2000), and TRPC has two Homer binding sites in one subunit and requires binding to both for functional regulation by Homer (Yuan et al., 2003). This configuration also explains how long form of Homer places endocytic zones adjacent to the PSD through interactions with dynamin-3 (Lu et al., 2007).
The spacing of two pairs of EVH1 domains may ensure that each pair of EVH1 domains at both ends interacts with different Shank multimers. Another advantage of being a tetramer is that using one of the four EVH1 domains for interaction with other binding partners will not necessarily interfere with the overall network formation because the other three EVH1 domains are still available for crosslinking. This enables non-disruptive incorporation of Homer binding proteins to the PSD matrix structure.
We previously suggested that the long form of Homer forms a parallel tetramer based on indirect biophysical and biochemical analyses (Hayashi et al., 2006). Although we correctly concluded that Homer forms a tetramer, we erroneously concluded that it was a parallel tetramer based on a sedimentation equilibrium experiment that showed that the CC1 region of Homer1b forms a tetramer, which lead to an assumption that the tetramerization spans the entire coiled-coil region. Our crystallographic analysis of the carboxy-terminal region of the coiled-coil region reported here, shows that the two pairs of CC1 regions will be located too far from each other to interact within a tetramer. All other results from our previous study are compatible with this new tail-to-tail, dimer of dimer model. Although CC1 tetramerization does not occur within a tetramer of Homer in the way we initially speculated, it may be involved in inter-oligomer interactions between Homer tetramers.
Regulation site for structural plasticity of dendritic spines
It has been demonstrated that dendritic spines change their shape and size during synaptic plasticity (Hayashi and Majewska, 2005). Given that the Homer-Shank complex is one of the determinants of dendritic spine size, regulation of the stability of the complex may be an underlying mechanism for synaptic plasticity.
One locus for regulating this complex formation is Homer1a. The addition of Homer1a inhibited the formation of the high-order complex in a dose-dependent manner (Figure 2C, D). Because the expression of Homer1a is induced by global neuronal activity (Brakeman et al., 1997), this may be one of the mechanisms of homeostatic synaptic plasticity used to reduce the overall activity of a neuron. In fact, overexpression of Homer1a negatively regulates the size of dendritic spines and synaptic transmission (Sala et al., 2003).
Another locus for this regulation is CaMKII phosphorylation. Phosphorylation of Homer3a by CaMKII also inhibited the high-order complex formation between Homer3a and Shank1CΔPEST. Although the inhibition of the high-order complex formation appears to work for weakening of synaptic transmission, this kind of temporary disassembly of the PSD structure may be required as a process of reorganization of synaptic proteins to form a larger synapse with more efficient synaptic transmission. Activated CaMKII did not affect the high-order complex formation between Homer1b and Shank1CΔPEST probably due to the lack of a CaMKII phosphorylation site, which affects the complex formation.
Another possible mechanism is the neuronal activity dependent ubiquitin-proteasome degradation of Shank, mediated by its PEST sequence (Ehlers, 2003; Lee et al., 2008). Such ubiquitination-mediated degradation of Shank will also act to reduce the size of the PSD and spines. These mechanisms may synergistically or non-synergistically, work to disassemble the Homer-Shank complex, leading to the remodeling of the synapse. In these ways, the Homer-Shank high-order complex could be regulated by multiple mechanisms under different aspects of synaptic plasticity.
EXPERIMENTAL PROCEDURES
Crystallization and data collection
Rat Homer1CC2 (290 – carboxy-terminus of Homer1b) and human Homer3CC2 (287 –carboxy-terminus of Homer3a) fragments were purified as described in the supplemental experimental procedures. Purified protein was concentrated with Ultrafree-4 Biomax 10K centrifugal filter concentrators (Millipore, Bedford, MA) to 29 mg/ml (Homer1CC2) or 27 mg/ml (Homer3CC2) for crystallization. Homer1CC2 and Homer3CC2 crystals were grown at 24 °C for 2 days by the hanging-drop vapor diffusion method with reservoir solutions of 0.1 M MES, 0.1 M ammonium sulfate, 16% PEG1000, 10% glycerol, pH 6.0, and 0.1 M Tris, 4.2 M NaCl, 10% glycerol, pH 7.6, respectively.
The crystals were transferred to the reservoir solution supplemented with glycerol to a final concentration of 20% for cryoprotection and flash-frozen in nitrogen gas stream. Diffraction data was collected using a beamline X26C National Synchrotron Light Source, Brookhaven National Laboratory. The methods and statistics of data processing are described in supplemental experimental procedures and Table S1.
High-speed centrifugation and dynamic light scattering assays
For the high-speed centrifugation assay, Shank and Homer were purified as described in the supplementary experimental procedures, and mixed at the indicated molar ratio as monomers in buffer with the final concentration of 15 μM in 20 mM potassium phosphate, 0.4 M NaCl, 0.1% 2-mercaptoethanol, pH 7.4, and incubated at 4°C overnight. The samples were centrifuged by Optima TLX ultracentrifuge (Beckman Coulter, Fullerton, CA) with a TLA-55 rotor at 4°C, 98,560 × g for 1 hour. The supernatant and pellet were then recovered. The pellet was re-suspended in SDS-PAGE sample buffer at the same dilution as the supernatant and separated using 12% SDS-PAGE gel.
To see the effect of CaMKII phosphorylation, CaMKIIα purified from transfected HEK293-T cells as described in the supplementary experimental procedures and equimolar bovine brain calmodulin (EMD Biosciences, Madison, WI) was incubated in 30 mM HEPES (pH 7.5)/5 mM MgCl2/0.2 mM CaCl2/0.1 mM EGTA/0.1 mM ATP for 5 min at 25°C. Then, Homer and Shank1CΔPEST were added at the final concentration of 8 μM Homer/8 μM Shank/3 μM calmodulin - CaMKIIα/0.4 M NaCl. The mixture was incubated at 25°C for 30 min, followed by centrifugation as described above.
The measurement of the hydrodynamic radius with dynamic light scattering was carried out at 25°C using the protein mixture prepared as above with DynaPro Titan light scattering system (Wyatt, Santa Barbara, CA). The results shown are representative of more than two independent experiments.
Acknowledgments
The crystallographic data were deposited in PDB with accession number 3CVE (Homer1b) and 3CVF (Homer3a). We thank Drs. Amy E. Keating, Robert T. Sauer, Myung Jong Kim, Amanda Mower, Teiichi Furuichi and Morgan Sheng for helpful discussion and sharing of resources, as well as Ms. Cristina Zucchi and Ms. Valentina Giannini for technical help. The Biophysical Instrumentation Facility for the Study of Complex Macromolecular Systems (supported by NSF-0070319 and NIH GM68762) at Massachusetts Institute of Technology is gratefully acknowledged. This work was supported by RIKEN, NIH grant R01DA17310, and Grant-in-Aid from the Ministry of Education, Science, and Culture of Japan (Y.H.), Telethon – Italy (Grant No. GGP06208) and Fondazione Cariplo (Project number 2006–0779/109251) and Compagnia di San Paolo (Project No. 2005–1964) (C.S.).
Footnotes
Publisher's Disclaimer: This is a PDF file of an unedited manuscript that has been accepted for publication. As a service to our customers we are providing this early version of the manuscript. The manuscript will undergo copyediting, typesetting, and review of the resulting proof before it is published in its final citable form. Please note that during the production process errors may be discovered which could affect the content, and all legal disclaimers that apply to the journal pertain.
References
- Baron MK, Boeckers TM, Vaida B, Faham S, Gingery M, Sawaya MR, Salyer D, Gundelfinger ED, Bowie JU. An architectural framework that may lie at the core of the postsynaptic density. Science. 2006;311:531–535. doi: 10.1126/science.1118995. [DOI] [PubMed] [Google Scholar]
- Beneken J, Tu JC, Xiao B, Nuriya M, Yuan JP, Worley PF, Leahy DJ. Structure of the Homer EVH1 domain-peptide complex reveals a new twist in polyproline recognition. Neuron. 2000;26:143–154. doi: 10.1016/s0896-6273(00)81145-9. [DOI] [PubMed] [Google Scholar]
- Boeckers TM, Liedtke T, Spilker C, Dresbach T, Bockmann J, Kreutz MR, Gundelfinger ED. C-terminal synaptic targeting elements for postsynaptic density proteins ProSAP1/Shank2 and ProSAP2/Shank3. J Neurochem. 2005;92:519–524. doi: 10.1111/j.1471-4159.2004.02910.x. [DOI] [PubMed] [Google Scholar]
- Brakeman PR, Lanahan AA, O’Brien R, Roche K, Barnes CA, Huganir RL, Worley PF. Homer: a protein that selectively binds metabotropic glutamate receptors. Nature. 1997;386:284–288. doi: 10.1038/386284a0. [DOI] [PubMed] [Google Scholar]
- Cheng D, Hoogenraad CC, Rush J, Ramm E, Schlager MA, Duong DM, Xu P, Wijayawardana SR, Hanfelt J, Nakagawa T, et al. Relative and absolute quantification of postsynaptic density proteome isolated from rat forebrain and cerebellum. Mol Cell Proteomics. 2006;5:1158–1170. doi: 10.1074/mcp.D500009-MCP200. [DOI] [PubMed] [Google Scholar]
- Ehlers MD. Activity level controls postsynaptic composition and signaling via the ubiquitin-proteasome system. Nat Neurosci. 2003;6:231–242. doi: 10.1038/nn1013. [DOI] [PubMed] [Google Scholar]
- Fritschy JM, Harvey RJ, Schwarz G. Gerphyrin: where do we stand, where do we go? Trends Neurosci. 2008;31:257–264. doi: 10.1016/j.tins.2008.02.006. [DOI] [PubMed] [Google Scholar]
- Hayashi MK, Ames HM, Hayashi Y. Tetrameric hub structure of postsynaptic scaffolding protein homer. J Neurosci. 2006;26:8492–8501. doi: 10.1523/JNEUROSCI.2731-06.2006. [DOI] [PMC free article] [PubMed] [Google Scholar]
- Hayashi Y, Majewska AK. Dendritic spine geometry: functional implication and regulation. Neuron. 2005;46:529–532. doi: 10.1016/j.neuron.2005.05.006. [DOI] [PubMed] [Google Scholar]
- Im YJ, Lee JH, Park SH, Park SJ, Rho SH, Kang GB, Kim E, Eom SH. Crystal structure of the Shank PDZ-ligand complex reveals a class I PDZ interaction and a novel PDZ-PDZ dimerization. J Biol Chem. 2003;278:48099–48104. doi: 10.1074/jbc.M306919200. [DOI] [PubMed] [Google Scholar]
- Irie K, Nakatsu T, Mitsuoka K, Miyazawa A, Sobue K, Hiroaki Y, Doi T, Fujiyoshi Y, Kato H. Crystal structure of the Homer 1 family conserved region reveals the interaction between the EVH1 domain and own proline-rich motif. J Mol Biol. 2002;318:1117–1126. doi: 10.1016/S0022-2836(02)00170-5. [DOI] [PubMed] [Google Scholar]
- Kunishima N, Shimada Y, Tsuji Y, Sato T, Yamamoto M, Kumasaka T, Nakanishi S, Jingami H, Morikawa K. Structural basis of glutamate recognition by a dimeric metabotropic glutamate receptor. Nature. 2000;407:971–977. doi: 10.1038/35039564. [DOI] [PubMed] [Google Scholar]
- Lee SH, Choi JH, Lee N, Lee HR, Kim JI, Yu NK, Choi SL, Kim H, Kaang BK. Synaptic protein degradation underlies destabilization of retrieved fear memory. Science. 2008;319:1253–1256. doi: 10.1126/science.1150541. [DOI] [PubMed] [Google Scholar]
- Lim S, Naisbitt S, Yoon J, Hwang JI, Suh PG, Sheng M, Kim E. Characterization of the Shank family of synaptic proteins. Multiple genes, alternative splicing, and differential expression in brain and development. J Biol Chem. 1999;274:29510–29518. doi: 10.1074/jbc.274.41.29510. [DOI] [PubMed] [Google Scholar]
- Lu J, Helton TD, Blanpied TA, Racz B, Newpher TM, Weinberg RJ, Ehlers MD. Postsynaptic positioning of endocytic zones and AMPA receptor cycling by physical coupling of dynamin-3 to Homer. Neuron. 2007;55:874–889. doi: 10.1016/j.neuron.2007.06.041. [DOI] [PMC free article] [PubMed] [Google Scholar]
- Mears JA, Ray P, Hinshaw JE. A corkscrew model for dynamin constriction. Structure. 2007;15:1190–1202. doi: 10.1016/j.str.2007.08.012. [DOI] [PMC free article] [PubMed] [Google Scholar]
- Minakami R, Kato A, Sugiyama H. Interaction of Vesl-1L/Homer 1c with syntaxin 13. Biochem Biophys Res Commun. 2000;272:466–471. doi: 10.1006/bbrc.2000.2777. [DOI] [PubMed] [Google Scholar]
- Mio K, Ogura T, Kiyonaka S, Hiroaki Y, Tanimura Y, Fujiyoshi Y, Mori Y, Sato C. The TRPC3 channel has a large internal chamber surrounded by signal sensing antennas. J Mol Biol. 2007;367:373–383. doi: 10.1016/j.jmb.2006.12.043. [DOI] [PubMed] [Google Scholar]
- Mizutani A, Kuroda Y, Futatsugi A, Furuichi T, Mikoshiba K. Phosphorylation of Homer3 by calcium/calmodulin-dependent kinase II regulates a coupling state of its target molecules in Purkinje cells. J Neurosci. 2008;28:5369–5382. doi: 10.1523/JNEUROSCI.4738-07.2008. [DOI] [PMC free article] [PubMed] [Google Scholar]
- Naisbitt S, Kim E, Tu JC, Xiao B, Sala C, Valtschanoff J, Weinberg RJ, Worley PF, Sheng M. Shank, a novel family of postsynaptic density proteins that binds to the NMDA receptor/PSD-95/GKAP complex and cortactin. Neuron. 1999;23:569–582. doi: 10.1016/s0896-6273(00)80809-0. [DOI] [PubMed] [Google Scholar]
- Okabe S. Molecular anatomy of the postsynaptic density. Mol Cell Neurosci. 2007;34:503–518. doi: 10.1016/j.mcn.2007.01.006. [DOI] [PubMed] [Google Scholar]
- Palczewski K, Kumasaka T, Hori T, Behnke CA, Motoshima H, Fox BA, Le Trong I, Teller DC, Okada T, Stenkamp RE, et al. Crystal structure of rhodopsin: A G protein-coupled receptor. Science. 2000;289:739–745. doi: 10.1126/science.289.5480.739. [DOI] [PubMed] [Google Scholar]
- Peng J, Kim MJ, Cheng D, Duong DM, Gygi SP, Sheng M. Semiquantitative proteomic analysis of rat forebrain postsynaptic density fractions by mass spectrometry. J Biol Chem. 2004;279:21003–21011. doi: 10.1074/jbc.M400103200. [DOI] [PubMed] [Google Scholar]
- Romorini S, Piccoli G, Jiang M, Grossano P, Tonna N, Passafaro M, Zhang M, Sala C. A functional role of postsynaptic density-95-guanylate kinase-associated protein complex in regulating Shank assembly and stability to synapses. J Neurosci. 2004;24:9391–9404. doi: 10.1523/JNEUROSCI.3314-04.2004. [DOI] [PMC free article] [PubMed] [Google Scholar]
- Sala C, Futai K, Yamamoto K, Worley PF, Hayashi Y, Sheng M. Inhibition of dendritic spine morphogenesis and synaptic transmission by activity-inducible protein Homer1a. J Neurosci. 2003;23:6327–6337. doi: 10.1523/JNEUROSCI.23-15-06327.2003. [DOI] [PMC free article] [PubMed] [Google Scholar]
- Sala C, Piech V, Wilson NR, Passafaro M, Liu G, Sheng M. Regulation of dendritic spine morphology and synaptic function by Shank and Homer. Neuron. 2001;31:115–130. doi: 10.1016/s0896-6273(01)00339-7. [DOI] [PubMed] [Google Scholar]
- Sato C, Hamada K, Ogura T, Miyazawa A, Iwasaki K, Hiroaki Y, Tani K, Terauchi A, Fujiyoshi Y, Mikoshiba K. Inositol 1,4,5-trisphosphate receptor contains multiple cavities and L-shaped ligand-binding domains. J Mol Biol. 2004;336:155–164. doi: 10.1016/j.jmb.2003.11.024. [DOI] [PubMed] [Google Scholar]
- Sheng M, Hoogenraad CC. The postsynaptic architecture of excitatory synapses: a more quantitative view. Annu Rev Biochem. 2007;76:823–847. doi: 10.1146/annurev.biochem.76.060805.160029. [DOI] [PubMed] [Google Scholar]
- Shiraishi-Yamaguchi Y, Furuichi T. The Homer family proteins. Genome Biol. 2007;8:206. doi: 10.1186/gb-2007-8-2-206. [DOI] [PMC free article] [PubMed] [Google Scholar]
- Spacek J, Harris KM. Three-dimensional organization of smooth endoplasmic reticulum in hippocampal CA1 dendrites and dendritic spines of the immature and mature rat. J Neurosci. 1997;17:190–203. doi: 10.1523/JNEUROSCI.17-01-00190.1997. [DOI] [PMC free article] [PubMed] [Google Scholar]
- Sugiyama Y, Kawabata I, Sobue K, Okabe S. Determination of absolute protein numbers in single synapses by a GFP-based calibration technique. Nat Methods. 2005;2:677–684. doi: 10.1038/nmeth783. [DOI] [PubMed] [Google Scholar]
- Tu JC, Xiao B, Naisbitt S, Yuan JP, Petralia RS, Brakeman P, Doan A, Aakalu VK, Lanahan AA, Sheng M, et al. Coupling of mGluR/Homer and PSD-95 complexes by the Shank family of postsynaptic density proteins. Neuron. 1999;23:583–592. doi: 10.1016/s0896-6273(00)80810-7. [DOI] [PubMed] [Google Scholar]
- Worley PF, Zeng W, Huang G, Kim JY, Shin DM, Kim MS, Yuan JP, Kiselyov K, Muallem S. Homer proteins in Ca2+ signaling by excitable and non-excitable cells. Cell Calcium. 2007;42:363–371. doi: 10.1016/j.ceca.2007.05.007. [DOI] [PMC free article] [PubMed] [Google Scholar]
- Yuan JP, Kiselyov K, Shin DM, Chen J, Shcheynikov N, Kang SH, Dehoff MH, Schwarz MK, Seeburg PH, Muallem S, et al. Homer binds TRPC family channels and is required for gating of TRPC1 by IP3 receptors. Cell. 2003;114:777–789. doi: 10.1016/s0092-8674(03)00716-5. [DOI] [PubMed] [Google Scholar]