Abstract
Objective
To investigate the functional connection between motor cortex and muscles, we measured Electroencephalogram-Electromyogram (EEG-EMG) coherence of stroke patients and controls.
Methods
Eight healthy controls and 21 patients with shoulder and elbow coordination deficits were enrolled. All subjects performed a reaching task involving shoulder flexion and elbow extension. EMG of the anterior deltoid (AD) and brachii muscles (BB, TB) and 64-channel scalp EEG were recorded during the task. Time-frequency coherence was calculated using the bivariate autoregressive model.
Results
Stroke patients had significantly lower corticomuscular coherence compared with healthy controls for the AD and BB muscles at both the beta (20-30 Hz) and lower gamma (30-40 Hz) bands during the movement. BH procedure (FDR) identified a reduced corticomuscular coherence for stroke patients in 11 of 15 scalp area-muscle combinations. There was no statistically significant difference between stroke patients and control subjects according to coherence in other frequency bands.
Conclusion
Poorly recovered stroke survivors with persistent upper-limb motor deficits exhibited significantly lower gamma-band corticomuscular coherence in performing a reaching task.
Significance
The study suggests poor brain-muscle communication or poor integration of the EEG and EMG signals in higher frequency band during reaching task may reflect an underlying mechanism producing movement deficits post stroke.
Keywords: cortical muscular coherence, reaching, motor planning, stroke, coordination
Introduction
Motor deficits are a major consequence of stroke. Though it is generally believed that stroke interrupts the neural networks that control movements, little is known regarding the underlying mechanisms of the impairments in cortical control or in the neural connections between cortex and muscle that cause the motor deficits. Previous studies have indicated that the cortical representation of movement changes post stroke. For example, excess activation of extra motor areas can occur (Weiller et al., 1993; Cao et al., 1998; Calautti et al., 2001a) and abnormally elevated bilateral activation can occur (Cramer et al., 1997; Seitz et al., 1998; Marshall et al., 2000). Additionally, an abnormal shift of activation can occur between contralateral and ipsilateral hemispheres (Nelles et al., 1999; Marshall et al., 2000; Calautti et al., 2001b). Consistent with these findings is the abnormal corticocortical coherence post stroke (Strens et al., 2004; Gerloff et al., 2006). However, few studies have examined the effects of stroke on the functional coupling between cortical commands and consequent muscle activation. It is unknown whether the strength of functional corticomuscular coupling is weakened in stroke patients with motor deficits.
Oscillatory activities are common features of brain signals, as measured by electrophysiological signals. Cortical oscillatory drives are coupled with muscle activation in several different frequency bands, depending on the functions engaged within the motor system. For example, corticomuscular oscillation at ~10 Hz is considered to indicate pulsatile communication between brain and muscle (Vallbo & Wessberg, 1993), and the oscillation in the beta band (13 to 30 Hz) is associated with strategies for controlling submaximal muscle force (Conway et al., 1995; Halliday et al., 1998; Kilner et al., 2000). Oscillation in the low range of the gamma band (30~60 Hz) is related to strategies for controlling stronger muscle force production (Brown et al. 1998). It has been suggested that an oscillatory cortical command might be an efficient way to recruit motor units (Murthy & Fetz, 1994; Kilner et al., 1999; Mima & Hallett, 1999). Thus, corticomuscular coherence is a direct measurement of the connections and relationship between cortical and muscular activity.
Well-recovered stroke patients have been studied during weak tonic contraction tasks (affected limb). Mima et al. (2001a) found that scalp locations for electroencephalogram-electromyogram (EEG-EMG) coherence measurements in stroke were mainly over the sensorimotor area contralateral (lesioned hemisphere) to the moving limb; there was no significant EEG-EMG coherence at the ipsilateral-side (non-lesioned hemisphere) EEG recording locations, as would be expected for well-recovered patients after stroke. Similar result of recovered crossed cortico-spinal connectivity was also reported with well recovered patients with majority MRC scale score 4~5 with both Transcranial Magnetic Stimulation (TMS) and Magnetoencephalography (MEG) investigation (Braun et al. 2007). It was concluded that direct functional connection from the brain to muscle originated in the contralateral motor cortex. However, the stroke patients who participated in these studies all had good recovery (from severe hemiparesis at the acute stage to mild hemiparesis at study enrollment). Notably, no studies have investigated corticomuscular coherence or functional connection between the brain and muscle in poorly recovered stroke patients, nor has there been investigation of the strength of the connection in stroke patients versus healthy controls. The purpose of this study was to study corticomuscular coherence during a reaching task in healthy controls and in poorly recovered patients after stroke.
Methods
Subjects
Twenty-one stroke patients who had persistent dyscoordination of the upper limb (Table 1; mean age, 59.57 ± 8.61 years; range, 39 -78 years; 16 male) and eight healthy controls (mean age, 60.62 ± 6.25 years; range, 53 - 69 years; 5 male) participated in the study. Patients were at 12 -109 (40.5 ± 29.1 months) months after stroke. All the patients were first-time stroke victims and their lesion sites are marked in Table 1. Lesion locations of two patients were not available as they had accepted healthcare at other facilities before entering the VA rehabilitation program and we had difficulties to retrieve the information. This study was performed with the oversight of the Institutional Review Board of the Medical Center, and conducted according to the Declaration of Helsinki. All subjects gave informed consent prior to their participation.
Table 1.
Demographic information of stroke patients
| Patient | Age | Months since Stroke | Gender | FM Score | Dominant Hand | Lesion Site | Stroke Type |
|---|---|---|---|---|---|---|---|
| 1 | 60 | 24 | F | 18 | R | L Vestibular artery | ischemia |
| 2 | 69 | 17 | M | 28 | R | R Pons | Ischemia |
| 3 | 52 | 109 | M | 19 | R | R | hemorrhage |
| 4 | 54 | 81 | M | 15 | R | R MCA | Ischemia |
| 5 | 73 | 20 | M | 19 | R | L MCA | hemorrhage |
| 6 | 63 | 12 | M | 16 | L | R | Ischemia |
| 7 | 55 | 67 | M | 18 | R | R Carotid Occlusion | Ischemia |
| 8 | 63 | 29 | F | 34 | R | L MCA | Ischemia |
| 9 | 60 | 52 | M | 30 | R | L Carotid Occlusion | Ischemia |
| 10 | 49 | 54 | F | 27 | R | L MCA & ACA | Ischemia |
| 11 | 64 | 27 | M | 39 | R | R Carotid Occlusion | Ischemia |
| 12 | 78 | 79 | M | 28 | R | L MCA | Ischemia |
| 13 | 58 | 34 | M | 18 | R | R Carotid Occlusion | Ischemia |
| 14 | 61 | 16 | M | 23 | L | R Basal Ganglia | Ischemia |
| 15 | 39 | 94 | F | 28 | R | R Cerebral Aneurysm | hemorrhage |
| 16 | 61 | 35 | M | 17 | R | L Basal Ganglia | ischemia |
| 17 | 58 | 21 | M | 41 | R | L Cerebral Aneurysm, including Occipital region | hemorrhage |
| 18 | 64 | 18 | M | 19 | R | L Temporal region | Ischemia |
| 19 | 53 | 20 | F | 21 | R | L Internal Capsule | Ischemia |
| 20 | 66 | 29 | M | 34 | R | R Parietal region | Ischemia |
| 21 | 51 | 13 | M | 25 | R | L Internal Capsule | ischemia |
Data Recording
Motor Task Apparatus
A de-activated shoulder/elbow robot (i.e., no assistance or resistance was activated; InMotion2; Interactive Motion Technologies, Inc., Cambridge, MA) was used to support the subject’s forearm and hand, standardize the shoulder/elbow reaching task on a horizontal plane, and acquire kinematic data (Fig. 1A). The apparatus restrained movements of the fingers and wrist joints, allowing movements only at the elbow and shoulder joints. Prior to each movement, the subject’s hand was placed at the center of the workspace (CWS) and a target was displayed on a PC that required an accurate 14-cm linear movement of the hand in the horizontal plane. Subjects attempted to move the affected hand from the CWS to the target in a direction directly away from the subject by flexing the shoulder and extending the elbow joints. Five sets of 10 repetitions were performed with a 2-min rest between sets (each inter-trial interval was about 20 s) to avoid the effects of fatigue. A customized goniometer was attached to the “upper” and “lower” arms of the robotic device to acquire additional information about angle changes during the reaching movement (see below).
Figure 1.
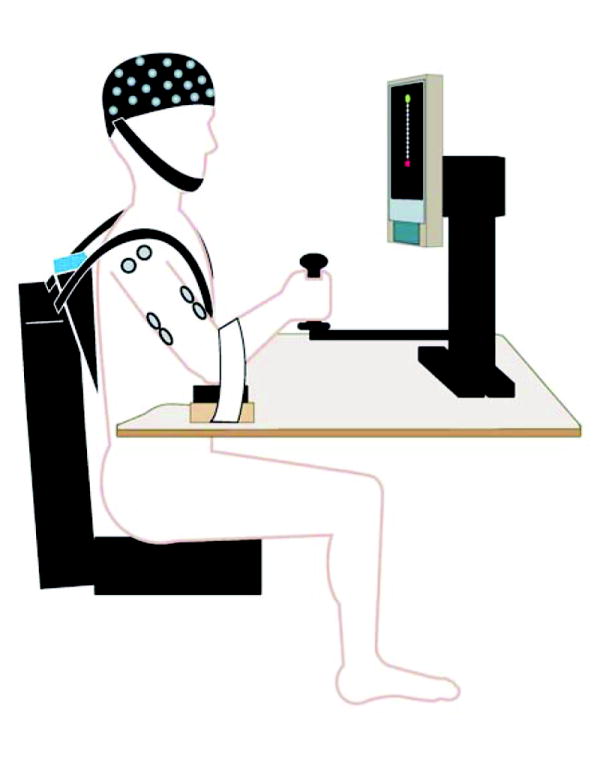
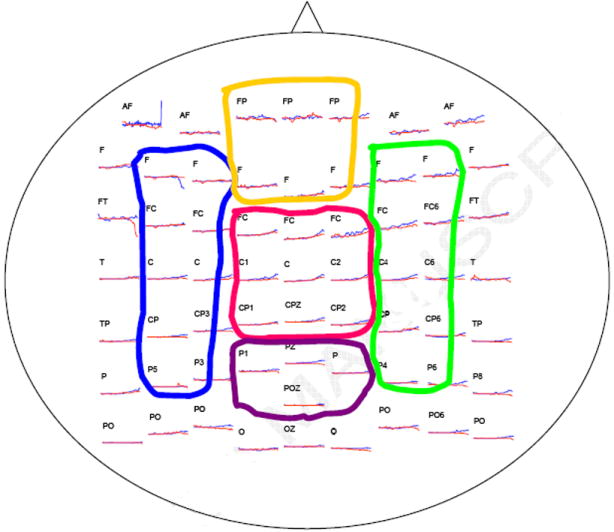
(A) Experimental setup. Subjects were seated on a chair with only the unilateral (affected side) shoulder and arm moveable. The elbow was supported by a piece of smooth wood with little friction with the table. The hand was around a cradle connected to the robotic arm. A target and the start position (current cradle position) were displayed on a screen, and subjects needed to move the cradle forward to reach the target point. No assistance or resistance was provided by the robot through the cradle for the reaching movement. (B) The 10-20 International EEG system and the five areas grouped.
Electromyographic Recording
Surface EMG signals were recorded from two agonists (triceps brachii [TB] and anterior deltoid [AD] muscles) and an antagonist (biceps brachii [BB] muscles) using bipolar electrodes. The reference electrode was applied at the lateral epicondyle near the elbow. The EMG signals were amplified (X1000), filtered (10-500 Hz) using Grass Neurodata amplifiers (Astro-Med, Inc., West Warwick, RI), and digitized (1000 Hz) using a Spike2 data acquisition system (Cambridge Electronics Design, Cambridge, UK). The EMG signals were rectified before further analysis.
EEG Recording
A 64-channel NeuroScan EEG system (NeuroScan Labs, El Paso, TX) was used to acquire EEG signals from the scalp. A Quik-Cap elastic cap that holds 64 surface electrodes was placed on the scalp for EEG data recording. The configuration of the electrode arrangement in the cap is based on the International 10-20 System (Jasper, 1958). The EEG electrodes were referenced to the common linked electrodes at the earlobes. Impedance for all the electrodes was monitored at a level below 10,000 Ω prior to the initiation of data collection. All channels of the EEG signals were amplified (headbox X150, main amplifier X500), filtered (0.3-50 Hz), and digitized (1000 sample/s) using the NeuroScan Labs software. The change in angle signal generated by the respective movements of the two robotic limb segments was sensed by the potentiometer in the goniometer and was recorded by both the Spike2 (EMG) and NeuroScan (EEG) systems to synchronize the two physiological signals. A trigger signal was generated at each movement onset for the subsequent synchronization and triggered-averaging of the EEG.
Data Processing and Analysis
The EEG and EMG recordings were segmented into a 6-s window for each trial, 1.5 s before and 4.5 s after the movement onset (movement onset was defined as the time at which the goniometer detected an angle change between the robotic limb segments). The duration of the reaching movement (from onset to hitting the target) ranged from 1.24 s to 3.98 s (stroke: 2.57 ± 1.13 s; control: 1.98 ± 0.66 s) among the subjects. All segmented EEG data were inspected visually. Trials with eye blinks or other signal artifacts were excluded, and the corresponding EMGs of those trials were discarded. A bivariate autoregressive model was applied to each EEG-EMG pair and the coefficients were derived by ARfit MATLAB software (Schneider & Neumaier, 2001). Many previous studies have applied the MVAR model (same as the bivariate autoregressive model used in this study) to estimate coherence between two signals besides the traditional DFT method (i.e., Bressler et al., 1999; Eiselt et al., 2000; Mima et al., 2001b; Shibata et al., 2004). The derived corticomuscular coherence is similar to that estimated by the traditional DFT method (Mima et al., 2001b). Compared with the DFT method, the MVAR model has the benefit of finer frequency resolution whereas a major disadvantage is that the confidence level calculation needs more statistic consideration (Whitcher et al., 2005). Both Schwarz’s Bayesian Criterion (Schwarz, 1978) and Akaike’s Final Prediction Error Criterion (Akaike, 1971) suggested an optimal order of 7 for the model to treat the data of the current study.
A Boxcar window was applied during the coherence calculation, with window length of 512 sample points and a 128-sample overlap to generate time-dependent coefficients. Window length is always a compromise between frequency resolution and time resolution. Previous study (Ginter et al. 2001) has suggested satisfactory results using MVAR model with a 300-ms window. However, longer window might inevitably have influence from data stationarity. The autospectrum and cross-spectrum of the EEG and EMG were calculated from the coefficients of each trial and then averaged across trials. Coherence was obtained from the normalization of the cross-spectrum
where Sxx(f) and Syy(f) are the autospectra (cross-trial averaged) of the EEG and EMG signals (x and y) for a given frequency f, and Sxy(f) is the cross-spectrum (cross-trial averaged) between them. Finally, dynamic coherence was presented in a time-frequency domain with a frequency resolution of 0.2 Hz and a time resolution of 0.4 s.
Corticomuscular coherence was calculated first between the EEG of each of the 64 electrodes and the EMG of each of the three muscles (AD, BB and TB). Subsequently, coherence values from individual electrodes were grouped into five cortical areas according to EEG electrode locations with each muscle (Fig. 1B): left area (F3, F5, FC3, FC5, C3, C5, CP3, CP5, P3, P5), right area (F4, F6, FC4, FC6, C4, C6, CP4, CP6, P4, P6), frontal area (FP1, FPZ, FP2, F1, FZ, F2), central area (FC1, FCZ, FC2, C1, CZ, C2, CP1, CPZ, CP2), and posterior area (P1, PZ, P2, POZ). For a given muscle, EEG/EMG mean coherence was calculated for each of the five EEG regions. For the stroke patients, coherence data were categorized as EEGs from the lesioned vs. non-affected sides of the brain with EMG of the affected limb (which was the limb that was tested). Laplacian transformation can be performed in high-density, multi-channel EEG recordings to avoid overestimating coherence due to volume conduction or common references. However, we chose not to apply Laplacian transformation because that might lead to underestimating coherence at lower-frequency bands. In this study, the EEG recordings were grouped into five areas (volume conduction that might have occurred among the areas is not as significant as that which could have occurred among individual electrodes). Volume conductance had little influence on the results of the study because we did not calculate EEG-EEG coherence between these areas; and, additionally, for our purpose, the head-surface spatial characterization of the EEG-EMG coherence was not the most important consideration. Power of the EEG and EMG signals were calculated and compared between the stroke and control groups. In each trial, the EEG and EMG were normalized by the mean amplitude and then analyzed using the FFT. The power spectrum were first averaged within the beta and gamma bands and then averaged across trials. Normalized EMG could reduce the inter-subject variance without influence on the coherence calculation (coherence is also a normalized index between 0 and 1, it would be influenced by the relative power distribution among frequency ranges instead of the absolute power value).
The robot acquired kinematic data at 200Hz indicating the position of the manipulandum as the subject attempted to move the manipulandum (and linked cursor) from the start position to the end target position. The position data was measured by built-in, precision potentiometers (0.9 Kohm/rad). These data were used to calculate a measure of the ability to maintain the desired movement trajectory to the target. The movement trajectory maintenance was defined as the mean lateral deviation from the desired movement path as: , where D is the lateral deviation, N is the total number of samples, s(i) is the hand position of subject at the ith sample, p(i) is the coordinates of the intersection between the straight line connecting the targets and its perpendicular passing through s(i) position (Daly et al., 2006). Force exerted by the subject during the reaching task was measured by the load cell within the manipulandum.
Statistical Analysis
In this study, we calculated the significance of coherence using two methods. First, the bootstrap critical value of coherence (Zwiers, 1990) was calculated (at the significance level of 0.05) for every paired EEG-EMG signals. Each pixel (representing coherence in the 0.4 s/0.2 Hz time-frequency range) in the dynamic coherence map having coherence higher than the critical value was marked as 1; and each pixel with a value lower than the critical value was marked as 0. The dynamic coherence maps were then averaged across subjects (Figure 2).
Figure 2.
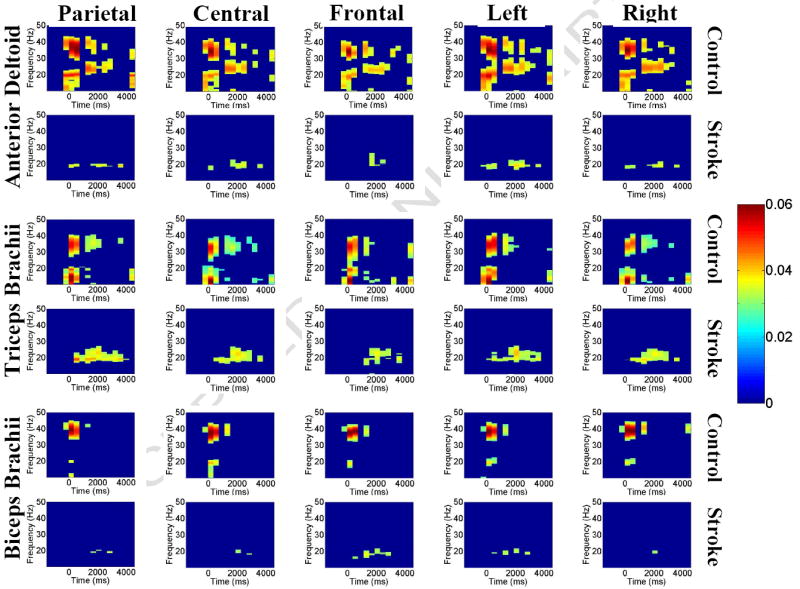
Group-averaged corticomuscular coherence between EEGs of parietal, central, frontal, left (non-affected side for stroke patients) and right (lesioned side for stroke patients) areas and EMGs of AD, TB, and BB muscles. For each muscle, the upper row shows its coherence with the scalp areas for the controls and the lower row for stroke patients. For each plot in each row or column, the y axis is frequency, the x axis is time, and the color bar indicates the level of coherence (red, higher level; blue, lower level). The figure shows clearly that stroke patients had no significant corticomuscular coherence at the higher-frequency band (30-50 Hz).
Second, to address the issue of multiplicity of comparing multiple cortical areas and muscles, we performed multiple comparisons using the Benjamini and Hochberg (BH) procedure (Benjamini & Hochberg, 1995). The BH procedure controls an overall false discovery rate (FDR), which is the expected proportion of false significant results among those pixels (or brain area-muscle combinations) at which the differences between stroke patients and control subjects were declared to be significant. Specifically, for every brain area-muscle combination, we calculated the p value (approximated by Student’s t test) of each pixel on the dynamic coherence map (6400 pixels) between 21 stroke patients and 8 controls. A threshold P(i) was derived from the observed p-value distribution by the equation
where m is the number of pixels (6400 here), α is the overall FDR that we want to control (0.05), and i is the largest number of k whose p-value satisfies the above equation, and P(1) ≤ P(2) ≤…≤ P(m) are the sorted p-values (Benjamini & Hochberg, 1995). Pixels with a p-value lower than the threshold indicate a significant difference between stroke patients and controls. Although the BH procedure was developed for comparisons in which the test statistics at different pixels are independent, the BH is still a valid conservative procedure if the correlations of these statistics have a property of “positive regression dependency on subsets” (PRDS) (Benjamini & Yekutieli, 2001). As illustrated by Wang et al. (in press), if the correlations tend to be stronger in closer pixels (which is a reasonable assumption for our data), the PRDS is satisfied.
To exam whether the coherence difference between stroke and controls was contributed by potential EEG power differences, we performed independent t-tests to compare spectral power density in the beta and gamma bands between the two groups. The results did not show significant differences in the EEG power between the groups (Figure 3). In addition, one-way ANCOVA (Analysis of Covariance; dependent variable: EEG-EMG coherence; independent variable: subject group; covariate: EEG power) was performed to test the group-by-power interaction. The ANCOVA revealed no significant group-by-power interaction among the 15 corticomuscular (5 scalp areas × 3 muscles) coherence combinations (TB-Patietal, F: 0.154 p: 0.699; TB-Frontal, F: 0.048 p: 0.828; TB-Central, F: 0.029 p: 0.867; TB-Left, F: 1.285 p: 0.268; TB-Right, F: 0.152 p: 0.700; BB-Patietal, F: 0.000 p: 0.987; BB-Frontal, F: 0.455 p: 0.506; BB-Central, F: 0.011 p: 0.919; BB-Left, F: 0.3 p: 0.589; BB-Right, F: 0.425 p: 0.521; AD-Patietal, F: 0.998 p: 0.328; AD-Frontal, F: 0.007 p: 0.934; AD-Central, F: 0.028 p: 0.868; AD-Left, F: 0.026 p: 0.874; AD-Right, F: 1.163 p: 0.292;), which ruled out a significant contribution by EEG power discrepancies to the observed difference in the corticomuscular coherence between the groups.
Figure 3.
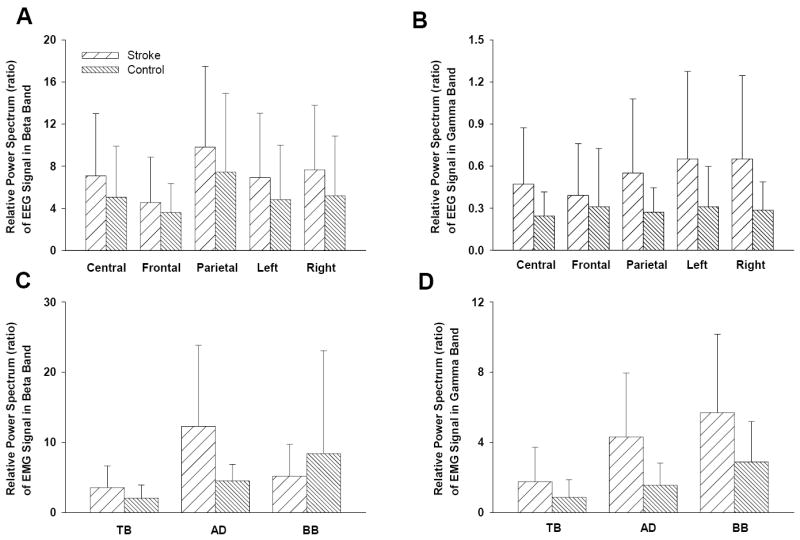
EEG and EMG power spectrum comparisons between stroke and controls for the beta and gamma frequency bands. The EEG and EMG signals were normalized by mean value and then applied with FFT to derive the relative power spectra. There were no significant difference in the power spectra between the groups.
Results
Figure 2 shows averaged EEG-EMG coherence across subjects (for each muscle, the upper row is for controls and lower row for stroke patients); only the pixels that exhibited significant coherence (using the bootstrap critical value calculation) are presented in the figure. The color bar on the right indicates the level of coherence. Stroke patients had significantly lower corticomuscular coherence compared with healthy controls for all the scalp area-muscle combinations, especially for the AD and BB muscles at both the beta (20-30 Hz) and gamma (30-40 Hz) bands during the time period of -0.5 to 4 s, corresponding roughly from beginning to end of the movement.
Figure 4 shows the coherence spectra for the controls (blue) and stroke patients (red) calculated throughout the time range from -0.5 to 4 s. Similar to the results in Figure 2, control subjects exhibited two coherence peaks corresponding primarily to the beta and gamma bands in each spectrum. In contrast, there was no coherence peak in the gamma band in stroke patients in any of the EEG-EMG combinations. The results in the beta band were mixed. Stroke patients exhibited higher peak EEG-EMG coherence for the TB muscle with the parietal and left (unaffected) areas, as well as for the BB muscle with the frontal area in a narrower frequency range. However, for stroke, there was a lower EEG-EMG coherence for the AD and BB muscles with EEG of a majority of scalp areas versus that of controls.
Figure 4.
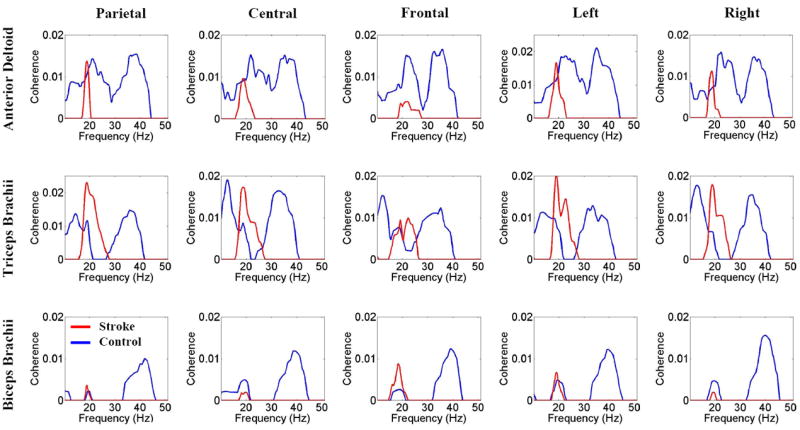
Group-averaged EEG-EMG coherence spectra of stroke patients and controls for the same scalp areas and muscles described in the legend to Figure 1B. Blue lines indicate for controls and red lines mean stroke patients. The spectra were calculated based on EEG and EMG signals from -0.5 to 4.0 s, corresponding roughly from the beginning to the end of the reaching movement. The figure shows no coherence peak at gamma frequency (>30 Hz) in stroke patients. For a majority of the area EEG and muscle EMG combinations, stroke patients had lower coherence at beta frequency (<30 Hz) with a narrower peak, especially for the AD muscle.
Consistent with the results shown in Figures 2 and 4, the statistical analysis using the BH procedure (FDR) identified a statistically significant, abnormally reduced corticomuscular coherence for stroke patients in 11 of 15 scalp area-muscle combinations (Fig. 5), especially for the AD muscle in the gamma (30-40 Hz) frequency. Figure 5 illustrates the number of pixels that indicated a significant difference in coherence between the stroke patients and control subjects (stroke patients had a lower coherence) in the gamma band, with statistical control of the overall error rate when all the locations and muscles were compared simultaneously.
Figure 5.
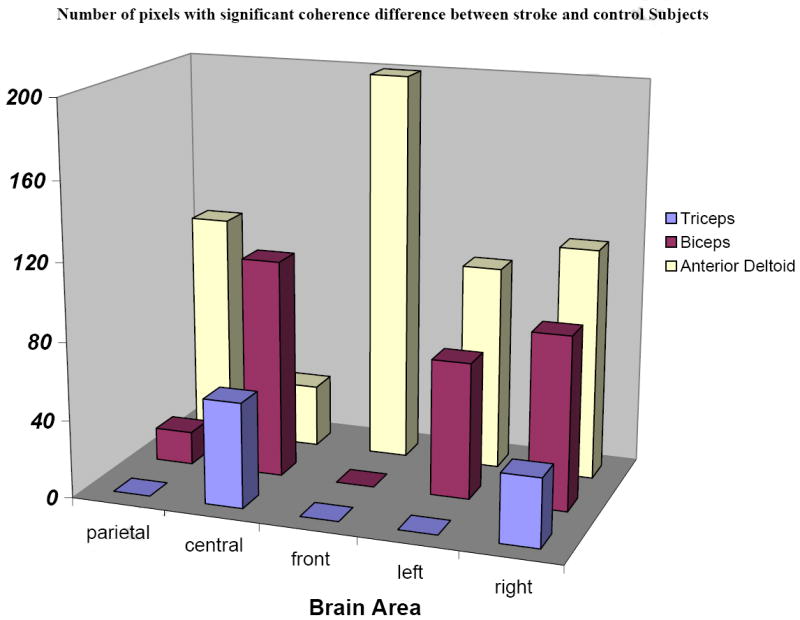
False discovery rate statistical analysis of corticomuscular coherence data of stroke patients vs. controls. Overall FDR was controlled considering multiple factors of scalp areas, muscles, and frequency bands. Pixels indicating a significant coherence difference between the two groups in the gamma band were summed in the figure. Significant corticomuscular signal coherence differences (lower coherence in stroke patients) were found in 11 of 15 scalp area and muscle combinations.
Figure 6 shows the subjects’ motor performance during the reaching movement. Compared with controls, stroke subjects exhibited poor ability for the movement trajectory maintenance (p = 0.0048). There is no significant difference in force in the movement direction between stroke and control subjects during the task (p = 0.2818).
Figure 6.
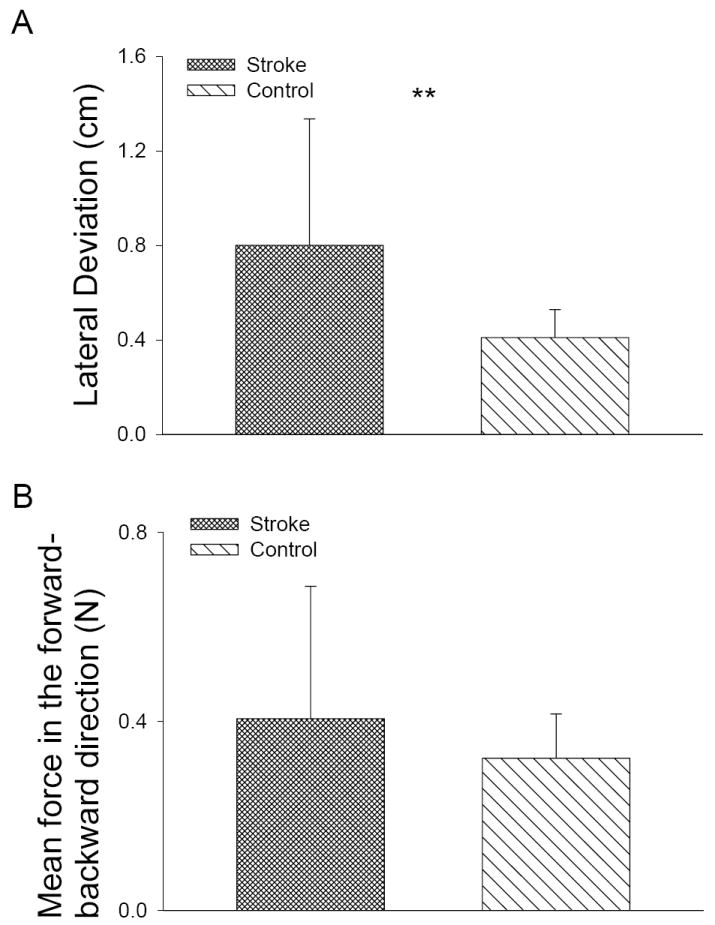
Performance difference during the reaching task. (A) Stroke subjects exhibited higher lateral deviation and poor movement trajectory maintenance ability compared with controls. (B) There is no significant difference in force during reaching.
Discussion
The most significant finding of the current study was the substantially reduced EEG-EMG coherence at a higher frequency range (gamma band, Figs. 2 and 4). Gamma oscillations from cortical areas are associated with cognitive functions, such as attention and memory (Engel et al., 2001; Herrmann & Demiralp, 2005). These gamma oscillations may reflect a feature-binding process to generate neural representations related to the stimulus or tasks (Herrmann & Demiralp, 2005). Gamma oscillations of cortical activities are also related to voluntary motor activities (Roelfsema et al., 1997). It is suggested that gamma band muscle activities are linearly correlated with focal activities in the contralateral motor cortex, which may be a fundamental feature of the motor system for organizing voluntary motor actions (Brown et al. 1998). The coherence in the gamma frequency band persisted during slow movements (Brown et al., 1998), which has been demonstrated by the control subjects in the current study. For stroke patients, Molnar et al. (1997) showed decreased EEG power at the gamma band in the parietal region (similar to the parietal area [Figs. 2 and 4] in our study). Similar observations of impaired EEG gamma oscillation rhythms were also reported following traumatic brain injury (Slewa-Younan et al., 2002). In stroke patients with damage in the contralateral cortical areas or their pathways along with reduced cortical gamma band activities (Molnar et al., 1997), it is reasonable to expect lower corticomuscular coherence within this frequency band.
However, our results did not show the power difference between patients and controls (Fig 3). Lower corticomuscular coherence could be contributed by lower power density in the frequency range or by weakened functional corticomuscular coupling. To make a complete, accurate reaching movement with the arm, complex neural commands in the brain must be transmitted to the working muscles and converted to muscle action. Such transmission should at least be partially reflected by the EMG signals and measured by coherence between the two variables (EEG-EMG). The reduced EEG-EMG coherence in stroke patients in our study seems to indicate impaired communication between the motor control centers in the brain and target muscles responsible for making the desired movement. This impaired coupling might arise from cortical changes related to the lesion or muscular changes after stroke (Gardiner 1996), although the later perhaps played a less significant role as the weaked coupling might primarily be caused by impaired information flow from the brain to muscle (Mima & Hallett, 1999).
Our results of corticomuscular coherence showed smaller differences in the beta frequency band (13~30 Hz) between the stroke and control groups than was shown in the gamma band. Coupling between the motor cortex and muscle activities during isometric muscle contractions in the beta band has been demonstrated by both magnetoencephalogram (MEG) and EEG scalp recordings in healthy subjects (Conway et al., 1995; Salenius et al., 1997; Brown et al., 1998; Mima & Hallett, 1999). It is not clear why coherence levels at the beta band did not differ between stroke patients vs. controls in this study as much as did coherence levels in the gamma band. One speculation is that the gamma band activities represent signal bindings and working memory-related activities (Herrmann & Demiralp, 2005) and thus are more likely to be related to cognitive activities associated with dynamic precision motor tasks such as reaching for a target. On the other hand, beta band activities might be more related to static isometric force output during motor tasks. For example, Omlora et al. (2007) observed that under the condition of isometric muscle contractions with static output force, significant corticomuscular coherence was confined to the beta-range; whereas in the isometric contractions with dynamic output force, the most distinct coherence occurred in the gamma-range and the coherence in the beta-range was reduced substantially. The authors concluded that during a dynamic force condition, the corticospinal oscillation mode of the sensorimotor system shifts towards higher (principally gamma) frequencies for the rapid integration of the visual and somatosensory information required to produce the appropriate motor command. Indeed, it has been suggested that gamma band synchronization is associated with dynamic formation of representations (Supp et al., 2007). And reduced gamma band synchronization has been observed in schizophrenia patients due to cognitive deficits such as reduced working memory performance; whereas in these patients, beta band activities were normal (Light et al., 2006). Because performing an accurate, targeted reaching movement would require more cognitive coordination activities than producing static isometric force, it is logical to expect that for motor impaired patients after stroke, we would observe a greater difference in the coherence level in the gamma band rather than the beta band. Our motor performance data somewhat confirms this possibility, since the coordination accuracy of reaching was poorer in the stroke patients, whereas the force output was similar between stroke and controls (Fig. 6)
Coherence values involving both the TB and the AD muscles were higher than coherence values of the BB muscle. This result is understandable in light of the fact that a typical reaching movement demands shoulder flexion and elbow extension. Therefore, the AD and TB were agonist muscles. As an elbow flexor, the BB was an antagonist muscle, used for maintaining appropriate joint stiffness and controlling or braking the speed of elbow extension, if needed. Since the motor task was a short-distance, accuracy-based reaching task, the BB might be needed only minimally for refining the smooth start of the movement (higher coherence at the beginning of the movement (Fig. 2, last two rows). Alternatively, the triarticulate BB muscle can also work as a weaker shoulder flexor. As such, it is reasonable to expect a lower coherence value for the BB compared with that of AD and TB muscles, which are the major shoulder flexor and elbow extensor, respectively. Interestingly, when the coherence was compared between the two groups, the between-group difference was greater for the EEG-biceps EMG pair than for the other EEG-muscle pairs (Fig. 5). Although the biceps was an antagonist with a lower level of activity, it could have played an important role in the movement coordination (Levin et al. 2000). Weakened EEG coherence with EMG of this muscle might be related to the reduced ability to coordinate the movement in stroke. For the AD muscle, the stroke patients exhibited no significant coherence with either parietal, central, or frontal areas in the higher-frequency band, and only minimal coherence in the lower-frequency band, sporadically across the motor task time period (Fig. 2, second line). In contrast, for the TB muscle, stroke patients exhibited the coherence with parietal, central, and frontal areas at 20-30 Hz for almost the entire motor task time (or 2/3 of the time, in the case of the frontal area; Fig. 2, fourth row). This finding may be an indication of attempted exclusive use of the TB muscle, to the exclusion of the AD muscle. Counter to these findings for stroke patients, the control subjects exhibited coherence of the AD muscle with all three cortical areas.
Our results did not show hemispheric differences in the coherence in the stroke patients and controls. Previous studies indicated a functional role of the ipsilateral hemisphere in motor control in poorly recovered stroke patients (Serrien 2004) and more focused activities in the contralateral sensorimotor area in well recovered patients (Mima 2001a). However, controversies regarding this issue exist and no direct evidence has been presented to indicate re-establishment of connections between the brain and muscles after stroke recovery. At the time of this study, the stroke patients were at different rehabilitation/recovery stages, which makes it difficult for a hemispheric-localization study. Volume conduction might have, to some extent, contributed to the bilateral cortical coupling with unilateral muscles. Further investigation is needed for a more complete understanding of the relationship between functional recovery and localized hemispheric activation.
In summary, poorly recovered stroke survivors with persistent upper-limb motor deficits exhibited significantly lower gamma-band corticomuscular coherence in performing a reach task using shoulder/elbow muscles. Their lower corticomuscular coherence could reflect poor brain-muscle communication or poor integration of the signals from the two sources during the process of the motor action. Poor EEG-EMG coherence could reflect an underlying mechanism that contributed to impaired reaching performance in the stroke patients.
Acknowledgments
This work was supported by the Department of Veterans Affairs (DVA), Office of Rehabilitation Research and Development, grants B2801R & B37091; DVA, Career Science Award B5080S; NIH grant HD050123, and the Risman Research and Development Fund at The Cleveland Clinic.
Footnotes
Publisher's Disclaimer: This is a PDF file of an unedited manuscript that has been accepted for publication. As a service to our customers we are providing this early version of the manuscript. The manuscript will undergo copyediting, typesetting, and review of the resulting proof before it is published in its final citable form. Please note that during the production process errors may be discovered which could affect the content, and all legal disclaimers that apply to the journal pertain.
References
- Akaike H. Autoregressive model fitting for control. Ann Inst Stat Math. 1971;23:163–180. [Google Scholar]
- Benjamini Y, Hochberg Y. Controlling the false discovery rate: a practical and powerful approach to multiple testing. Journal of the Royal Statistical Society Series B (Methodological) 1995;57(1):289–300. [Google Scholar]
- Benjamini Y, Yekutieli D. The control of the false discovery rate in multiple hypothesis testing under dependency. Ann Statistics. 2001;29(4):1165–1188. [Google Scholar]
- Braun C, Staudt M, Schmitt C, Preissl H, Birbaumer N, Gerloff C. Crossed cortico-spinal motor control after capsular stroke. Eur J Neurosci. 2007;25(9):2935–2945. doi: 10.1111/j.1460-9568.2007.05526.x. [DOI] [PubMed] [Google Scholar]
- Bressler S, Ding M, Yang W. Investigation of cooperative cortical dynamics by multivariate autoregressive modeling of event-related local field potentials. Neurocomputing. 1999;26(27):625–631. [Google Scholar]
- Brown P, Salenius S, Rothwell JC, Hari R. Cortical correlate of the Piper rhythm in humans. J Neurophysiol. 1998;80:2911–7. doi: 10.1152/jn.1998.80.6.2911. [DOI] [PubMed] [Google Scholar]
- Calautti C, Leroy F, Guincestre JY, Baron JC. Dynamics of motor network overactivation after striatocapsular stroke: a longitudinal PET study using a fixed-performance paradigm. Stroke. 2001a;32:2534–2542. doi: 10.1161/hs1101.097401. [DOI] [PubMed] [Google Scholar]
- Calautti C, Leroy F, Guincestre JY, Marie RM, Baron JC. Sequential activation brain mapping after subcortical stroke: changes in hemispheric balance and recovery. Neuroreport. 2001b;12:3883–3886. doi: 10.1097/00001756-200112210-00005. [DOI] [PubMed] [Google Scholar]
- Cao Y, D’Olhaberriague L, Vikingstad EM, Levine SR, Welch KM. Pilot study of functional MRI to assess cerebral activation of motor function after poststroke hemiparesis. Stroke. 1998;29:112–122. doi: 10.1161/01.str.29.1.112. [DOI] [PubMed] [Google Scholar]
- Conway BA, Halliday DM, Farmer SF, Shahani U, Maas P, Weir AI, Rosenberg JR. Synchronization between motor cortex and spinal motoneuronal pool during the performance of a maintained motor task in man. J Physiol. 1995;489:917–924. doi: 10.1113/jphysiol.1995.sp021104. [DOI] [PMC free article] [PubMed] [Google Scholar]
- Cramer SC, Nelles G, Benson RR, Kaplan JD, Parker RA, Kwong KK, Kennedy DN, Finklestein SP, Rosen BR. A functional MRI study of subjects recovered from hemiparetic stroke. Stroke. 1997;28:2518–2527. doi: 10.1161/01.str.28.12.2518. [DOI] [PubMed] [Google Scholar]
- Daly J, Fang Y, Perepezko E, Siemionow V, Yue GH. Prolonged cognitive planning time, elevated cognitive effort, and relationship to coordination and motor control following stroke. IEEE Trans Neural Syst and Rehab Eng. 2006;14(2):168–171. doi: 10.1109/TNSRE.2006.875554. [DOI] [PubMed] [Google Scholar]
- Eiselt M, Schindler J, Arnold M, Witte H, Zwiener U, Frenzel J. Functional interactions within the newborn brain investigated by adaptive coherence analysis of EEG. Neurophysiologie Clinique / Clinical Neurophysiology. 2001;31(2):104–113. doi: 10.1016/s0987-7053(01)00251-9. [DOI] [PubMed] [Google Scholar]
- Engel AK, Fries P, Singer W. Dynamic predictions: oscillations and synchrony in top-down processing. Nat Rev Neurosci. 2001;2:704–16. doi: 10.1038/35094565. [DOI] [PubMed] [Google Scholar]
- Gardiner R. The pathophysiology and clinical implications of neuromuscular changes following cerebrovascular accident. Aust J Physiother. 1996;42:139–147. doi: 10.1016/s0004-9514(14)60446-3. [DOI] [PubMed] [Google Scholar]
- Gerloff C, Bushara K, Sailer A, Wassermann EM, Chen R, Matsuoka T, Waldvogel D, Wittenberg GF, Ishii K, Cohen LG, Hallett M. Multimodal imaging of brain reorganization in motor areas of the contralesional hemisphere of well recovered patients after capsular stroke. Brain. 2006;129(3):791–808. doi: 10.1093/brain/awh713. [DOI] [PubMed] [Google Scholar]
- Ginter J, Blinowska KJ, Kaminski M, Durka PJ. Phase and amplitude analysis in time-frequency space-application to voluntary finger movement. J Neurosci Methods. 2001;110:113–124. doi: 10.1016/s0165-0270(01)00424-1. [DOI] [PubMed] [Google Scholar]
- Halliday DM, Conway BA, Farmer SF, Rosenberg JR. Using electroencephalography to study functional coupling between cortical activity and electromyograms during voluntary contractions in humans. Neurosci Lett. 1998;241:5–8. doi: 10.1016/s0304-3940(97)00964-6. [DOI] [PubMed] [Google Scholar]
- Herrmann CS, Demiralp T. Human EEG gamma oscillations in neuropsychiatric disorders (review) Clin Neurophysiol. 2005;116:2719–2733. doi: 10.1016/j.clinph.2005.07.007. [DOI] [PubMed] [Google Scholar]
- Jasper HH. The ten-twenty electrode system of the international federation. Electroencephalogr Clin Neurophysiol. 1958;10:371–375. [PubMed] [Google Scholar]
- Kilner JM, Baker SN, Salenius S, Jousmaki V, Hair R, Lemon RN. Task-dependent modulation of 15-30 Hz coherence between rectified EMGs from human hand and forearm muscles. J Physiol. 1999;516:559–570. doi: 10.1111/j.1469-7793.1999.0559v.x. [DOI] [PMC free article] [PubMed] [Google Scholar]
- Kilner JM, Baker SN, Salenius S, Hair R, Lemon RN. Human cortical muscle coherence is directly related to specific motor parameters. J Neurosci. 2000;20:8838–8845. doi: 10.1523/JNEUROSCI.20-23-08838.2000. [DOI] [PMC free article] [PubMed] [Google Scholar]
- Levin M, Selles R, Verheul M, Meijer O. Deficits in the coordination of agonist and antagonist muscles in stroke patients: implications for normal motor control. Brain Research. 2000;853:352–369. doi: 10.1016/s0006-8993(99)02298-2. [DOI] [PubMed] [Google Scholar]
- Light G, Hsu J, Hsieh M, Meyer-Gomes K, Sprock J, Swerdlow N, Braff D. Gamma Band Oscillations Reveal Neural Network Cortical Coherence Dysfunction in Schizophrenia Patients. Biol Psychiatr. 2006;60:1231–1240. doi: 10.1016/j.biopsych.2006.03.055. [DOI] [PubMed] [Google Scholar]
- Marshall RS, Perera GM, Lazar RM, Krakauer JW, Constantine RC, DeLaPaz RL. Evolution of cortical activation during recovery from corticospinal tract infarction. Stroke. 2000;31:656–661. doi: 10.1161/01.str.31.3.656. [DOI] [PubMed] [Google Scholar]
- Mima T, Hallett M. Corticomuscular coherence: a review. Clin Neurophysiol. 1999;16(6):501–511. doi: 10.1097/00004691-199911000-00002. [DOI] [PubMed] [Google Scholar]
- Mima T, Toma K, Koshy B, Hallett M. Coherence between cortical and muscular activities after subcortical stroke. Stroke. 2001a;32:2597–2601. doi: 10.1161/hs1101.098764. [DOI] [PubMed] [Google Scholar]
- Mima T, Matsuoka T, Hallett M. Information flow from the sensorimotor cortex to muscle in humans. Clin Neurophysiol. 2001b;112:122–126. doi: 10.1016/s1388-2457(00)00515-0. [DOI] [PubMed] [Google Scholar]
- Molnar M, Gacs G, Ujvari G, Skinner JE, Karmos G. Dimensional complexity of the EEG in subcortical stroke - a case study. Int J Psychophysiol. 1997;25:193–9. doi: 10.1016/s0167-8760(96)00739-8. [DOI] [PubMed] [Google Scholar]
- Murthy VN, Fetz EE. Effects of input synchrony on the response of a three-conductance cortical neuron model. Neural Comput. 1994;6:1111–1126. [Google Scholar]
- Nelles G, Spiekramann G, Jueptner M, Leonhardt G, Muller S, Gerhard H, Diener HC. Evolution of functional reorganization in hemiplegic stroke: a serial positron emission tomographic activation study. Ann Neurol. 1999;46:901–909. doi: 10.1002/1531-8249(199912)46:6<901::aid-ana13>3.0.co;2-7. [DOI] [PubMed] [Google Scholar]
- Omlora W, Patino L, Hepp-Reymond M, Kristeva R. Gamma-range corticomuscular coherence during dynamic force output. Neuroimage. 2007;34:1191–1198. doi: 10.1016/j.neuroimage.2006.10.018. [DOI] [PubMed] [Google Scholar]
- Roelfsema PR, Engel AK, Konig P, Singer W. Visuomotor integration is associated with zero time-lag synchronization among cortical areas. Nature. 1997;385:157–61. doi: 10.1038/385157a0. [DOI] [PubMed] [Google Scholar]
- Salenius S, Portin K, Kajola M, Salmelin R, Hair R. Cortical control of human motoneuron firing during isometric contraction. J Neurophysiol. 1997;77:3401–3405. doi: 10.1152/jn.1997.77.6.3401. [DOI] [PubMed] [Google Scholar]
- Schneider T, Neumaier A. Algorithm 808: ARfit - A Matlab package for the estimation of parameters and eigenmodes of multivariate autoregressive models. ACM Trans Math Softw. 2001;27:58–65. [Google Scholar]
- Schwarz G. Estimating the dimension of a model. Ann Stat. 1978;6:461–464. [Google Scholar]
- Seitz RJ, Hoflich P, Binkofski F, Tellmann L, Herzog H, Freund HJ. Role of the premotor cortex in recovery from middle cerebral artery infarction. Arch Neurol. 1998;55:1081–1088. doi: 10.1001/archneur.55.8.1081. [DOI] [PubMed] [Google Scholar]
- Serrien DJ, Strens LH, Cassidy MJ, Thompson AJ, Brown P. Functional significance of the ipsilateral hemisphere during movement of the affected hand after stroke. Exp Neurol. 2004 Dec;190(2):425–32. doi: 10.1016/j.expneurol.2004.08.004. [DOI] [PubMed] [Google Scholar]
- Shibata T, Suhara Y, Oga T, Ueki Y, Mima T, Ishii S. Application of multivariate autoregression modeling for analyzing the interaction between EEG and EMG in humans. International Congress Series. 2004;1270 C(3):249–253. [Google Scholar]
- Slewa-Younan S, Green AM, Baguley IJ, Felmingham KL, Haig AR, Gordon E. Is gamma (40 Hz) synchronous activity disturbed in patients with traumatic brain injury? Clin Neurophysiol. 2002;113:1640–6. doi: 10.1016/s1388-2457(02)00239-0. [DOI] [PubMed] [Google Scholar]
- Strens L, Asselman P, Pogosyan A, Loukas C, Thompson A, Brown P. Corticocortical coupling in chronic stroke: Its relevance to recovery. Neurol. 2004;63:475–484. doi: 10.1212/01.wnl.0000133010.69694.f8. [DOI] [PubMed] [Google Scholar]
- Supp G, Schlogl A, Trujillo-Barreto N, Muller M, Gruber T. Directed Cortical Information Flow during Human Object Recognition: Analyzing Induced EEG Gamma-Band Responses in Brain’s Source Space. PLoS One, August I. 2007 doi: 10.1371/journal.pone.0000684. http://www.plosone.org/article/fetchArticle.action?articleURI=info:doi/10.1371/journal.pone.0000684. [DOI] [PMC free article] [PubMed]
- Vallbo AB, Wessberg J. Organization of motor output in slow finger movements in man. J Physiol. 1993;469:673–691. doi: 10.1113/jphysiol.1993.sp019837. [DOI] [PMC free article] [PubMed] [Google Scholar]
- Wang X, Sun J, Gustafson KJ, Yue HG. Modeling Heterogeneity of Dependence for Analysis of Neuronal Data. Statistics in Medicine. doi: 10.1002/sim.2943. in press. [DOI] [PubMed] [Google Scholar]
- Weiller C, Ramsay SC, Wise R, Friston KJ, Frackowiak RSJ. Individual patterns of functional reorganization in the human cerebral cortex after capsular infarction. Ann Neurol. 1993;33:181–189. doi: 10.1002/ana.410330208. [DOI] [PubMed] [Google Scholar]
- Whitcher B, Craigmile P, Brown P. Time-varying spectral analysis in neurophysiological time series using Hilbert wavelet pairs. Signal Processing. 2005;85:2065–2081. [Google Scholar]
- Zwiers FW. The effect of serial correlation on statistical inferences made with resampling procedures. J Climate. 1990;3:1452–1461. [Google Scholar]


