

Abstract
Direct protein transfection is a potentially valuable tool for studying protein function in basic and clinical research. A major challenge is to enable a sufficiently large amount of protein to penetrate the plasma membrane of the transfected cells. Pep-1, a protein transfection reagent, was evaluated for its ability and efficiency in delivering proteins and antibodies into mouse Müller cells in vitro and in vivo. Pep-1 delivered active beta-galactosidase enzyme and antibodies (non-specific IgG and Cy3 conjugated anti-vimentin) into cultured Müller cells with high efficiency. Transfection efficiency increased with increasing concentration of the protein in the complex and with incubation time. Following intravitreal injection of Pep-1/IgG complexes in vivo, retinal histology was preserved and immunostaining showed that the antibodies were distributed widely across the retinal surface, with the most intense staining located near the retino-vitreal border. For complexes using non-specific IgG, double staining with anti-glutamine synthetase identified many IgG-positive cells as Müller glia. IgG immunoreactivity was also detected in the cytoplasm and occasionally in the nuclei of inner retinal neurons. Dark-adapted flash electroretinogram (ERG) recordings from injected eyes were nearly identical to ERG recordings from control eyes, suggesting that injection of Pep-1/IgG complex has minimal effects on retinal function. Therefore, Pep-1 is a useful tool for intracellular delivery of antibodies to study the role of proteins in living cells.
Introduction
Traditional methods for expressing proteins in living cells using gene transfer are often labor intensive, time consuming and can result in formation of inactive or even cytotoxic products (Washbourne and McAllister, 2002). Direct protein transfection eliminates the time required for transcription and translation associated with conventional DNA transfection, allowing for more immediate analysis of protein function. It offers a useful tool for studying protein function in living cells and for screening peptide drugs or therapeutic proteins. However, direct delivery of proteins into a large number of cells is typically limited by poor permeability and the potential for denaturation of active proteins during the process.
A number of peptides, termed cell-penetrating peptides (CPPs), or protein-transduction domains (PTDs), have been reported to have cell-penetrating properties. These include HIV-1 TAT domain (Fawell et al., 1994; Frankel and Pabo, 1988; Green and Loewenstein, 1988), the third helix of the homeodomain of Drosophila Antennapedia (Antp) (Derossi et al., 1994; Lindgren et al., 2000), the herpes-simplex-virus-1 NA-binding protein VP22 (Elliott and O’Hare, 1997; Phelan et al., 1998), as well as synthetic peptides such as transportan (Pooga et al., 1998), Pep-1 (Morris et al., 2001), YTA2 (Myrberg et al., 2007) and POD (Johnson et al., 2007). These methods have shown high transfection efficiencies in vitro and in vivo and have been used successfully in a variety of cell lines. However many of these methods suffer from some of the same limitations as gene transfection: the methods are labor-intensive and typically require crosslinking between peptides and cargos that can affect function. For Antp and transportan, the proteins or peptides have to be covalently linked to the PTD by chemical reactions (Pooga et al., 1998; Prochiantz, 1996). TAT is either attached directly to proteins by chemical crosslinking or by purifying TAT-containing fusion proteins from bacterial expression vectors. Bacterially expressed proteins lack post-translational modifications and may require denaturation of insoluble protein aggregates, two factors that could alter normal protein function (Nagahara et al., 1998; Schwarze et al., 1999). The VP22 approach is indirect, in that the target cells are transfected with an expression vector containing the cDNA coding for the protein fused to the C terminus of VP22 (Elliott and O’Hare, 1997).
In contrast to the PTDs and other CPPs, Pep-1 is a short, amphipathic peptide carrier that can deliver peptides and proteins into living cells in a biologically active form without the need for chemical crosslinking or construction of an expression vector (Morris et al., 2001). Commercially available as Chariot® (Active Motif, Carlsbad, CA, USA), Pep-1 forms a non-covalent complex with cargo proteins that stabilizes and protects them from degradation and facilitates their passage through the plasma membrane. Upon internalization, the complex dissociates, releasing the transfected peptides or proteins into the cytoplasm. Because Pep-1 delivery bypasses transcription and translation processes, the time from transfection to analysis can be as little as 2 hours (Morris et al., 2001), making Pep-1 an ideal tool for protein studies. The Pep-1 reagent has been used in vitro to deliver antibodies and enzymes into multiple cell types, including osteoblasts (Selim et al., 2003), pheochromocytoma (PC12) (Jiang et al., 2004), Madin-Darby canine kidney (MDCK) and human breast carcinoma MCF7 (Remacle et al., 2005). Pep-1 has also been used in vivo to deliver caspase-3 (Aoshiba et al., 2003) and cAMP-dependent protein kinase A (PKA) (Maron et al., 2005) into lung alveolar and bronchial epithelial cells via intra-tracheal injection and to deliver antibodies against Kir4.1 and Kir2.1 channels into rat retina via intraocular injection (Raz et al., 2007). Pep-1 protein fusion constructs have been used for intracellular delivery of a variety of proteins including: Grb7 into skin cells (An et al., 2007), pyridoxal-5′-phosphate phosphatase into PC12 cells (Lee et al., 2008) in vitro, SOD1 into neurons in the ischemic hippocampus (Cho et al., 2008) and botulinum neurotoxin and ribosomal protein S3 into dermal cells in vivo (Choi et al., 2006; Kim et al., 2006).
The delivery of biologically active proteins to the retinal tissue is of particular interest for studying their physiological and pathological functions in living cells, as well as in screening potential therapeutic proteins and peptides for ocular diseases. Several peptide delivery systems have recently been studied in ocular systems in vivo. Tat peptide-fluorophore conjugate was injected into vitreous of mouse and rat eyes and uptake by retinal cells was reported (Barnett et al., 2006; Schorderet et al., 2005). A recently developed peptide, POD, also showed high transfection capability into the retina via intravitreal and subretinal injections (Johnson et al., 2007). However, these studies focused on the temporal and topographic pattern of retinal uptake of the proteins, without evaluating the effects on retinal function following the protein transfection. Pep-1 is especially attractive as an in vivo protein or drug delivery vehicle for several reasons. First, it has shown no cytotoxicity in multiple cell lines. Second, the Pep-1 complex preparation process is simple and rapid and the noncovalent linkage avoids the need for crosslinking or denaturation. Finally, it is commercially available at a relatively low cost. Although Pep-1 has been reported to deliver antibodies into rat eyes (Raz et al., 2007), there are no reports describing the use of Pep-1 to deliver proteins into mouse eyes.
The purpose of the present study was to investigate the use of Pep-1 for delivering biologically active proteins and antibodies into mouse Müller glial cells both in vitro and in vivo. As part of the analysis, we also developed a computer program to quantify the distribution of antibodies delivered into the retina in vivo using Pep-1. Retinal function was evaluated via dark-adapted electroretinogram (ERG) recordings after intravitreal injection of Pep-1/antibody complexes in vivo.
Methods
Preparation of Pep-1 protein complexes
For in vitro experiment, 2 μl of Pep-1 stock suspension (Active Motif, Carlsbad, CA, USA) was dissolved in 48 μl ddH2O and subsequently mixed with 50 μl of PBS containing β-galactosidase enzyme (β-gal) or antibodies (Table 1). The concentration ranges for β-gal and IgG were based on the manufacturer’s recommendations. The Pep-1/protein mixture was incubated at room temperature for 30 min to allow the Pep-1/macromolecule complex to form before it was added to the cultured cells.
Table 1.
Concentrations of Transfected Proteins and Pep-1: Protein Molar Ratios Used in Transfections.
| Protein | Protein | Pep-1: Protein | Application |
|---|---|---|---|
| (product #; Source) | (μg) | molar ratio | |
| β-gal | 0.5 | 334.2:1 | in vitro |
| (# 30025; Active Motif, Carlsbad CA) | 1.0 | 167.1:1 | in vitro |
|
| |||
| IgG (from rabbit) | 5.75 | 34.5:1 | in vitro |
| (# I5006; Sigma-Aldrich, St. Louis, MO.) | 11.5 | 17.1:1 | in vitro |
| 23 | 8.5:1 | in vitro; in vivo | |
| 46 | 4.3:1 | in vivo | |
|
| |||
| Anti-vimetin-Cy3 (from mouse) | 10 | 19.6:1 | in vitro |
| (# C9080; Sigma-Aldrich, St Louis MO) | |||
For in vivo experiments, 2 μl of Pep-1 stock suspension was dissolved in 8 μl ddH2O, and mixed with 10 μl of PBS containing rabbit IgG antibodies to generate the Pep-1/IgG complex (Table 1). After 30 min incubation at room temperature, Pep-1/antibody complexes were collected in a 2 μl Hamilton microsyringe (Hamilton Company, Reno, NV, USA) fitted with a glass pipette needle.
Cell culture and transfection process
Mouse Müller glia cells (hereafter called Müller cells) were seeded at 1 × 10⁵ cells per well in 24-well dishes coated with poly-D-lysine/laminin for β-gal and IgG transfections and on uncoated 24-well dishes for anti-vimentin-Cy3 transfections. Cell were grown to 80% confluence in Neurobasal, B27, 20mM L-glutamine, 2% Fetal Bovine Serum containing 50 U/ml Interferon gamma (Peprotech) at 33°C with 6% CO2. This is a conditionally immortalized cell line that was generated from Müller cells isolated from the retinas of postnatal day 10, heterozygous Immortomouse® mice (Charles River Laboratories, Wilmington, MA, USA) that carry a temperature sensitive, interferon gamma inducible SV40 large T antigen transgene (SV40 tsA58 TAg) (Jat et al., 1991; Otteson et al., 2006). A detailed characterization of the Müller cell line will be published separately. Unless otherwise indicated, all culture media components were from Invitrogen.
The 100 μl protein/Pep-1 complexes were added to cells in serum-free medium, incubated for 1 hr at 33°C, then overlaid with an additional 200 μl complete medium followed by 1–3 hrs incubation, extending the manufacturer’s recommendations of a 1–2 hr incubation time. Negative control samples were treated with Pep-1 only (no protein) or with β-gal or IgG only (no Pep-1). Each experiment was repeated at least twice. For analysis of transfections at 4°C, cells were washed twice in ice-cold PBS prior to addition of the complex [β-gal (1 μg/well) or Cy3 conjugated anti-vimentin antibodies (10 μg/well)], which was overlaid with ice-cold, serum-free medium. Cells were incubated at 4°C for 1 hr in serum-free medium prior to addition of ice-cold complete (serum-containing) medium and then incubated for an additional 2–3 hrs at 4°C.
For post-transfection trypsinization, cells were washed with PBS at either 33°C or 4°C, photographed (see below) and then trypsinized (0.05% Trypsin/EDTA; Invitrogen) for 10 minutes at 33°C. Following addition of an equal volume of ice cold serum containing medium, cells were pelleted at 2000 rpm in a microfuge (4°C for 5 minutes), resuspended in culture medium and transferred to clean wells of a 24-well dish prior to imaging.
β-gal histochemistry
After the medium was aspirated, cells were washed with PBS, fixed with 0.5% glutaraldehyde for 5–10 mins, and washed twice with PBS prior to incubation in the staining solution (PBS containing 4 mM potassium ferricyanide, 4 mM potassium ferrocyanide, 2 mM magnesium chloride, and 20 mg/ml X-gal) for 1 hr at room temperature. For analysis of uptake of β-gal at 4°C, the cells were incubated in the staining solution for 1 week before imaging. After the staining solution was removed, cells were washed and digital images were captured using an Olympus XI71 inverted microscope equipped with an Olympus DP71 digital camera. Cells were counted in 5 fields (approximately 20 cells in each field) in each of 2 wells per condition for each experiment, and scored as stained or unstained based on the presence of the blue β-gal precipitate. Delivery efficiency for each condition was calculated as the percent of β-gal positive cells.
Antibody detection in vitro
To detect Pep-1 delivered IgG, cells were fixed with 4% paraformaldehyde for 15 mins, washed with PBS and incubated in a solution containing 10% normal goat serum, 5% bovine serum albumin, 1% fish gelatin, and 0.5% Triton X-100 in PBS (blocker) for 1 hr at room temperature to block non-specific binding of the secondary antibody. After blocker was removed, cells were incubated in goat anti-rabbit secondary antibody conjugated to Alexa 488 (Molecular Probes, Eugene, OR) diluted 1: 400 in the blocker for 1 hr at room temperature. Then the cells were rinsed with PBS containing 0.5% Triton X-100 three times followed by PBS alone three times. Negative control samples were processed in parallel omitting the secondary antibody.
Cells transfected with Cy3 conjugated anti-vimentin antibodies were photographed both before and after trypsinization without fixation. Nuclei were counterstained with 1 μg/ml Hoechst 33342 (Molecular Probes, Eugene, OR) for 10 min prior to observation. For double staining, transfected cells were first imaged, then washed with PBS, fixed for 15 minutes in 4% paraformaldehyde, washed in PBS with 0.5% Triton X-100, blocked in PBS with 20% normal donkey serum and 0.5% Triton X-100 for 2 hours prior to application of goat anti-vimentin antibodies (Sigma Aldrich; St. Louis MO), diluted 1:50 in PBS, 2% normal donkey serum, 0.1% Triton X-100 and overnight incubation at 4°C. After washing, donkey-anti-goat secondary antibodies conjugated to FITC, diluted 1:1000 in the same diluent as primary antibodies, were applied, and incubated at room temperature for 2 hours. Cells were washed extensively in PBS+0.1% Triton X-100 followed by PBS alone and coverslipped using ProLong Gold (Invitrogen; Carlesbad, CA).
Images were captured at a fixed exposure time using a Rolera CCD camera (Q-imaging; Surrey, BC, Canada) mounted on an Olympus XI71 microscope, imported into Photoshop 6.0 and pseudocolored green for Alexa 488 or FITC labeling, red for Cy3 and blue for nuclei. Adjustment of brightness and contrast were performed simultaneously on all images in each photo montage.
Intravitreal injections
All experimental and animal care procedures followed the ARVO Statement for the Use of Animals in Ophthalmic and Vision Research. Protocols for in vivo experiments were reviewed and approved by the University of Houston Institutional Animal Care and Use Committee. C57BL/6 mice (n= 29, both genders, between 3 and 10 months of age (Simonsen Lab, Gilroy, CA, USA) were anesthetized with an IP injection of ketamine (70 mg/kg, Vedco, Inc., St Joseph, MO, USA) and xylazine (7 mg/kg, Vedco). The Pep-1/IgG complex was prepared as described above (Table 1) and collected in a 2 μl Hamilton microsyringe. Under a dissecting microscope (10×), a small hole was punctured in one eye just behind the limbus using a 30 gauge needle. Then 1 μl of the complex containing 0, 1.15 μg or 2.3 μg of IgG/μl was injected into the vitreous via a glass pipette needle (tip diameter ~ 20 μm) fixed onto the microsyringe, introduced into the globe through the hole. The glass needle was fixed to the microsyringe using glue (Raldite 2043; Huntsman Advanced Materials America, Inc; Los Angeles, CA) 12–18 hours before the experiments. This ensured that the glue would be cured, and not volatile and potentially toxic. Optimal results were obtained when the microsyringe was filled with the complex less than 30 min, but no more than 60 minutes, before it was injected.
ERG recording and analysis
ERGs were recorded from Pep-1/IgG injected eyes and control (non-injected) contralateral eyes as described previously (Saszik et al., 2002b) (n= 5 of the 29 mice injected intravitreally). Briefly, C57/BL6 mice were dark-adapted overnight before injection and recording. They were anesthetized initially with an IP injection of ketamine (70 mg/kg) and xylazine (7 mg/kg) with anesthesia maintained with subcutaneous injection of ketamine (70 mg/kg) and xylazine (5 mg/kg every 20–25 minutes). The pupils were dilated to ~3 mm diameter with topical atropine, phenylephrine and tropicamade. DTL (Dawson et al., 1979) fibers were placed under a clear contact lens for the stimulated eye and a black contact lens for the reference eye. ERGs were recorded differentially between the two eyes.
The ganzfeld flash visual stimulus was produced by rear illumination of a translucent white diffuser (15 mm diameter). The illumination was provided by blue light from a series of light-emitting diodes (LEDs; λmax= 462 nm); or by white light from a small xenon flash tube. Stimulation energy was altered by changing the LEDs and/or duration of current pulses delivered to LEDs (64 μs to 4.1 ms) or xenon tube (8–128 μs) for higher stimulus energies. Lights were calibrated (expressed in sc cd/m2) with a scotopically corrected photometer (IL1700, International Light, USA). For the LEDs, the luminance was proportional to the pulse duration that delivered to LEDs, so it was only necessary to determine the luminance per unit time to calculate the luminance energy of any flash. For the xenon flash, stimulus energies were measured directly using the integrating mode of the photometer (Robson et al., 2003). The flashes were assumed to start at the half-way point of their duration. Scotopic retinal illuminance (scotopic troland sec; sc td. s) was calculated based on a 3 mm pupil diameter (Saszik et al., 2002b). Illuminance energy ranged from −6.0 to 3.5 log sc td. s. Responses to the brief full field flashes were recorded and digitized at 1000 Hz. The intervals between flashes were adjusted so that the response returned to baseline before another stimulus was presented. Low amplitude responses such as the scotopic threshold response (STR) were averaged over many trials (40–60) and higher amplitude responses, over fewer trials (10–20). A digital 60 Hz notch filter was applied offline. The post-injection ERG recording was monitored every 20 min until it stabilized, up to a maximum post-injection time of 3 hr, based on the results from the in vitro experiments.
Response amplitudes were measured at three fixed times after the stimulus flash, near peaks of standard ERG waves: the a-wave (6 ms after the flash); the b-wave (110 ms after the flash) and the positive STR and sensitive response (pSTR/SR, hereafter referenced as pSTR only), and the negative STR (nSTR) (at 200 ms).
Tissue processing and immunohistochemistry of injected eyes
Following ERG recordings, anesthetized mice were euthanized with an IP injection of sodium pentobarbital (100 mg/kg) and eyes were processed for immunohistochemistry. Both eyes were excised from the head, and the corneas and lens were removed. The eyecups were fixed in 4% paraformaldehyde in cacodylate buffer solution at room temperature for 30 minutes. After rinsing with PBS, eyecups were cryoprotected in 30% sucrose in PBS for at least 24 hrs, embedded in OCT (Tissue-Tek, Elkhart, IN) and flash frozen in liquid nitrogen. Retinal blocks were stored at −80°C prior to sectioning at 12 μm thickness on a OTF cryostat (Hacker, Winnsboro, SC) and sections were mounted on gelatin-coated slides.
Immunolabeling was performed on frozen sections using immunofluorescent method as previously described (Sherry et al., 2003). Sections were thawed, rinsed with Nano-pure water, treated with 1% NaBH4 for 2 mins and rinsed with Nano-pure water and PBS. After incubation in blocker for 2 hours at room temperature, sections were incubated with primary antibodies for 2 days at 4°C. To identify the cell types, the following primary antibodies were used: mouse anti-glutamine synthetase (GS; Chemicon, Temecula, CA) at 1:400; mouse anti-Brn3a (Chemicon, Temecula, CA) at 1:50. After sections were washed with PBS and incubated in blocker for 30 minutes, secondary antibodies were applied for 1 hr at room temperature. The following secondary antibodies were used: Alexa 488- conjugated goat anti-rabbit IgG antibody (1:400) to detect the transfected rabbit IgG in retina, and Cy3- conjugated goat anti-mouse IgG antibody (1:400; Jackson ImmunoResearch Lab, West Grove, PA) to detect the mouse primary antibodies applied. The two secondary antibodies were applied simultaneously; negative control slides containing sections from paraformaldehyde fixed, uninjected control retinas were processed in parallel using Alexa 488-secondary antibodies only (no non-specific IgG).
After PBS and Nano-water rinses, sections were coverslipped in Vectashield mounting medium containing DAPI (Vector Lab Inc; Burlingame, CA) and photographed using a Rolera CCD camera (Q-imaging, Surrey, BC, Canada) camera mounted on an Olympus XI71 inverted microscope. The staining quantification of the transfected IgG in retina was analyzed with Image-pro (Media Cybernetics Inc; Silver Spring, MD) and in-house developed software programmed using MATLAB (The Mathworks; Natick, MA).
Additional images were taken using Leica SP2 confocal microscope. Before sections were coverslipped, they were incubated in 20 μM Draq5 (Alexis; San Diego, CA) to counterstain nuclei. Scans of the different wavelengths were performed sequentially. Corresponding images from each fluorescent channel were superimposed, and brightness and contrast were adjusted in Adobe Photoshop 6.0.
Quantification of IgG distribution in injected eyes
For each eye, 4 radial sections of the retina were selected for analysis: 2 sections located approximately 60 μm apart that each contained the optic nerve and 2 sections that were located approximately 120 μm to either side of the optic nerve. Each section was imaged at low magnification (4×) to generate a montage of overlapping images across the entire retinal length. In addition, three representative areas in each section were imaged at higher magnification (20×): two fields at opposite sides of the retina each located ~800 μm away from the ora serrata, and one field in the central retina.
To determine which pixels were stained, we calculated a threshold value based on the background intensity of the retinal staining for each image by calculating the mean pixel intensity of the entire retinal area between the inner limiting membrane (ILM) and outer limiting membrane (OLM) in the montages or high magnification images. Because fluorescent staining is seen as an increase in image intensity, the threshold was defined as the mean intensity of the measured retina area plus two standard deviations. Pixels with intensity above the threshold were designated as positively stained.
Staining extension index (SEI)
To examine the extent to which the Pep-1/IgG complex spread across the retina, we developed a metric termed the Surface Extension Index (SEI). We defined this index as the fraction of all points along the inner retinal surface that had at least one positively stained pixel located no more than 20 microns perpendicular to the retinal surface. We selected 20 μm because this distance comprised the Müller cell endfeet, nerve fiber layer and ganglion cell layer (GCL) where the most intense staining was observed. To obtain the SEI, we used Image-pro software to create a montage of 4× images that spanned the entire length of the retina section (n=13 eyes from 11 mice; 4 sections per eye). The image was imported into MATLAB and the inner retinal border was coarsely marked manually (Fig. 1, red markers). These coarse points were then fit using a cubic spline function in MATLAB to obtain a line that followed the curvature of the retinal surface (Fig. 1, blue curve). The software generated a series of 20 micron long lines drawn perpendicular to the spline surface (illustrated by the yellow circles) with the spacing between the perpendicular lines adjusted by the software to maximize the number of pixels analyzed and to minimize overlap. If one or more pixels along the line had an intensity greater than the threshold value (see threshold calculation above), that point on the spline was scored as positive for staining, thereby creating a maximum intensity projection along the retinal surface. Although a limited number of points are illustrated in Figure 1, the actual method scored the maximum intensity projection for every pixel of the surface spline across the entire retinal length in each montage at a resolution of 3.3 μm per pixel. For each section, the number of the surface pixels that had at least one positively stained pixel along its perpendicular line was divided by the total number of pixels on the spline to generate the SEI,
Figure 1. Demonstration of the Surface Extension Index (SEI).

(A, B, C) Representative photomicrographs of retinal regions with variable IgG staining following transfection. The red dots represent coarse points made manually. The blue line marks the inner retinal border that is generated by the spline function of MATLAB. The yellow line was drawn 20 μm from the surface line to mark the inner boundary of the region for analysis. The yellow circles illustrate pixels along the sampling line drawn perpendicular to the surface line. Scatter plots (A′, B′, C′) shows the intensity profile of the pixels illustrated in A, B, C. Each column shows the pixels on a single perpendicular line. The blue circles represent the pixels along the surface line marked as blue in A, B and C. The dashed line is the mean pixel intensity of the entire retinal area between the inner limiting membrane and outer limiting membrane and the red line represents the threshold (mean + 2 SD). The maximum intensity of each column (maximum intensity projection) was used to calculate SEI. For comparison the surface percent (s-proportion), the proportion of the surface pixels (along the blue line) that were over threshold was also calculated. (A) SEI=0.97, s-proportion=0.33. (B) SEI=0.64, s-proportion=0.09. (C) SEI= 0.18, s-proportion=0.06. Scale bar = 10 μm.
SEI = the number of the surface pixels with their maximum projection above threshold/the number of the pixels of the surface border line
Depth index (DI)
To examine the extent to which the complex had penetrated the retina, we defined a Depth Index (DI). The depth of staining was calculated for each field (3 fields per section; 4 sections per eye) as the distance from the retino-vitreal surface to the single deepest point of positive IgG staining with an intensity above threshold, divided by total retinal thickness at the point being evaluated.
DI = depth of staining/total retinal thickness
Statistics
Comparison between various treatment groups in the β-gal experiment was performed by a three-way ANOVA. Differences in IgG staining were examined for significance using the Kolmogorov-Smirnov Test between the peripheral and central retina areas. Repeated ANOVA was used to compare ERG amplitudes from the contralateral, uninjected control eyes and the eyes following intravitreal injection of Pep-1/IgG complex using Supernova. A probability of p <0.05 was taken as a benchmark for significant differences.
Results
Active β-gal enzyme delivered into mouse Müller cells using Pep-1
The efficiency of Pep-1 transfection was first examined in vitro by analyzing histochemical staining of cultured mouse Müller cells that were transfected with β-gal. Histochemistry yielded blue precipitates in transfected Müller cells demonstrating successful delivery of active β-gal enzyme (Fig. 2). Pep-1 showed high transfection efficiency, with 80% to 92% of the cells containing active β-gal (Table 2), although the intensity of β-gal staining varied among cells. Transfection efficiency, judged by percentage of positively stained cells, increased with longer incubation time (three-way ANOVA, p=0.002) and with β-gal concentration (three-way ANOVA, p=0.042). A three hour incubation yielded the highest efficiency: 88.5% for 0.5 μg/well and 93.0% for 1 μg/well concentrations. Within any single incubation duration, increasing the concentration of β-gal in the complex increased the percentage of positive cells. The blue β-gal precipitate was not present in negative control cells treated with only Pep-1 (Fig. 2G) or β-gal enzyme (data not shown). As we achieved high efficiency using the initial concentrations and incubation times, we did not extend our analysis to include additional concentrations or incubation periods.
Figure 2. Histochemistry of β-gal delivered into mouse Müller cells, showing representative blue β-gal staining.

(A–C) 0.5 μg β-gal/well, incubated for 1 hr, 2 hrs and 3 hrs and (D–F) 1 μg β-gal/well, incubated for 1 hr, 2 hrs and 3 hrs. (G) The control sample (con) with only Pep-1 without β-gal did not contain any blue reaction product. (H) Pep-1 mediated β-gal delivery (1 μg/well) at 4 °C, incubated for 3 hrs. Scale bar = 100 μm.
Table 2.
Effect of incubation time and concentration on β-gal transfection efficiency in vitro
| Percent β-gal Positive Cells | ||
|---|---|---|
| Incubation Time | Protein Concentration/well | |
| 0.5 μg | 1.0 μg | |
| 1 hr | 80.7% | 85.8% |
| 2 hr | 84.4% | 90.6% |
| 3 hr | 88.5% | 92.7% |
Intracellular delivery of non-specific rabbit IgG into mouse Müller cells using Pep-1
The ability of Pep-1 to deliver antibodies in vitro was examined by transfecting non-specific rabbit IgG into cultured Müller cells. Immunoreactivity was detected in the Müller cells transfected with Pep-1/IgG complex, whereas no immunoreactivity was observed in the control samples (Pep-1/without IgG, IgG/without Pep-1 [Fig. 3J, K]). IgG staining did not appear to be localized to any specific organelle, but was distributed within the cells. For a single incubation time, fluorescence intensity of IgG immunostaining in the Müller cells varied directly with the concentration of IgG in the Pep-1/IgG complex. In our experiments, a 2–3 hr incubation time using 11.5 μg–23 μg/well of IgG (17:1 and 8.5:1 Pep-1 to IgG molar ratios) showed highest efficiencies for IgG transfection into Müller cells in vitro.
Figure 3. Immunostaining of non-specific rabbit IgG delivery to Müller cells in vitro.

Representative images of cells transfected with 5.75, 11.5 and 23.0 μg IgG/well and incubated for (A–C) 1 hr; (D–F) 2 hrs and (G-I) 3 hrs. Intensity of staining increased with antibody concentration and incubation time. There was no immunofluorescence in the control samples that were transfected with (J) 2 μl/well Pep-1 without IgG and (K) 23.0 μg IgG/well without Pep-1 that were processed for immunostaining in parallel. Scale bar = 50 μm. Images are pseudocolored green for IgG labeling and blue for Hoechst staining of nuclei.
In the β-gal and IgG experiments, the staining was not homogeneously distributed throughout the cytoplasm, but instead appeared to be in particles or aggregates. Because the localization of proteins delivered by cell penetrating peptides can be altered by the fixation process (Richard et al, 2003), we repeated the experiment using Cy3-conjugated antibodies against the cytoskeletal protein vimentin and examined the distribution of the Pep-1 delivered antibodies without fixation. The pattern of fluorescence in unfixed cell showed a generally punctate distribution similar to what had been observed with the IgG antibodies (Fig 4A). Subsequent fixation followed by immunostaining using a different anti-vimetin antibody (generated in goat) and anti-goat FITC-tagged secondary antibodies was used to look for co-localization of the two antibodies. There was a distinct linear pattern to the mouse anti-vimetin-Cy-3 fluorescence that overlapped the goat anti-vimentin (FITC) in portions of the cytoskeleton, although the strong punctate pattern observed with the Pep-1 delivered Cy3-tagged antibodies was not replicated using the second anti-vimentin antibody (Fig. 5A–C). In control cells transfected using Pep-1 without antibodies, we did note that the pattern of immunostaining using the Cy3-conjugated, mouse anti-vimentin antibody tended to show a more granular pattern on fixed cells (Fig. 5D), compared to the more filamentous pattern detected using the goat anti-vimentin antibody (Fig. 5E).
Figure 4. Photomicrographs of unfixed cells showing delivery of Cy3 conjugated antibodies into Müller cells by Pep-1 in vitro.

(A – D) Cells transfected with 10 μg anti-vimetin-Cy3 (20:1 Pep-1 to protein ratio) and incubated at 33°C during transfection and photographed after 3 hours (E- H) Cells transfected with 10 μg anti-vimetin-Cy3 (20:1 Pep-1 to protein ratio) and incubated at 4°C during transfection and photographed after 3 hours; (C, D) Cells from sample A, B photographed after a 10 minute trypsin digestion; (G, H) Cells from sample E, F photographed after a 10 minute trypsin digestion retain Cy3 fluorescence.
Fig. 5. Vimentin immunostaining of transfected Müller cells.

(A–C) Cells transfected with mouse anti-vimentin (10 μg per well; 20:1 Pep-1 to protein ratio) at 4°C for 3 hours were paraformaldehyde fixed and processed for immunohistochemistry using goat anti-vimentin antibodies and anti-goat FITC conjugated secondary antibodies. (A) Cy3 anti-vimentin in transfected cells shows punctate distribution with a linear or fibrillar organization (red); (B) immunohistochemistry with anti-vimentin (green) antibodies reveals vimentin cytoskeleton; (C) composite image showing co-localization (yellow). Arrows indicate representative sites of co-localization. Arrowheads show sites where only immuno-staining of vimentin, not Pep-1 delivered anti-vimetin (Cy3) is visible (D-F) Control cells mock-transfected using Pep-1 without anti-vimetin-Cy3 were processed in parallel at 4°C, paraformaldehyde fixed and processed for immunohistochemistry using Cy3-congugated mouse anti-vimentin and goat anti-vimentin antibodies. (D) Immunostaining with Cy3-anti-vimentin (red); (E) immunostaining with goat anti-vimentin (green); (F) composite image showing co-localization (yellow) showing vimentin cytoskeleton in untransfected cells. Scale bar = 100 microns in all panels.
To determine whether the non-uniform distribution of the Cy3 fluorescence was the result of protein aggregates on the cell surface, rather than intracellular delivery of the proteins, transfected cells were subjected to trypsin digestion. After extensive washing and transfer of the cells to fresh wells, some of the most intensely fluorescent, particulate staining was eliminated, but considerable fluorescence persisted in the cells (Fig 4, C, G). Following trypsinization, the punctate pattern of fluorescence persisted. These observations are consistent with the Pep-1 delivered antibodies being located inside the cells and rather than on the cell surface.
The punctate pattern of the β-gal histochemical staining and the IgG and Cy3 conjugated anti-vimentin antibodies was similar to the pattern observed in cells transfected with antibodies against the endosomal protein, Lamp 1 (Morris et al., 2001). To determine whether the punctate patterns we observed reflected endocytic uptake of the Pep-1/protein complexes, additional cells were transfected with either β-gal or Cy3-conjugated anti-vimentin antibodies with all incubation and washes at done at 4°C to block endocytosis. For β-gal, incubation at 4°C did not block uptake, but did result in a more homogeneous distribution of the staining when cells were fixed and processed for β-gal histochemistry (Fig. 2H). We did find that a longer staining time was required for histochemical detection of the β-gal activity. Likewise for the Cy3 conjugated antibodies, incubation at 4°C did not block the uptake (Fig. 4E,G; Fig 5A–C) and the punctate pattern of Cy3 fluorescence was similar to cells that were incubated at 33°C (Fig. 4A, C). As we observed at higher temperatures, trypsinization did not eliminate the punctate pattern in the cells transfected at 4°C, consistent with an intracellular location of the antibodies (Fig. 4G).
Intraocular delivery of IgG into the mouse retina using Pep-1
For optimization of intraocular delivery of Pep-1/IgG, we analyzed a total of 25 eyes from 18 animals following injection with the Pep-1/IgG complex. An additional 13 eyes from 11 animals were used for final quantitative analysis. In our initial experiments, we observed no IgG immunoreactivity in retinal cells in eyes where leaking was observed at the injection site (n=1) or when the complex has been loaded into the syringe more than one hour prior to injection (n=5).
We also tested the effects of using DMSO as a solvent and of varying the concentration by diluting Pep-1 reagent in 3 μl, 6 μl and 8 μl DMSO. Following injection of 1μl and 2–3 hrs of incubation, four of seven eyes showed some IgG staining (data not shown). However, DMSO did not increase the efficiency of the uptake of the complex by the retina compared to PBS. Given its potential toxicity, we did not to use DMSO in subsequent analysis.
Increasing the concentration of IgG from 23 to 46 μg in the complex (resulting in a final delivery of 2.3 μg of IgG in the vitreous) did not efficiently increase the IgG staining in the retina at 3 hrs post-injection. From the results of our pilot experiment, we obtained the most consistent results using 2 μl Pep-1 mixed with 23 μg IgG in 10 μl PBS (8.5:1, Pep-1 to IgG molar ratio), with 1 μl of the complex injected into vitreous immediately following a 30 min incubation for complex formation. This resulted in a final administration of 1.15 μg of IgG in the vitreous per injection. Based on a vitreous volume of 20 μl in the mouse (Saszik et al., 2002b), we calculated that the final concentration of IgG in the vitreous was 57.5 ng/μl, equivalent to the 11.5 μg/well used in the in vitro IgG experiments (Fig. 3). All eyes were analyzed (for ERG and/or immunohistochemistry) within 3 hrs of injection. Using the optimized conditions, the IgG staining was readily visible and the results were consistent between animals across multiple injection days (n=13 eyes from 11 animals).
At 3 hrs post injection, the retinal histology and the distribution of the Pep-1-delivered rabbit IgG was examined in radial cryosections of the retina using anti-rabbit IgG secondary antibodies conjugated to Alexa 488 (Fig. 6). In all eyes, retinal lamination and gross histology was well preserved. The IgG immunostaining extended across the entire retinal surface with the most intense staining located near the retino-vitreal border, along the ILM. IgG staining was also detected in some individual cells and cellular processes in other retinal layers, and was occasionally present as far as the outer plexiform layer (OPL) (Fig. 6B, C), and rarely in the ONL. Diffuse staining was also present in both the inner plexiform layer (IPL) and outer plexiform layer (OPL).
Figure 6. Photomicrographs of immunohistochemical staining of Pep-1/IgG injected eye.

A representative retinal section located 120 microns from the optic nerve head illustrates the sampling methods used for the quantitative analysis of IgG distribution in IgG/Pep-1 injected eyes. The original epifluorescent images were inverted for illustration purposes. (A) Montage of 4× images showing a mouse retinal section labeled with secondary antibody to illustrate the distribution of the Pep-1 delivered IgG; spread extension index (SEI)=1.0; see Fig. 1 for SEI) (B–D) Higher magnification of the three boxed areas in (A) where the DI was measured. The strongest IgG labeling is located immediately adjacent to the vitreal surface, with additional, scattered sites of IgG immunostaining near the IPL (D) and OPL (B, C). The intensity of the diffuse IgG immunostaining in both the IPL and OPL was not above threshold and did not contribute to the calculation of the DI. In B–D, the shorter arrow indicates the depth of the deepest point over the threshold in this field (marked by the short perpendicular line); the longer arrow indicates the total retinal thickness. The scale of the DI is shown on the right side of panel B. The calculated DI for the images shown are (B) 0.62; (C) 0.59; (D) 0.13. Scale bar: (A) 200 μm; (B–D) 50 μm. GCL, ganglion cell layer; IPL, inner plexiform layer; INL, inner nuclear layer; OPL, outer plexiform layer; ONL, outer nuclear layer; IS, inner segments of photoreceptors.
To quantify the distribution of protein delivery across the surface of the retina, we developed a computer-assisted analysis method to calculate a Surface Extension Index (SEI) from digital images of the retina (see Methods). To evaluate the robustness of this metric, we tested it on a series of images from our pilot studies that showed variable staining across the retinal surface. We found that the SEI calculated for each image correlated well with the proportion of the retinal surface that was stained (Fig. 1). Therefore, we generated montages of digital images of the retinal sections and calculated the SEI across the entire retinal length (4 sections per eye, 13 eyes from a total of 11 animals). Across all the eyes, the mean SEI was 0.895 ± 0.07, consistent with our qualitative observations that the IgG staining was uniformly distributed across the retinal surface (Figs. 6, 7A).
Figure 7. SEIs and DIs following intravitreal injection of Pep-1/IgG complex.

(A) SEI of each eye (mean ± SD). Brackets [ ] indicate that data was collected from two eyes from the same animal. (B) Histogram of the DI distribution for all fields analyzed in peripheral retina (2 fields per section, 4 sections per eye); (C) Histogram of the DI distribution for central retina (1 field per section, 4 sections per eye). R, right eye; L, left eye.
In all eyes, the majority of the IgG immunoreactivity was located within 20 μm of the vitreal surface of the retina. However in all sections analyzed, there were also small localized sites of strong IgG immunoreactivity present deeper in the retina. To evaluate the depth that the Pep-1/IgG complex was able to penetrate into the retina, we measured the absolute distance of the single deepest point of IgG staining that was above threshold in three fields from each of 4 retinal sections for each eye (Fig. 6). The diffuse staining present in the IPL and OPL (Fig. 6) was consistently below threshold and was not included in the analysis. It should be noted that our objective was to examine the limits of penetration of the IgG into the retina following intravitreal injection of the IgG/Pep-1 complex. Therefore, the absolute depth measurements and Depth Index (DI) metric are not intended to indicate the relative proportions of staining within the different retinal layers. The mean maximum depth from the vitreal surface that IgG staining could be detected was 79.3 ± 5.4 μm in the peripheral and 108.5 ± 8.6 μm in the central retina. This difference in the absolute depth of IgG staining between peripheral and central retina most likely reflects the regional differences in retinal thickness that, in our samples, ranged on average, from 213.3 ± 3.4 μm the periphery to 254.7 ± 5.6 μm in the central retina, in good agreement with previous studies (Ruggeri et al., 2007; Schmucker and Schaeffel, 2004).
To enable comparisons between peripheral and central retina, we developed a DI metric (see Methods) that expressed the maximal depth of penetration (as measured above) as a proportion of the total retinal thickness. The mean DI for the peripheral and central retina was 0.365 ± 0.040 and 0.425 ± 0.053 respectively. Plotting the frequency of the DI for all fields analyzed in both the peripheral and central retina revealed a bimodal distribution (Fig. 7B, C), with one cluster located below 0.2 and the other peaking between 0.5 and 0.7. In both the peripheral and central retina, a DI of 0.2 corresponds to the GCL and the innermost portion of the IPL, while a DI of 0.5–0.7 corresponds to the OPL and adjacent portions of the ONL and INL (Fig. 6). The cumulative frequency of DI below 0.2 was 42.9% and 26.9% for peripheral and central retina respectively, whereas the cumulative frequency of DI of 0.5 to 0.7 is 36.2% and 44.2% for peripheral and central retinas respectively (Fig. 7B; C). The differences in the DI between the center and periphery of the retina were not statistically significant (Kolmogorov-Smirnov Test, p=0.11).
Immunohistochemical labeling of retinal sections following intravitreal injection
The characteristics of IgG staining were investigated more thoroughly with images obtained using confocal microscopy. Although the intensity of IgG staining varied among animals, the staining pattern was similar in all injected eyes (see Figs. 8 and 9). The typical staining pattern showed strong fluorescence for IgG near the vitreal surface across ILM and in GCL, with some staining in IPL, inner nuclear layer (INL) and a light band in the OPL that is more obvious in Fig. 8 than in Fig. 9. IgG staining along the vitreal surface of the retina showed two patterns: in many retinal sections there was prominent staining in Müller cell processes, with a distinct, unlabeled zone surrounding nuclei of cells in the ganglion cell layer (arrows in Fig. 9A–C′). In other instances, the IgG immunoreactivity was contiguous with the nuclei and appeared to be in the somas of cells in the GCL (arrowheads in Figs. 8 and 9). To determine which cell types contained the IgG following intraocular injection of the IgG/Pep-1 complexes, we did double immunostaining for IgG and cell-specific markers. Immunolabeling for glutamine synthetase (GS) showed the distribution of Müller cells across the retina (Fig. 8B, E). At the ILM and in the GCL, there was distinct co-localization of IgG and GS immunolabeling identifying these cells as Müller cells (arrows in Fig. 8). The IgG immunoreactivity that was in the soma of cells in the GCL did not colocalize with GS indicating that these were not Müller cells (arrowheads in Fig. 8). To identify these cells, we did double staining using antibodies against IgG and Brn3a, a transcription factor specifically expressed by a subset of retinal ganglion cells. In some cells, IgG staining was found immediately adjacent to the Brn3a immunostained ganglion cell nuclei, which we interpreted to reflect the presence of the Pep-1-delivered IgG in the cytoplasm of retinal ganglion cells (arrow heads in Fig. 9D–E′), in addition to the Müller cells (arrows in Fig. 9). IgG staining also was found immediately adjacent to some nuclei in the GCL (unfilled arrowheads) that were not Brn3a positive, but were most likely Brn3a-negative ganglion cells or displaced amacrine cells. In the composite images, occasional nuclei appeared purple reflecting co-localization of IgG (red) and DRAQ5 (blue) staining (Fig. 9D–E′). The same pattern of co-localization was present in single optic sections within the stack. Therefore, this does not appear to be an artifact of stacking multiple images, but rather shows the presence of transfected IgG in some nuclei. Fluorescence observed in the retinal sections of eyes injected with Pep-1/IgG was not a non-specific artifact of secondary antibody, as there was no observed fluorescence in retinal sections from control eyes that were processed in parallel using only the anti-rabbit secondary antibody (Fig. 9G–I).
Figure 8. Double labeling for IgG and glutamine synthetase (GS), a Müller cell marker, in transfected retinas.

(A–C′) and (D–F′) were retinal sections from 2 different animals. (A, D) IgG staining. IgG labeling was mostly present close to the vitreal surface. Scattered clusters of IgG labeling were present in the IPL. There was a low level of diffuse IgG fluorescence in OPL. In (D), labeling for IgG was also present in a few cells (←) in the IPL and some blood vessels in the OPL (>). (B, E) GS staining. (C, F) shows the overlay of IgG, GS and nuclei stained with DRAQ 5 (blue). (A′–C′, D′–F′) Higher magnification showing the areas within rectangles in (AC) and (D-F) respectively. Labeling for IgG co-localized with GS staining in ILM and GCL (arrow), indicating IgG was present in the endfeet of Müller cells. In addition, labeling for IgG was found in the cytoplasm surrounding the nuclei some GS negative cells in GCL (arrow head). ILM, inner limiting membrane; GCL, ganglion cell layer; IPL, inner plexiform layer; INL, inner nuclear layer; OPL, outer plexiform layer; ONL, outer nuclear layer. Scale bar = 20 μm.
Figure 9. Double labeling for IgG and Brn3a, a ganglion cell marker in transfected retinas.

(A–C′) and (D–F′) were from two different retinas; (G-I) were from uninjected control retina. (A, D) IgG staining was intense across the ILM at the vitreal surface. (B, E, H) Labeling for Brn3a showed variable intensity among ganglion cells. Cross-reactivity of anti-mouse secondary antibody to blood vessels is present in INL and OPL. (C, F, I) Overlay of IgG, Brn3a and nuclei stained with DRAQ 5 (blue). (A′–C′, D′–F′) Higher magnification showing the areas within rectangles in (A–C) and (D–F) respectively. (A–C′) Müller cell processes stained for IgG label (arrows) extend through the GCL leaving a distinct clear zone around the green Brn3a+ ganglion cells in GCL. (D′–F′) Labeling for IgG was also present in the GCL, appearing as rings surrounding the Brn3a+ nuclei (arrowhead), consistent with the presence of IgG in the somas of ganglion cells. Labeling for IgG also surrounded some Brn3a-negative nuclei (unfilled arrowhead), that were other types of ganglion cells, or displaced amacrine cells. Occasional cells showed IgG staining in the nuclei, appearing purple in the composite image (*). (G) Control sections from uninjected eye processed in parallel showed no immunofluorescence for the Alexa-488 conjugated anti-rabbit IgG. ILM, inner limiting membrane; GCL, ganglion cell layer; IPL, inner plexiform layer; INL, inner nuclear layer; OPL, outer plexiform layer; ONL, outer nuclear layer. Scale bar = 20 μm.
Dark-adapted ERG responses of Pep-1/IgG injected eyes
To test the effects of Pep-1/IgG transfection on retinal function, we measured the ERG from the contralateral control (uninjected) eyes and the eyes after intravitreal injection of the Pep-1/IgG complexes (n= 5). The black traces in Fig. 10 show typical control ERGs recorded in one representative animal. For the weakest stimuli, the negative scotopic threshold response (nSTR) from inner retina dominated the ERG (Saszik et al., 2002b). Preceding the nSTR, there was a positive sensitive wave, or combination of waves, nominally the pSTR also of inner retinal origin that saturates when the positive response amplitude reaches about 100 μV (Saszik et al., 2002b). The pSTR and nSTR had their peak amplitudes at ~110 ms and ~200 ms, respectively. With increasing stimulus energies, the positive components grow to become the b-wave (Granit’s PII) which is generated by On-(rod-driven) bipolar cells in the scotopic ERG (Robson and Frishman, 1995; Robson et al., 2004). For the strongest stimuli, negative-going a-waves, reflecting photoreceptor currents (Hood and Birch, 1990; Jamison et al., 2001; Robson et al., 2003), appeared before the rise of the b-waves.
Figure 10. Dark-adapted ERG response post-intravitreal injection.

ERG responses to flashes of increasing stimulus energy from non-injected contralateral eye (black) and the experimental eyes post-intraocular injection of Pep-1/IgG complexes (red). The responses following injection were generally similar to those in the control eye.
The red traces show the ERG responses following intravitreal injection of Pep-1/IgG complexes (Fig. 10). Qualitatively, there was little effect of the injection and transfection on the overall ERG. The nSTR was slightly smaller, while the pSTR was more similar compared with the control eye. For the highest energy stimuli, the maximum amplitude of a-wave was similar, and atypically, in this example, the b-wave was slightly lower in the injected versus control eye. To analyze these data quantitatively for any significant changes following injection, we examined the relationship between stimulus energy and ERG amplitudes measured at fixed times following the stimulus flash for five animals. The a-wave amplitudes measured at 6 ms were similar between the control and post-injection eyes (repeated ANOVA, p=0.627) across the range of energies tested (Fig. 11A). Similarly, there were no significant differences in the amplitudes of the pSTR or the b-wave between control (uninjected contralateral eye) and post-injection eyes (repeated ANOVA, p=0.653, p=0.329 respectively) (Fig. 11B). The nSTR amplitudes after intraocular injection were significantly smaller than in the contralateral control (uninjected) eyes (repeated ANOVA, p=0.05), but the reduction was small, maximally about 25 percent (Fig. 11C).
Figure 11. Stimulus-response functions in pre- and post-injection eyes.
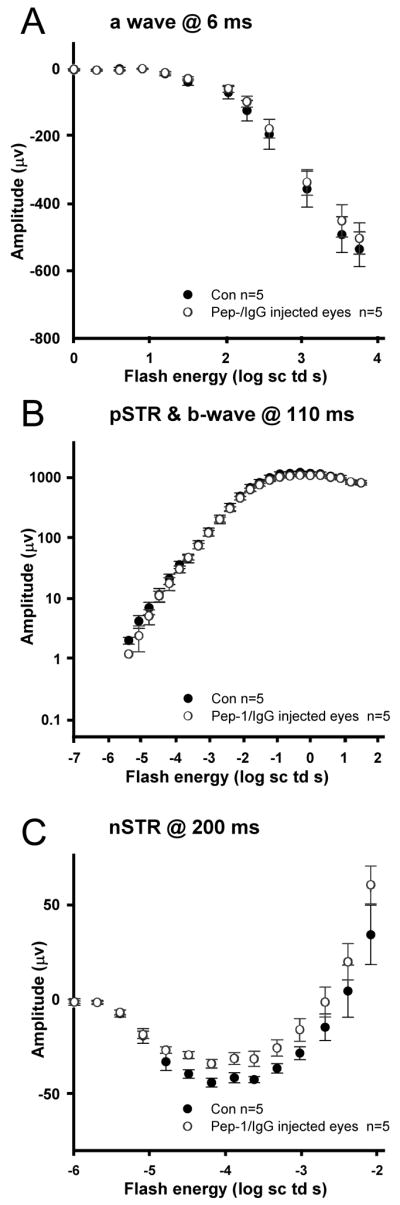
(A) a-wave amplitudes (group mean ± S.E.M, n=5) for Pep-1/IgG injected eyes (open circles) measured at 6 ms after the stimulus, compared to control (black circles). (B) b-wave and pSTR amplitudes measured at 110 ms. (C) nSTR amplitudes measured at 200 ms.
Discussion
In this study, we evaluated the efficacy of Pep-1 in delivering full-length proteins into retinal cells in vitro and in vivo. We were successful in transporting active β-gal enzyme, non-specific rabbit IgG and Cy-3 conjugated anti-vimetin antibodies into mouse Müller glia cells in vitro, and IgG into Müller glia in vivo with high efficiency. Histochemical detection of Pep-1 delivered β-gal confirmed that Pep-1 did not affect enzymatic activities of β-gal during the transfection procedure, consistent with previous reports (Aoshiba et al., 2003; Morris et al., 2001). Successful intracellular delivery of β-gal and anti-vimentin antibodies at 4°C is consistent with previous reports that Pep-1 transfection is primarily mediated by physical peptide-membrane interactions, not through the endocytic pathway (Deshayes et al., 2004; Henriques and Castanho, 2004, 2008; Henriques et al., 2005; Morris et al., 2001). With both β-gal and the Cy3 conjugated antibodies, there appeared to be a reduction in uptake of the Pep-1 complexes at 4°C, as longer staining times were required for the β-gal histochemistry and the distribution of the β-gal staining was distinctly more homogeneous in cells transfected at 4°C. Similarly, the overall intensity of the fluorescence was frequently reduced in cells transfected with the anti-vimentin Cy3 at 4°C compared to 33°C. This suggests the possibility that while endocytosis is not necessary for uptake of Pep-1/protein complexes, there may be some uptake via the endocytic pathway by Müller glia at physiological temperatures. Müller glia are highly phagocytic cells in vitro (Mano and Puro, 1990) and therefore may have a greater propensity for endocytic uptake of particles than other cell lines that have previously been used for Pep-1-mediated transfections.
In unfixed cultured Müller glia transfected with Cy3-conjugated anti-vimentin antibodies at 33°C, nearly all cells showed punctate fluorescence (Figs. 4), although occasional cells showed a more filamentous pattern of staining more typical of the vimentin cytoskeleton. Following fixation and immunostaining with a second anti-vimentin antibody, much of the punctate staining appeared to be aligned with the vimetin cytoskeleton. The punctate pattern of fluorescence differs from the pattern of fluorescence observed after delivery of FITC-conjugated antibodies against β-actin (Morris et al., 2001) which revealed the entire structure of the actin cytoskeleton, but did not show any punctate distribution. Analysis of intracellular movements of vimentin using vimentin-GFP fusion proteins in living cells has shown that vimentin is present in discrete, dot-like structures that are enriched in the perinuclear region and that move within the cell along the actin cytoskeleton (Prahlad et al., 1998). Intracellular injections of antibodies against vimentin (Kouklis et al., 1992; Lieber and Evans, 1996) or keratin, another component of the cytoskeleton (Klymkowsky et al., 1983), disrupt the cytoskeleton resulting in punctate staining patterns remarkably similar to what we observed. However, cells analyzed in the microinjection studies were fixed prior to immunostaining and detection, whereas in our study, use of the Cy3-conjugated antibodies permitted imaging without fixation. Although fixation could have altered the subcellular localization of the vimentin/antibody complexes following microinjection, we observed minimal change in the overall distribution of Pep-1 delivered Cy3-anti-vimentin following fixation. Therefore, the punctate pattern in transfected Müller cells in our studies is likely to reflect, at least in part, aggregates of vimentin and antibodies within the cell. The fact that these aggregates did not stain with the goat anti-vimentin antibodies in fixed cells could reflect recognition of distinct epitopes by the two antibodies, saturation of the epitopes by the initial binding of the Cy3-conjugated anti-vimentin antibodies or changes in protein distribution or immunoreactivity that occurs with fixation.
To our knowledge, the current study represents the first quantification of the delivery efficiency and assessment of retinal function after using a protein delivery reagent in vivo to transport an antibody into the mouse retina via intravitreal injection. Our finding that the microinjection of the Pep-1/antibody complexes had minimal effect on retinal function lays the foundation for future studies of retinal function following Pep-1 delivery of proteins and blocking antibodies into the retina. For example, as part of a larger study of the role of potassium channels in retinal function, we have found that in vivo delivery using Pep-1 of antibodies against Kir4.1, a potassium channel present in Müller glia, results in alterations of specific waveforms of the scotopic ERG (M. Wang, L. Frishman unpublished results). Raz et al., (2007) using intravitreal injections of Pep-1/antibody complexes in rats have reported specific effects on the photopic ERG of that species.
Problems and considerations for optimization of in vivo applications
To extend these studies to different proteins or antibodies, the optimum concentrations and ratios of Pep-1 and the cargo will need to be determined for each protein. Because Pep-1 interacts with cargo via hydrophobic interactions, the unique hydrophobicity and size of each protein or antibody can affect complex formation (Morris et al., 2001). The molar ratio of Pep-1 and the cargo has been shown to have a direct influence on the size of the complex and can affect the efficiency of transfection (Munoz-Morris et al., 2007). In our in vivo studies, the Pep-1/IgG molar ratio used was 8.5:1. This is lower than the optimal ratio recommended in previous studies for generating Pep-1: protein complexes for transfection of cultured cells (Munoz-Morris et al., 2007). However, in our in vitro studies, a relatively wide range of Pep-1 to protein molar ratios was effective in transfecting Müller cells.
Previous reports have indicated that Pep-1 is effective for proteins across a range of sizes. Small proteins including the 30 kDa green fluorescent protein (GFP), a 51-mer peptide derived from human Cdc25C dual-specificity phosphatase, a 32-mer peptide derived from HIV-1 reverse transcriptase, as well as larger proteins such as antibodies (e.g. anti-LAMP 1; monoclonal anti-β-actin) have been delivered into living cells using Pep-1 reagent (Morris et al., 2001). The flexibility in both the size of the cargo and the range of ratios for preparing the Pep-1: protein complexes will facilitate the optimization the system for different proteins.
We found that a 2–3 hr incubation time was sufficient to transfect IgG protein into Müller cells in vivo. This is a much shorter interval than previously reported for another transfection reagent, POD, where maximal uptake of a large molecule [B-POD with streptavidin-coated quantum dots (QDPOD)] was seen after a 20 hr incubation period (Johnson et al., 2007). In our experiment, 1.15 μg of IgG per injection resulted in high transfection efficiency and increasing the amount of IgG did not dramatically increase the efficiency. As the volume of the mouse vitreous is approximately 20 μl, an injection volume greater than 1 to 1.5 μl is not recommended because it would elevate intraocular pressure, thereby causing ischemia.
Timing of the complex delivery into tissue is another consideration. In our experiments, the Pep-1/protein solution was incubated for 30 min for initial complex formation, as recommended by manufacturer. Maintaining a short interval between complex formation and application is important, since long delays could increase the risk of aggregate formation, especially when large numbers of samples are processed. For in vitro experiments, the interval between this initial 30 min incubation and when the complex was actually applied to the cells was minimal. For in vivo experiments, anesthetizing and stabilization of animals, as well as positioning the injection apparatus takes time. Therefore the interval from when the complex is loaded into a microsyringe until it is injected into the vitreous can be somewhat variable. In our experiments, when the Pep-1/protein complexes were held in the syringe for excessively long intervals (>1 hr), the overall efficiency of intracellular delivery was reduced. We obtained optimal results when we injected the Pep-1/protein complex into the vitreous within 30 minutes of loading the complex into the syringe.
Quantitative analysis methods: surface extension index (SEI) and depth index (DI)
To evaluate the distribution of IgG following injection, we quantified the staining using two metrics that we developed: the SEI and DI. As the staining of IgG was not continuous along the retinal surface, we found that if only the surface pixels were counted as a measurement of the spread of IgG across the retina, it resulted in a value that was much lower than what was seen qualitatively. To address this problem, we developed the SEI, which is essentially a maximum intensity projection along the retinal surface. We found that the SEI more accurately measured the spread than simply assessing the intensity of points along a single line across the retinal surface. We found that intraocular injection of 1 μl of complex was sufficient to transfect cells across 90% of the retinal surface, similar to the results of POD mediated-delivery of small molecules (Johnson et al., 2007).
The absolute depth of IgG staining was less in the peripheral retina than the central area indicating that the IgG complex can penetrate the central retina more readily than the periphery. However, if the penetration of the IgG was based on diffusion of the complex, the absolute depth of penetration should be similar across the retina. To examine the relationship between depth of penetration and the overall retinal structure/organization across the retina, we developed a relative DI. Despite the differences in absolute depth of penetration, the DI of peripheral and central area was similar, suggesting that the penetration may depend more on the retinal structure than on simple diffusion across the retina. Though DI varied across a wide extent, more than 70% of the values fell in two ranges, below 0.2 corresponding to the GCL and the innermost portion of the IPL, and between 0.5–0.7 corresponding to the OPL and adjacent portions of the ONL and INL. In interpreting the DI, it should again be noted that the majority of staining in all retinas analyzed was located within approximately 20 microns of the vitreoretinal surface. Additional staining in retinal layers other than the GCL was limited to a relatively small number of sites. This is consistent with what has been reported using other peptide delivery systems, such as Tat and POD, where the uptake of protein was mostly observed in GCL, to a lesser extent in IPL and INL (Barnett et al., 2006; Johnson et al., 2007; Schorderet et al., 2005). In addition, we observed a diffuse, low level of immunoreactivity in both the IPL and OPL.
Cellular specificity in vivo
One question of particular interest is whether the Pep-1/antibody complex can penetrate the inner limiting membrane of the retina. Particle sizes generated using Pep-1 and p27kip1 protein (27 kDa) have been reported to range from approximately 50 nm to 850 nm (when prepared at 5:1 and 50:1 molar ration of Pep-1 to cargo ratio) with the optimal size recommended for transfection around 150–200 nm (at 10:1 to 20:1 molar ratios) (Munoz-Morris et al., 2007). The inner limiting membrane allows the transport of molecules up to the size of 400 kDa (Mitra, 2003) and nanoparticles of 140 nm diameter can penetrate past the inner limiting membrane and reach the INL following intravitreal injection in rats in vivo (Bourges et al., 2003). The ILM also permits passage of antibodies in vivo, as the antibody-containing drug Bevacizumab has been detected in the ILM, GCL and IPL of normal cynomolgus monkeys within 24 hours of intraocular injection (Heiduschka et al., 2007). Given the presence of immunoreactivity extending beyond the retinal surface following intravitreal injection, the ILM does not appear to be a major barrier to retinal penetration by Pep-1/protein complexes in vivo.
Immunohistochemical analysis with confocal microscopy showed that following intravitreal injection, the Pep-1 delivered IgG was most consistently located in the Müller cells. IgG could be detected in the endfeet of Müller cells close to vitreous and in the lateral processes around cells in GCL. Staining in the OPL may have been related to processes of Müller cells as well, although we were unable to confirm this with the GS staining, because GS staining in the Müller glial processes within the OPL is sparse. Our double immunostaining showed that the Müller glia and retinal ganglion cells were successfully transfected using this method in vivo. However, we cannot exclude the real possibility that at least some of the immunoreactivity located along the vitreal surface reflected Pep-1 delivery of antibodies to the retinal astrocytes.
Following intravitreal injection of Pep-1 complexes, IgG immunoreactivity was also found in some inner retinal neurons including ganglion cells. In these cells, staining was primarily located in the cytoplasm, although occasional amacrine or ganglion cells also showed some IgG immunoreactivity in the nucleus. This was a surprising observation as IgG is a non-specific antibody that should not recognize any specific epitope within the cell. However, Pep-1 contains a nuclear localization signal from the SV40 T (simian virus 40) antigen (KKKRKV) within the peptide and can enter the nucleus when not complexed with proteins (Morris et al., 2001). Autoimmune diseases such a lupus erythematosus are characterized by high titers of antibodies against nuclear proteins or DNA that can enter and accumulate in the nucleus of living cells (e.g. Weisbart et al., 2000). Therefore, it is not unexpected that the IgG could, on occasion, enter the nucleus of a transfected cell, possibly in association with Pep-1 itself or through non-specific interactions with endogenous cellular proteins that contain nuclear localization signals.
In contrast to the multiple cell types that were transfected using Pep-1, Tat peptide-fluorophore conjugates were selectively taken up by ganglion cells and a subset cells in INL in rat (Barnett et al., 2006) and mouse (Schorderet et al., 2005). Intraocular delivery of Lissamine-conjugated POD showed a pattern similar to the Tat conjugates (Johnson et al., 2007). The basis for the variation in cellular specificity of Pep-1 and these other transfection reagents and the detailed mechanisms of differential cellular uptake using the different peptide delivery systems remain unclear. However, it could be useful for targeting different cell populations in the inner retina.
As the penetration of IgG delivered via intravitreal injection did not extend through the entire thickness of the retina, varying the delivery route could potentially allow targeting of different subsets of cells. A subretinal injection would be more likely to target cells in the outer retina, including photoreceptors. Immunostaining was observed in outer nuclear layer (ONL), INL, GCL and Müller cells following subretinal injection of D-TAT FITC (Schorderet et al., 2005), but it was limited to the portion of the retina near the injection site. Likewise, when injected subretinally, POD mediated lissamine delivery revealed significant transduction in photoreceptor cell bodies, inner segments, INL and ganglion cells, as well as retinal pigmented epithelial cells (Johnson et al., 2007).
Retinal function after intravitreal injection of Pep-1/IgG complex
To investigate whether delivery of Pep-1 complexes into the retina affects retinal function, we compared dark-adapted ERGs from the contralateral uninjected control and post-intravitreal injection eyes. Following the injection of Pep-1/IgG complexes, the maximum amplitudes of the photoreceptor-driven a-wave, the bipolar cell generated b-wave and pSTR of inner retina origin were similar to amplitudes in the control eyes. The nSTR, also of inner retina origin, was about 25% smaller than in the control eyes. In rodents, the pSTR relies on ganglion cell integrity, as it is almost absent when there is ganglion cell loss following optic nerve section (Bui and Fortune, 2004; Saszik et al., 2002a; Saszik et al., 2002b). There is evidence from in vivo studies in cat retina that the nSTR reflects K+ currents in Müller cells (Frishman and Steinberg, 1989) that are generated as a consequence of K+ release from depolarizing amacrine or ganglion cells. The subtle decrease of the nSTR amplitude in our study may be a mild injection effect that slightly disturbed the function of the inner retinal cells that generate this response. However, it is a small reduction and therefore should not compromise the ability to assess retinal function using the ERG following Pep-1 delivery of proteins to the retina.
Applications
Pep-1 offers an effective new tool for delivering antibodies into Müller cells in vitro and, more importantly, it can deliver proteins into retinal cells in vivo with minimal compromise of retinal function when injected intravitreally. The ability to deliver antibodies into Müller and ganglion cells could be useful for studying retinal function by transfecting antibodies to block specific ion channels that are located prominently in the endfeet of Müller cells (Raz et al., 2007). The efficacy of this system in mice will also allow it to be applied in genetic models to facilitate the direct study of the role of specific proteins on retinal function. The Pep-1 system could potentially be used for protein delivery directly into photoreceptors via subretinal injections, or cornea endothelial cells or the trabecular meshwork via anterior chamber injections. These have the potential to provide novel approaches for the delivery of protein-based therapies for diseases such as retinitis pigmentosa, corneal dystrophies or glaucoma.
Acknowledgments
We wish to thank Dr. Harold E. Bedell for his assistance on data analysis; Dr. Scott Stevenson and Girish Kumar for assistance on programming the software using MATLAB; and Dr. Dorit Raz for valuable discussions. Supporting Grant: NIH grants R01 EY06671 (LJF), P30 EY07551 (UHCO) and UHCO Vision Research Summer Grant (MW). Portions of this work has been previously published in abstract form (Wang et al., 2007).
Footnotes
Publisher's Disclaimer: This is a PDF file of an unedited manuscript that has been accepted for publication. As a service to our customers we are providing this early version of the manuscript. The manuscript will undergo copyediting, typesetting, and review of the resulting proof before it is published in its final citable form. Please note that during the production process errors may be discovered which could affect the content, and all legal disclaimers that apply to the journal pertain.
Contributor Information
Minhua H. Wang, College of Optometry, University of Houston, 4901 Calhoun, 505 JD Armistead Bldg, Houston, TX 77204-2020, Tel: 713-743-0747, Email: mwang.2006@alumni.opt.uh.edu
Laura J. Frishman, College of Optometry, University of Houston, 4901 Calhoun, 505 JD Armistead Bldg, Houston, TX 77204-2020, Tel: 713-743-1972 Fax: 713-743-2595, Email: lfrishman@optometry.uh.edu
Deborah C. Otteson, College of Optometry, University of Houston, 4901 Calhoun, 505 JD Armistead Bldg, Houston, TX 77204-2020, Tel: 713-743-1952 Fax: 713-743-2053, Email: dotteson@optometry.uh.edu
References
- An JJ, Kim SY, Lee SH, Kim DW, Ryu HJ, Yeo SI, Jang SH, Kwon HJ, Kim TY, Lee SC, Poo H, Cho SW, Lee KS, Park J, Eum WS, Choi SY. Transduced PEP-1-Grb7 fusion protein suppressed LPS-induced COX-2 expression. J Biochem Mol Biol. 2007;40:189–95. doi: 10.5483/bmbrep.2007.40.2.189. [DOI] [PubMed] [Google Scholar]
- Aoshiba K, Yokohori N, Nagai A. Alveolar wall apoptosis causes lung destruction and emphysematous changes. Am J Respir Cell Mol Biol. 2003;28:555–62. doi: 10.1165/rcmb.2002-0090OC. [DOI] [PubMed] [Google Scholar]
- Barnett EM, Elangovan B, Bullok KE, Piwnica-Worms D. Selective cell uptake of modified Tat peptide-fluorophore conjugates in rat retina in ex vivo and in vivo models. Invest Ophthalmol Vis Sci. 2006;47:2589–95. doi: 10.1167/iovs.05-1470. [DOI] [PubMed] [Google Scholar]
- Bourges JL, Gautier SE, Delie F, Bejjani RA, Jeanny JC, Gurny R, BenEzra D, Behar-Cohen FF. Ocular drug delivery targeting the retina and retinal pigment epithelium using polylactide nanoparticles. Invest Ophthalmol Vis Sci. 2003;44:3562–9. doi: 10.1167/iovs.02-1068. [DOI] [PubMed] [Google Scholar]
- Bui BV, Fortune B. Ganglion cell contributions to the rat full-field electroretinogram. J Physiol. 2004;555:153–73. doi: 10.1113/jphysiol.2003.052738. [DOI] [PMC free article] [PubMed] [Google Scholar]
- Cho JH, Hwang IK, Yoo KY, Kim SY, Kim DW, Kwon YG, Choi SY, Won MH. Effective delivery of Pep-1-cargo protein into ischemic neurons and long-term neuroprotection of Pep-1-SOD1 against ischemic injury in the gerbil hippocampus. Neurochem Int. 2008;52:659–68. doi: 10.1016/j.neuint.2007.08.013. [DOI] [PubMed] [Google Scholar]
- Choi SH, Kim SY, An JJ, Lee SH, Kim DW, Ryu HJ, Lee NI, Yeo SI, Jang SH, Won MH, Kang TC, Kwon HJ, Cho SW, Kim J, Lee KS, Park J, Eum WS, Choi SY. Human PEP-1-ribosomal protein S3 protects against UV-induced skin cell death. FEBS Lett. 2006;580:6755–62. doi: 10.1016/j.febslet.2006.11.038. [DOI] [PubMed] [Google Scholar]
- Dawson WW, Trick GL, Litzkow CA. Improved electrode for electroretinography. Invest Ophthalmol Vis Sci. 1979;18:988–91. [PubMed] [Google Scholar]
- Derossi D, Joliot AH, Chassaing G, Prochiantz A. The third helix of the Antennapedia homeodomain translocates through biological membranes. J Biol Chem. 1994;269:10444–50. [PubMed] [Google Scholar]
- Deshayes S, Heitz A, Morris MC, Charnet P, Divita G, Heitz F. Insight into the mechanism of internalization of the cell-penetrating carrier peptide Pep-1 through conformational analysis. Biochemistry. 2004;43:1449–57. doi: 10.1021/bi035682s. [DOI] [PubMed] [Google Scholar]
- Elliott G, O’Hare P. Intercellular trafficking and protein delivery by a herpesvirus structural protein. Cell. 1997;88:223–33. doi: 10.1016/s0092-8674(00)81843-7. [DOI] [PubMed] [Google Scholar]
- Fawell S, Seery J, Daikh Y, Moore C, Chen LL, Pepinsky B, Barsoum J. Tat-mediated delivery of heterologous proteins into cells. Proc Natl Acad Sci U S A. 1994;91:664–8. doi: 10.1073/pnas.91.2.664. [DOI] [PMC free article] [PubMed] [Google Scholar]
- Frankel AD, Pabo CO. Cellular uptake of the tat protein from human immunodeficiency virus. Cell. 1988;55:1189–93. doi: 10.1016/0092-8674(88)90263-2. [DOI] [PubMed] [Google Scholar]
- Frishman LJ, Steinberg RH. Light-evoked increases in [K+]o in proximal portion of the dark-adapted cat retina. J Neurophysiol. 1989;61:1233–43. doi: 10.1152/jn.1989.61.6.1233. [DOI] [PubMed] [Google Scholar]
- Green M, Loewenstein PM. Autonomous functional domains of chemically synthesized human immunodeficiency virus tat trans-activator protein. Cell. 1988;55:1179–88. doi: 10.1016/0092-8674(88)90262-0. [DOI] [PubMed] [Google Scholar]
- Heiduschka P, Fietz H, Hofmeister S, Schultheiss S, Mack AF, Peters S, Ziemssen F, Niggemann B, Julien S, Bartz-Schmidt KU, Schraermeyer U. Penetration of bevacizumab through the retina after intravitreal injection in the monkey. Invest Ophthalmol Vis Sci. 2007;48:2814–23. doi: 10.1167/iovs.06-1171. [DOI] [PubMed] [Google Scholar]
- Henriques ST, Castanho MA. Consequences of nonlytic membrane perturbation to the translocation of the cell penetrating peptide pep-1 in lipidic vesicles. Biochemistry. 2004;43:9716–24. doi: 10.1021/bi036325k. [DOI] [PubMed] [Google Scholar]
- Henriques ST, Castanho MA. Translocation or membrane disintegration? Implication of peptide-membrane interactions in pep-1 activity. J Pept Sci. 2008;14:482–7. doi: 10.1002/psc.1003. [DOI] [PubMed] [Google Scholar]
- Henriques ST, Costa J, Castanho MA. Translocation of beta-galactosidase mediated by the cell-penetrating peptide pep-1 into lipid vesicles and human HeLa cells is driven by membrane electrostatic potential. Biochemistry. 2005;44:10189–98. doi: 10.1021/bi0502644. [DOI] [PubMed] [Google Scholar]
- Hood DC, Birch DG. A quantitative measure of the electrical activity of human rod photoreceptors using electroretinography. Vis Neurosci. 1990;5:379–87. doi: 10.1017/s0952523800000468. [DOI] [PubMed] [Google Scholar]
- Jamison JA, Bush RA, Lei B, Sieving PA. Characterization of the rod photoresponse isolated from the dark-adapted primate ERG. Vis Neurosci. 2001;18:445–55. doi: 10.1017/s0952523801183112. [DOI] [PubMed] [Google Scholar]
- Jat PS, Noble MD, Ataliotis P, Tanaka Y, Yannoutsos N, Larsen L, Kioussis D. Direct derivation of conditionally immortal cell lines from an H-2Kb-tsA58 transgenic mouse. Proc Natl Acad Sci U S A. 1991;88:5096–100. doi: 10.1073/pnas.88.12.5096. [DOI] [PMC free article] [PubMed] [Google Scholar]
- Jiang J, Borisenko GG, Osipov A, Martin I, Chen R, Shvedova AA, Sorokin A, Tyurina YY, Potapovich A, Tyurin VA, Graham SH, Kagan VE. Arachidonic acid-induced carbon-centered radicals and phospholipid peroxidation in cyclo-oxygenase-2-transfected PC12 cells. J Neurochem. 2004;90:1036–49. doi: 10.1111/j.1471-4159.2004.02577.x. [DOI] [PubMed] [Google Scholar]
- Johnson LN, Cashman SM, Kumar-Singh R. Cell-penetrating Peptide for Enhanced Delivery of Nucleic Acids and Drugs to Ocular Tissues Including Retina and Cornea. Mol Ther. 2007 doi: 10.1038/sj.mt.6300324. [DOI] [PMC free article] [PubMed] [Google Scholar]
- Kim DW, Kim SY, An JJ, Lee SH, Jang SH, Won MH, Kang TC, Chung KH, Jung HH, Cho SW, Choi JH, Park J, Eum WS, Choi SY. Expression, purification and transduction of PEP-1-botulinum neurotoxin type A (PEP-1-BoNT/A) into skin. J Biochem Mol Biol. 2006;39:642–7. doi: 10.5483/bmbrep.2006.39.5.642. [DOI] [PubMed] [Google Scholar]
- Klymkowsky MW, Miller RH, Lane EB. Morphology, behavior, and interaction of cultured epithelial cells after the antibody-induced disruption of keratin filament organization. J Cell Biol. 1983;96:494–509. doi: 10.1083/jcb.96.2.494. [DOI] [PMC free article] [PubMed] [Google Scholar]
- Kouklis PD, Traub P, Georgatos SD. Involvement of the consensus sequence motif at coil 2b in the assembly and stability of vimentin filaments. J Cell Sci. 1992;102 (Pt 1):31–41. doi: 10.1242/jcs.102.1.31. [DOI] [PubMed] [Google Scholar]
- Lee YP, Kim DW, Lee MJ, Jeong MS, Kim SY, Lee SH, Jang SH, Park J, Kang TC, Won MH, Cho SW, Kwon OS, Eum WS, Choi SY. Human brain pyridoxal-5′-phosphate phosphatase (PLPP):protein transduction of PEP-1-PLPP into PC12 cells. BMB Rep. 2008;41:408–13. doi: 10.5483/bmbrep.2008.41.5.408. [DOI] [PubMed] [Google Scholar]
- Lieber JG, Evans RM. Disruption of the vimentin intermediate filament system during adipose conversion of 3T3-L1 cells inhibits lipid droplet accumulation. J Cell Sci. 1996;109 (Pt 13):3047–58. doi: 10.1242/jcs.109.13.3047. [DOI] [PubMed] [Google Scholar]
- Lindgren M, Hallbrink M, Prochiantz A, Langel U. Cell-penetrating peptides. Trends Pharmacol Sci. 2000;21:99–103. doi: 10.1016/s0165-6147(00)01447-4. [DOI] [PubMed] [Google Scholar]
- Mano T, Puro DG. Phagocytosis by human retinal glial cells in culture. Invest Ophthalmol Vis Sci. 1990;31:1047–55. [PubMed] [Google Scholar]
- Maron MB, Folkesson HG, Stader SM, Walro JM. PKA delivery to the distal lung air spaces increases alveolar liquid clearance after isoproterenol-induced alveolar epithelial PKA desensitization. Am J Physiol Lung Cell Mol Physiol. 2005;289:L349–54. doi: 10.1152/ajplung.00134.2004. [DOI] [PubMed] [Google Scholar]
- Mitra AK. Ophthalmic drug delivery systems. 2. Informa Health Care; 2003. [Google Scholar]
- Morris MC, Depollier J, Mery J, Heitz F, Divita G. A peptide carrier for the delivery of biologically active proteins into mammalian cells. Nat Biotechnol. 2001;19:1173–6. doi: 10.1038/nbt1201-1173. [DOI] [PubMed] [Google Scholar]
- Munoz-Morris MA, Heitz F, Divita G, Morris MC. The peptide carrier Pep-1 forms biologically efficient nanoparticle complexes. Biochem Biophys Res Commun. 2007;355:877–82. doi: 10.1016/j.bbrc.2007.02.046. [DOI] [PubMed] [Google Scholar]
- Myrberg H, Lindgren M, Langel U. Protein delivery by the cell-penetrating peptide YTA2. Bioconjug Chem. 2007;18:170–4. doi: 10.1021/bc060266g. [DOI] [PubMed] [Google Scholar]
- Nagahara H, Vocero-Akbani AM, Snyder EL, Ho A, Latham DG, Lissy NA, Becker-Hapak M, Ezhevsky SA, Dowdy SF. Transduction of full-length TAT fusion proteins into mammalian cells: TAT-p27Kip1 induces cell migration. Nat Med. 1998;4:1449–52. doi: 10.1038/4042. [DOI] [PubMed] [Google Scholar]
- Otteson D, Lewis R, Zack D. Isolation of a Conditionally Immortalized Müller Cell Line. Invest Ophthalmol Vis Sci. 2006;47 ARVO E-Abstract 132. [Google Scholar]
- Phelan A, Elliott G, O’Hare P. Intercellular delivery of functional p53 by the herpesvirus protein VP22. Nat Biotechnol. 1998;16:440–3. doi: 10.1038/nbt0598-440. [DOI] [PubMed] [Google Scholar]
- Pooga M, Hallbrink M, Zorko M, Langel U. Cell penetration by transportan. Faseb J. 1998;12:67–77. doi: 10.1096/fasebj.12.1.67. [DOI] [PubMed] [Google Scholar]
- Prahlad V, Yoon M, Moir RD, Vale RD, Goldman RD. Rapid movements of vimentin on microtubule tracks: kinesin-dependent assembly of intermediate filament networks. J Cell Biol. 1998;143:159–70. doi: 10.1083/jcb.143.1.159. [DOI] [PMC free article] [PubMed] [Google Scholar]
- Prochiantz A. Getting hydrophilic compounds into cells: lessons from homeopeptides. Curr Opin Neurobiol. 1996;6:629–34. doi: 10.1016/s0959-4388(96)80095-x. [DOI] [PubMed] [Google Scholar]
- Raz D, Fariss RN, Vijayasarathy C, Campos MM, Bush RA, Sieving PA. Probing Kir channel function in vivo: Potassium regulation in the RCS rat model of retinal degeneration. phthalmol. Vis Sci. 2007;49 E-Abstract 1936. [Google Scholar]
- Remacle AG, Rozanov DV, Baciu PC, Chekanov AV, Golubkov VS, Strongin AY. The transmembrane domain is essential for the microtubular trafficking of membrane type-1 matrix metalloproteinase (MT1-MMP) J Cell Sci. 2005;118:4975–84. doi: 10.1242/jcs.02610. [DOI] [PubMed] [Google Scholar]
- Robson JG, Frishman LJ. Response linearity and kinetics of the cat retina: the bipolar cell component of the dark-adapted electroretinogram. Vis Neurosci. 1995;12:837–50. doi: 10.1017/s0952523800009408. [DOI] [PubMed] [Google Scholar]
- Robson JG, Maeda H, Saszik SM, Frishman LJ. In vivo studies of signaling in rod pathways of the mouse using the electroretinogram. Vision Res. 2004;44:3253–68. doi: 10.1016/j.visres.2004.09.002. [DOI] [PubMed] [Google Scholar]
- Robson JG, Saszik SM, Ahmed J, Frishman LJ. Rod and cone contributions to the a-wave of the electroretinogram of the macaque. J Physiol. 2003;547:509–30. doi: 10.1113/jphysiol.2002.030304. [DOI] [PMC free article] [PubMed] [Google Scholar]
- Ruggeri M, Wehbe H, Jiao S, Gregori G, Jockovich ME, Hackam A, Duan Y, Puliafito CA. In vivo three-dimensional high-resolution imaging of rodent retina with spectral-domain optical coherence tomography. Invest Ophthalmol Vis Sci. 2007;48:1808–14. doi: 10.1167/iovs.06-0815. [DOI] [PubMed] [Google Scholar]
- Saszik SM, Robson JG, Frishman LJ. Contributions of Spiking and Non-spiking Inner Retinal Neurons to the Scotopic ERG of the Mouse. Invest Ophthalmol Vis Sci. 2002a;43 E-Abstract 1817. [Google Scholar]
- Saszik SM, Robson JG, Frishman LJ. The scotopic threshold response of the dark-adapted electroretinogram of the mouse. J Physiol. 2002b;543:899–916. doi: 10.1113/jphysiol.2002.019703. [DOI] [PMC free article] [PubMed] [Google Scholar]
- Schmucker C, Schaeffel F. A paraxial schematic eye model for the growing C57BL/6 mouse. Vision Res. 2004;44:1857–67. doi: 10.1016/j.visres.2004.03.011. [DOI] [PubMed] [Google Scholar]
- Schorderet DF, Manzi V, Canola K, Bonny C, Arsenijevic Y, Munier FL, Maurer F. D-TAT transporter as an ocular peptide delivery system. Clin Experiment Ophthalmol. 2005;33:628–35. doi: 10.1111/j.1442-9071.2005.01108.x. [DOI] [PubMed] [Google Scholar]
- Schwarze SR, Ho A, Vocero-Akbani A, Dowdy SF. In vivo protein transduction: delivery of a biologically active protein into the mouse. Science. 1999;285:1569–72. doi: 10.1126/science.285.5433.1569. [DOI] [PubMed] [Google Scholar]
- Selim AA, Abdelmagid SM, Kanaan RA, Smock SL, Owen TA, Popoff SN, Safadi FF. Anti-osteoactivin antibody inhibits osteoblast differentiation and function in vitro. Crit Rev Eukaryot Gene Expr. 2003;13:265–75. doi: 10.1615/critreveukaryotgeneexpr.v13.i24.180. [DOI] [PubMed] [Google Scholar]
- Sherry DM, Wang MM, Frishman LJ. Differential distribution of vesicle associated membrane protein isoforms in the mouse retina. Mol Vis. 2003;9:673–88. [PubMed] [Google Scholar]
- Wang M, Otteson DC, Frishman LJ. Intracellular Delivery of Proteins into Müller Glia Cells in vitro and in vivo Using Chariot Transfection Reagent. Invest Ophthalmol Vis Sci. 2007;48 doi: 10.1016/j.jneumeth.2008.10.039. E-Abstract 1687. [DOI] [PMC free article] [PubMed] [Google Scholar]
- Washbourne P, McAllister AK. Techniques for gene transfer into neurons. Curr Opin Neurobiol. 2002;12:566–73. doi: 10.1016/s0959-4388(02)00365-3. [DOI] [PubMed] [Google Scholar]
- Weisbart RH, Baldwin R, Huh B, Zack DJ, Nishimura R. Novel protein transfection of primary rat cortical neurons using an antibody that penetrates living cells. J Immunol. 2000;164:6020–6. doi: 10.4049/jimmunol.164.11.6020. [DOI] [PubMed] [Google Scholar]