Abstract
The cardiotonic steroid marinobufagenin (MBG) has been implicated in the pathogenesis of experimental uremic cardiomyopathy, which is characterized by progressive cardiac fibrosis. We examined whether the transcription factor Friend leukemia integration-1 (Fli-1) might be involved in this process. Fli-1-knockdown mice demonstrated greater cardiac collagen-1 expression and fibrosis compared with wild-type mice; both developed increased cardiac collagen expression and fibrosis after 5/6 nephrectomy. There was a strong inverse relationship between the expressions of Fli-1 and procollagen in primary culture of rat cardiac and human dermal fibroblasts as well as a cell line derived from renal fibroblasts and MBG-induced decreases in nuclear Fli-1 as well as increases in procollagen-1 expression in these cells. Transfection of a Fli-1 expression vector prevented increased procollagen-1 expression from MBG. MBG exposure induced a rapid translocation of the δ-isoform of protein kinase C (PKCδ) to the nucleus. This translocation was prevented by pharmacological inhibition of phospholipase C, and MBG-induced increases in procollagen-1 expression were prevented with a PKCδ- but not a PKCα-specific inhibitor. Finally, immunoprecipitation studies strongly suggest that MBG induced phosphorylation of Fli-1. We feel these data support a causal relationship with MBG-induced translocation of PKCδ, which results in phosphorylation of as well as decreases in nuclear Fli-1 expression, which, in turn, leads to increases in collagen production. Should these findings be confirmed, we speculate that this pathway may represent a therapeutic target for uremic cardiomyopathy as well as other conditions associated with excessive fibrosis.
Keywords: renal failure, cardiotonic steroids, fibrosis
we have identified that the cardiotonic steroid marinobufagenin (MBG) is responsible for many of the clinical features of experimental uremic cardiomyopathy and that cardiotonic steroids in general directly stimulate cardiac fibroblasts to produce increased amounts of collagen (5, 10, 12). Somewhat surprisingly, we did not observe increases in transforming growth factor (TGF)-β or Smad proteins either in vivo or in vitro with this process, although we did find that a TGF-β antagonist, SB-431542, blocked stimulation of collagen production from cardiotonic steroids (5). Because of these observations, we chose to examine other mechanisms by which cardiotonic steroids might stimulate collagen production.
Recently, the transcription factor Friend leukemia integration-1 (Fli-1), which belongs to the ETS family, has been identified as a negative regulator of collagen synthesis in dermal fibroblasts (3, 14, 20). It has also been identified that stimulation of protein kinase C (PKC), specifically the δ-isoform, can phosphorylate Fli-1 and stimulate collagen synthesis (9). Because it has been shown that cardiotonic steroids may induce increases in PKC activity through signaling through the Na-K-ATPase (13), we proposed to examine whether this pathway could explain our findings.
MATERIALS AND METHODS
Materials.
MBG (>99% pure) was isolated from the venom of Bufo marinus as described previously (6). U-73122 (a PLC inhibitor) was purchased from Cayman Chemical (Ann Arbor, MI). Rottlerin (a PKCδ inhibitor), GF-109203X (a PKCα inhibitor), and protease inhibitors were obtained from Sigma-Aldrich, (St. Louis, MO). Anti-type I collagen antibody was purchased from Southern Biotech (Birmingham, AL). We used two sources of anti-Fli-1 antibody, both of which were polyclonal. One that was used in the samples derived from in vitro studies was purchased from Santa Cruz Biotechnology (Santa Cruz, CA), whereas a rabbit anti-Fli-1 antibody that was supplied by one of the authors (D. K. Watson) was used for the Western blots derived from cardiac tissue (22). Anti-PKC antibodies were purchased from BD Biosciences (San Jose, CA). Anti-phosphoserine and anti-phosphothreonine antibodies were obtained from Calbiochem (San Diego, CA). [32P]orthophosphoric acid was purchased from Perkin Elmer (Waltham, MA). Normal human dermal fibroblasts were obtained from Cambrex Bioscience (Walkersville, MD), and rat renal fibroblasts were purchased from American Type Culture Collection (Manassas, VA). A pSG5 plasmid expressing Fli-1 gene was employed as previously described by one of the authors (M. B. Kahaleh) (20).
Animal studies.
All animal experimentation described in this article was conducted in accordance with the National Institutes of Health (NIH) Guide for the Care and Use of Laboratory Animals under protocols approved by the University of Toledo Institutional Animal Care and Use Committee. Male mice (B6; 129SvEv-Fli-1tm1) weighing between 25 and 30 g were generated at the University of Toledo after a breeding pair were obtained from the animal colony at the Medical University of South Carolina and used in this study (21). Systolic blood pressure was measured in conscious animals by the tail-cuff method as previously described (11). The animals were then subjected to either sham surgery or partial nephrectomy (PNx) as we have also previously described (11). After surgery, systolic blood pressure was monitored weekly until the animals were killed. At the end of 4 wk, mice were anesthetized with pentobarbital sodium (50 mg/kg ip). Blood was collected for measurement of plasma MBG concentration. The animal's heart was then removed, weighed, and used for histological (trichrome staining and morphometric analysis) and biochemical analysis as we have previously reported (5, 10–12). Western blot analysis was performed on tissue homogenates prepared from different groups as described below.
Cell culture.
Adult rat cardiac fibroblasts were isolated as previously described by Brilla et al. (2), with modifications as previously described by us (5). Cardiac, renal, and human dermal fibroblasts were grown to confluence in DMEM with 15% FBS and starved for 18–24 h in a medium containing 1% FBS before treatment. Cardiac, renal, and human dermal fibroblasts were used up to passages 2, 10, and 7, respectively. Protein contents of various preparations were determined with the Bio-Rad protein assay method. U-73122, a PLC inhibitor, was used at a concentration of 10 μM in the medium (7). Rottlerin, a PKC inhibitor specific for PKCδ, and GF-109203X, a PKC inhibitor specific for PKCα, were used at a concentration of 4 μM (9).
Generation of stable transfectants.
Renal fibroblasts were grown to 80% confluence, and they were transfected with either pSG5 Fli-1 gene or pSG5 vector and pTargeT vector carrying neomycin-resistant gene (Promega, Madison, WI). The transfection was carried out at a ratio of 10 parts of pSG5-Fli-1 to 1 part of pTargeT vector with the transfection reagent FuGENE 6 (Roche, Nutley, NJ) according to the manufacturer's protocol. Individual antibiotic-resistant colonies were selected and expanded in medium containing 400 μg/ml G418. The cells transfected with the pSG5-Fli-1 and pSG5 (control) genes were analyzed for the expression of procollagen determined on whole cell lysates and the nuclear expression of the Fli-1 protein.
Western blot analysis.
Cell lysates were prepared by washing the cells twice with ice-cold phosphate-buffered saline (PBS) and incubating them on ice for 20 min with lysis buffer containing 10 mM Tris·HCl, pH 7.5, 0.5% Nonidet P-40, and protease and phosphatase inhibitors. Cell lysates were collected, vortexed for 30 s, and used immediately or stored at −80°C. For procollagen detection, cell lysates or tissue homogenates were dissolved in loading buffer and proteins (10 μg/lane) were separated by SDS-PAGE using 4–15% Tris·HCl precast ready gels (Bio-Rad, Hercules, CA). For Fli-1 detection, a large 10% gel was used and the protein loading was between 80 and 200 μg/lane for nuclear extract or 50 μg/lane for tissue homogenates. After separation, proteins were transferred onto polyvinylidene difluoride (PVDF) membranes. Membranes were blocked with 5% nonfat dry milk (Bio-Rad) in Tris-buffered saline supplemented with 0.05% Tween 20 (TBS-T) at room temperature for 2 h and then incubated with primary antibody in blocking buffer at 4°C overnight. After being washed in TBS-T, membranes were incubated for 2 h at room temperature with horseradish peroxidase-conjugated secondary antibody in blocking buffer. After being washed in TBS, membranes were developed with ECL or ECL plus (Amersham Biosciences, Piscataway, NJ). For loading controls, tubulin or actin was probed; for both, the primary antibody was diluted 1/3,000 and the secondary antibody (goat anti-mouse, Santa Cruz) was diluted 1/2,000. The images captured on X-ray film were scanned with CanoScan Li DE 60 from Canon and quantified by using Image J version 1.37V software (NIH). The quantified signals were in the linear range of our detection system.
Immunostaining and confocal microscopy.
Cells were fixed with cold absolute methanol or 4% paraformaldehyde in PBS, permeabilized in permeabilization buffer (PBS with 0.3% Triton X-100 and 0.1% BSA) for 15 min, and blocked with GSDB buffer [20 mM sodium phosphate, pH 7.4, with 150 mM NaCl, 0.3% Triton X-100, and 16% (vol/vol) filtered normal goat serum] for 30 min at room temperature. The cells were then probed with primary antibody for 90 min at room temperature or overnight at 4°C (rabbit polyclonal anti PKCδ antibody, Santa Cruz Biotechnology; 1:50 dilution in GSDB). After three washes with permeabilization buffer, the cells were incubated with Alexa Fluor 488-conjugated antirabbit secondary antibody for 1 h at room temperature. After another three washes, the cells were counterstained with propidium iodide (Molecular Probes) to localize nuclei. Cells were then mounted with Prolong Anti-fade medium (Molecular Probes) and stored at −20°C. All images were generated with a Leica DMIRE2 confocal microscope (Wetzlar, Germany). Contrast and brightness were set to ensure that all pixels were within the linear range. Negative controls were also performed to verify the specificity of primary and secondary antibodies.
Determination of PKCδ in nucleus.
Cardiac and renal fibroblasts were grown to confluence and starved for 18–24 h. Cells were treated with MBG to a final concentration of 10 nM in the medium. After 15 min, cells were washed with ice-cold PBS and nuclear extracts were prepared from treated and untreated cells as described by Wadman et al. (18). PKCδ in the nuclear extract was determined by performing Western blot analysis as described above.
Immunoprecipitation and detection of phosphorylated Fli-1 by Western blot.
Renal fibroblasts were grown and starved as described above. The cells were treated for 15 min with 10 nM MBG in the medium. After the cells were washed in PBS, nuclear extracts were prepared from treated and untreated cells as described (11). Equal amounts of proteins from nuclear extracts were used for immunoprecipitation. For immunoprecipitation, nuclear proteins were incubated with the polyclonal anti-Fli-1 antibody conjugated to agarose beads at 4°C overnight. The following day the immunocomplex was sedimented and washed three or four times with ice-cold PBS. The washed immunocomplex was dissolved in sample buffer, and the proteins were separated on a 10% gel. The separated proteins were transferred to a PVDF membrane and processed as described under Western blot analysis. To detect whether serine or threonine molecules are involved in phosphorylation of proteins, anti-phosphoserine or anti-phosphothreonine antibodies were used.
Immunoprecipitation and detection of phosphorylated Fli-1 by autoradiography.
For autoradiography, renal fibroblasts were grown and starved as described above. The starved cells were rinsed twice with phosphate-free DMEM and then incubated at 37°C in phosphate-free DMEM for 30 min. The cells were replaced with fresh phosphate-free DMEM containing 20 μCi/ml [32P]orthophosphoric acid and incubated for 2 h. MBG was added to the cells to a final concentration of 10 nM, and 15 min later the cells were washed with ice-cold PBS. Nuclear extracts were prepared as described (11). For immunoprecipitation, nuclear extracts with equal amounts of radioactivity from treated and untreated renal fibroblasts were incubated with the polyclonal anti-Fli-1 antibody conjugated to agarose beads at room temperature for 2 h. The immunocomplex was washed with ice-cold PBS, dissolved in sample buffer, and subjected to SDS-PAGE on a 10% gel. The gels were dried on a gel dryer, and the phosphorylated proteins were visualized by using a phosphoimager (Storm 840 from Novell) and quantified by using Image Quan TLV software from Novell.
Statistical analysis.
Data presented are means ± SE. Data obtained were first tested for normality. If the data did not pass the normality test, the Tukey test (for multiple groups) or the Mann-Whitney rank sum test was used to compare the data. If the data did pass the normality test, parametric comparisons were performed. If more than two groups were compared, one-way analysis of variance was performed before comparison of individual groups with the unpaired Student's t-test with Bonferroni's correction for multiple comparisons. If only two groups of normal data were compared, the Student's t-test was used without correction (19). Statistical analysis was performed with SPSS software.
RESULTS
Relationship between Fli-1 and collagen expression in cardiac tissues of wild-type and Fli-1-knockdown mice before and after nephrectomy.
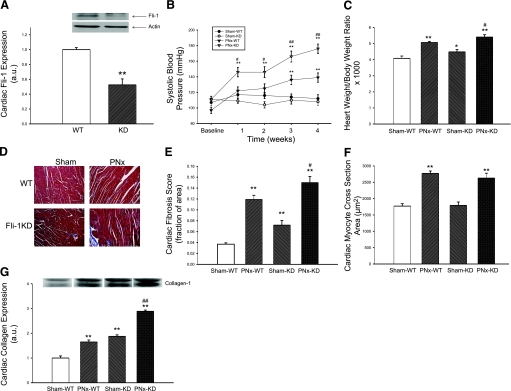
We first examined whether there was a relationship between collagen production and Fli-1 expression in cardiac tissues. We determined the expression of Fli-1 and collagen in the hearts obtained from wild-type (WT) and Fli-1-knockdown (KD) mice by Western blot. We observed that the hearts of the KD mice expressed ∼50% of the Fli-1 of WT hearts (Fig. 1A). Next, we performed either sham surgery or PNx on these animals, and conscious systolic blood pressure was monitored before and after surgery as the renal failure progressed. We found that systolic blood pressure was increased in WT as well as KD animals after PNx compared with sham surgery. Interestingly, the increase in systolic blood pressure was greater in KD animals (Fig. 1B) compared with WT animals. When we examined the heart size in these animals, the heart size was increased after PNx in both WT and KD animals, but the increase in heart size was greater in the KD animals (Fig. 1C). Next, we examined the histology of the hearts with trichrome staining; we noted that there was a greater degree of fibrosis determined by the amount of blue staining in both WT and KD animals after PNx, but the amount of blue staining was greater in KD compared with WT animals (Fig. 1, D and E). Of interest, cardiac myocyte cross-sectional areas were not different between KD and WT animals either at baseline or after PNx, but the cross-sectional areas of both KD and WT increased after PNx compared with sham surgery (Fig. 1F). We also measured collagen expression in cardiac tissues from these animals. We found that collagen expression was high in KD compared with WT animals. This difference was more pronounced after PNx (Fig. 1G). This finding was consistent with the histological observations described above.
Fig. 1.
Characterization of cardiac fibrosis in Friend leukemia integration-1 (Fli-1)-knockdown (KD) animals and their response to partial nephrectomy (PNx). A: basal Fli-1 expression determined with Western blot (representative blot at top, quantitative data at bottom) in cardiac tissue obtained from n = 5 wild-type (WT) and Fli-1 KD mice. B: conscious systolic blood pressure in WT animals exposed to sham surgery (Sham, n = 6) and PNx (n = 8) as well as KD mice exposed to sham surgery (n = 6) and PNx (n = 9) determined at baseline and 1, 2, 3, and 4 wk. C: heart weight normalized for body weight in these animals at 4 wk. D: representative histology (trichrome stain). E: quantification of fibrosis. F: measurement of myocyte cross-sectional area from the hearts of these mice. G: collagen expression determined with a polyclonal antibody (representative Western blot with dimer at ∼100 kDa, quantified data shown below) in these animals. *P < 0.05, **P < 0.01 vs. Sham-WT; #P < 0.05, ##P < 0.01 vs. PNx-WT.
Relationship between procollagen and nuclear Fli-1 expression in fibroblasts from different tissues.
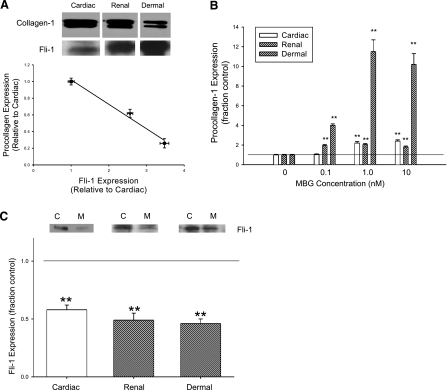
We initially examined the basal expression levels of nuclear Fli-1 and procollagen determined on whole cell lysates from fibroblasts isolated from human skin and rat heart and kidneys and grown to confluence. We noted indeed that the procollagen production from cardiac fibroblasts was greater at baseline than that seen with the renal fibroblasts, which, in turn, was greater than that seen with human dermal fibroblasts. Interestingly, basal nuclear Fli-1 expression appeared to be strongly but inversely correlated with the basal expression of procollagen (Fig. 2A). Next, we examined the effect of MBG on procollagen and Fli-1 expression in all three fibroblasts. We noted that MBG increased procollagen expression in the renal and dermal fibroblasts, as well as in the cardiac fibroblasts, as we previously reported (5) (Fig. 2B). The threshold for significant increases in procollagen expression was at 0.1 nM in the renal and dermal fibroblasts, whereas it was 1.0 nM for the cardiac fibroblasts. Other cardiac glycosides (ouabain and digoxin) also induced increases in procollagen expression in all three cell types (data not shown), as we had previously reported in cardiac fibroblasts (5). MBG administered at a concentration of 10 nM resulted in marked and similar decreases in nuclear Fli-1 expression in all fibroblasts studied (Fig. 2C).
Fig. 2.
Procollagen and Fli-1 expression in different fibroblasts. A: representative Western blot for procollagen showing dimer detected with polyclonal antibody at ∼150 kDa and Fli-1 detected with a polyclonal antibody at ∼50 kDa (both shown at top) and the quantification of these measurements in each group (n = 6) obtained at baseline in rat cardiac and renal and human dermal fibroblasts grown to confluence (bottom). Regression line for procollagen expression compared with Fli-1 expression is shown with data normalized to that of cardiac fibroblasts (r2 = 0.98, P < 0.01). B: quantitative densitometric data for procollagen (measured by Western blot as in A) in response to different doses of MBG for 24 h (n = 6). C: quantitative densitometric data for Fli-1 (measured by Western blot as in B) obtained in response to 10 nM MBG (n = 6) for 24 h. Because of the differences in basal Fli-1 expression, we loaded 200 μg for cardiac, 130 μg for renal, and 80 μg for dermal fibroblast nuclear extracts. Top: C represents control, and M refers to MBG. Bars on quantitative graphs represent means ± SE. **P < 0.01 vs. control.
Decreases in nuclear Fli-1 expression are necessary for MBG-induced increases in procollagen expression in a renal fibroblast line.
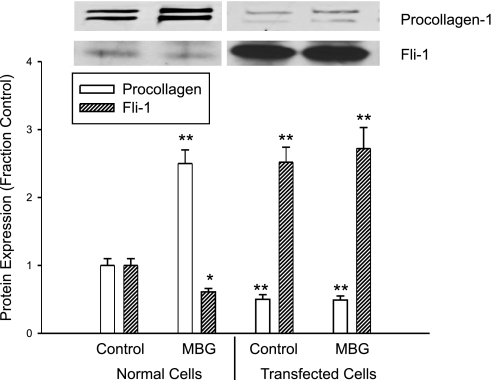
To further examine the relationship between Fli-1 expression and MBG-induced increases in procollagen production, we stably transfected the renal fibroblasts with a Fli-1 expression vector coupled to an SV40 promoter. We found that the renal fibroblasts transfected with Fli-1 expression vector showed marked increase in nuclear Fli-1 expression, as expected. At the same time, the basal expression level of procollagen was significantly reduced. Furthermore, when these transfected cells were exposed to MBG, MBG did not produce an increase in procollagen expression. On the other hand, MBG produced a significant increase in procollagen expression as well as a decrease in nuclear Fli-1 expression in control renal fibroblasts (transfected with an empty vector, Fig. 3).
Fig. 3.
Effects of MBG on procollagen and Fli-1 expression in stably transfected rat renal fibroblasts. MBG was administered at 10 nM for 24 h. Bars on quantitative graph represent means ± SE of 6 determinations derived from Western blots as in Fig. 1. *P < 0.05, **P < 0.01 vs. control.
MBG induces translocation of PKCδ into nucleus.
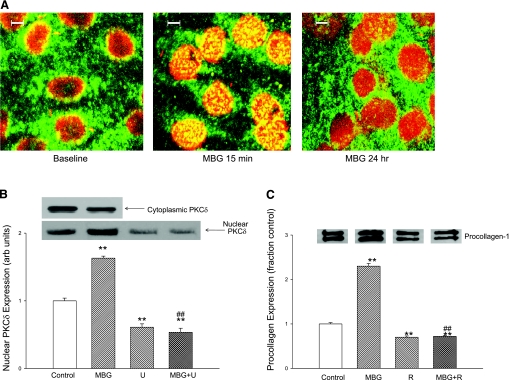
In this set of experiments, we first examined the expression of various PKC isoforms in cardiac fibroblasts. We found that the α, γ, δ, ɛ, and λ PKC isoforms could all be detected with Western blot. However, after MBG administration, expression of PKCδ (and no other PKC isoform) was increased in the nuclear fraction and decreased in the cytosol. Following the work of Jinnin and colleagues (9), we examined the effect of rottlerin, a specific inhibitor of PKCδ, on the MBG-induced expression of procollagen. We found that addition of rottlerin (4 μM) resulted in marked reductions in basal procollagen expression and prevented MBG-induced increases in procollagen expression (Fig. 4C). In contrast, administration of GF-109203X, which is specific for PKCα, did not alter the change in procollagen expression following MBG treatment for 24 h (relative expression to control = 1.9 ± 0.2; n = 3).
Fig. 4.
Effect of MBG on nuclear protein kinase C (PKC)δ expression in cardiac fibroblasts. A: confocal immunofluorescence micrographs of cardiac fibroblasts at baseline and treated with 10 nM MBG for 15 min and 24 h. Images were also obtained at 5 and 30 min as well as 1 and 4 h (not shown). B: top: representative nuclear (n = 9) and cytosolic (n = 3) PKCδ expression determined by Western blot in cells treated with 10 nM MBG. Quantitative data for nuclear expression of PKCδ are shown at bottom. Effects of MBG (10 nM) and PLC inhibitor U-73122 (U) (n = 9 for control and MBG; n = 6 for U alone and U+MBG) are also shown. C: procollagen expression determined by Western blot (see Fig. 1) in cells treated with 10 nM MBG with or without PKCδ inhibitor rottlerin (4 μM; R) (n = 6 in each group) for 24 h. *P < 0.05, **P < 0.01 vs. control; #P < 0.05, ##P < 0.01 vs. MBG.
We next used confocal immunofluorescence microscopy technique to follow the time course of the PKCδ translocation to the nucleus. Confocal immunofluorescence microscopy experiments showed that that the nuclear PKCδ expression peaked at ∼15 min and slowly decreased over the next 24 h of exposure to MBG, and that this increase in nuclear expression was paralleled by a decrease in cytosolic expression (Fig. 4, A and B). A virtually identical pattern was noted with renal fibroblasts (n = 5; data not shown). The finding of the confocal experiment was supported by a Western blot experiment in which we found a significant increase in cardiac nuclear PKCδ expression at 15 min accompanied by a decrease in cytosolic PKCδ expression after exposure to 10 nM MBG. The increase in nuclear PKCδ expression was blocked by coincubation with the PLC inhibitor U-73122 (Fig. 4B).
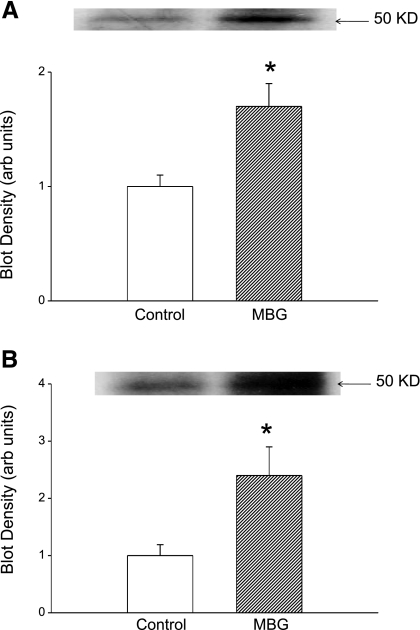
Our next step was to examine whether the translocation of PKCδ into the nucleus causes phosphorylation of Fli-1. To test this, cells were exposed to 10 nM MBG for 15 min and nuclear extracts were prepared. To enrich Fli-1, nuclear extract was incubated with polyclonal anti-Fli-1 antibody. The resulting immunocomplex was separated on a 10% gel and probed for phosphorylated proteins, particularly Fli-1, with an anti-phosphoserine antibody. We found a band with greater intensity corresponding to the molecular mass of Fli-1 (Fig. 5A). When the experiment was repeated in the presence of rottlerin or U-73122 (both n = 3), the intensity of the 50-kDa band was the same or less than that seen with untreated cells (blot densities of 0.7 ± 0.3 and 0.7 ± 0.2 with rottlerin or U-73122 alone, respectively, and 0.6 ± 0.3 and 0.7 ± 0.2 when rottlerin or U-73122 was combined with MBG, respectively; data expressed relative to control, both n = 3). When the immunocomplex was probed after separation of proteins with an anti-threonine antibody we did not see any increase in intensity of the band with 50-kDa mass after MBG treatment (blot density of 0.9 ± 0.2 relative to control; n = 3).
Fig. 5.
Effect of MBG on phosphorylated Fli-1 in renal fibroblasts. A: immunoblot against phosphoserine in nuclear extracts immunoprecipitated with polyclonal antibody against Fli-1; representative blot is shown at top and quantification of n = 4 determinations is shown at bottom. B: 32P autoradiograph data obtained from cells treated with 32P-labeled phosphate for 2 h and MBG for 15 min. Top: representative autoradiograph. Bottom: quantification of n = 5 experiments. *P < 0.05 vs. control.
To further demonstrate that MBG induced decreases in Fli-1 expression through PKCδ-mediated phosphorylation, we labeled the cells with 32P and prepared nuclear extracts. To enrich Fli-1, nuclear extracts were immunoprecipitated with polyclonal anti-Fli-1 antibody and the immunocomplex was subjected to gel electrophoresis. 32P-labeled proteins present on the gel were quantified with a phosphoimager. We observed an increase in 32P-labeled protein at the level corresponding to molecular mass of Fli-1 (Fig. 5B); this was attenuated to be comparable to that seen in control samples by coadministration of rottlerin (blot density of 0.7 ± 0.2 with rottlerin alone and 0.6 ± 0.3 with rottlerin + MBG; data expressed relative to control, n = 3).
DISCUSSION
Uremic cardiomyopathy is characterized by diastolic dysfunction and left ventricular hypertrophy. Cardiac disease is responsible for the high mortality seen in patients suffering from kidney diseases (15). Our group and others have observed that the cardiotonic steroid MBG, signaling through the Na-K-ATPase, is directly responsible for many features of experimental uremic cardiomyopathy. MBG directly induces cardiac fibroblasts to produce collagen, thus producing much of the cardiac fibrosis seen with experimental renal failure (5, 12).
Fli-1 is a member of the Ets oncogene family of proteins (1, 4, 8, 16, 17) and normally competes with ETS-1 in a Sp-1-dependent manner to balance between stimulating and repressing the Col1a2 promoter. This transcription factor has been clearly shown to play a role in dermal fibrosis, and a direct inhibitory effect on collagen-1 synthesis has been demonstrated (3). In the present study, we extended this observation to an animal model and used Fli-1 KD mice, looking for cardiac fibrosis. First, we demonstrated that the viable heterozygotes (Fli-1+/−) expressed ∼50% of cardiac Fli-1 compared with WT mice. These heterozygotes also had greater degrees of cardiac fibrosis and cardiac collagen expression compared with WT mice. The severity of cardiac fibrosis and the amount of cardiac collagen expression were increased by PNx in both WT and heterozygote mice, thus supporting the concept that the downregulation of nuclear Fli-1 expression induced by cardiotonic steroids plays a significant role in the cardiac fibrosis seen in experimental renal failure (5, 11). That said, we must point out that the systolic blood pressure was significantly higher in the Fli-1 heterozygote mice than in the WT mice after PNx, potentially contributing to the increased fibrosis seen in these animals.
On the basis of these in vivo results, we examined the relevance to different types of fibroblasts, in particular cardiac, renal, and dermal fibroblasts. First, we demonstrated an inverse relationship between basal nuclear Fli-1 expression and collagen production in the three types of fibroblasts. We further demonstrated that MBG induced corresponding decreases in nuclear Fli-1 expression with increases in procollagen expression in each of these fibroblasts, and we confirmed the importance of Fli-1 with an overexpression transfection in a renal fibroblast cell line. These transfected cells showed higher basal levels of nuclear Fli-1 expression and lower basal levels of procollagen expression and did not show any significant increase in procollagen expression in response to MBG.
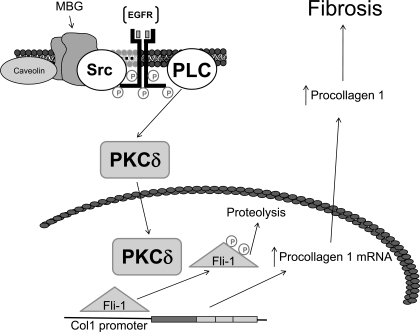
To further explore the signaling pathways leading to this observation, we first looked at the PKC family of proteins that mediate the specific activation of a variety of transcription factors. Specifically, Jinnin and colleagues (9) have shown that PKCδ stimulation can phosphorylate Fli-1 and increase collagen synthesis. Moreover, Zhang and Watson (22) suggested that a balance between protein kinase and protein phosphatase regulates the phosphorylation status and effectiveness of Fli-1 in inhibiting collagen-1 synthesis. We observed that MBG-induced translocation of PKCδ into the nucleus is a PLC-dependent process, a finding consistent with what Kometiani and coworkers (13) demonstrated for ouabain-induced activation of the Na-K-ATPase signal cascade. U-73122 completely prevented any increase in nuclear PKCδ, whereas rottlerin prevented MBG-induced increases in procollagen expression, supporting this concept. We further determined that it is PKCδ which phosphorylates Fli-1 as assessed by immunoprecipitation, immunoblotting, and 32P labeling. On the basis of these data as well as previous reports (3, 5, 12, 14), we would suggest the schematic shown in Fig. 6.
Fig. 6.
Schematic describing how cardiotonic induced sodium pump signaling may result in decreases in collagen production. In the presence of the cardiotonic steroid MBG, Na-K-ATPase is converted to a signal transducer that complexes with Src and the EGF receptor (EGFR). A signal cascade is initiated that involves PLC, which results in the activation of PKCδ and its translocation to the nucleus. In the nucleus, PKCδ phosphorylates Fli-1. This, in turn, leads to more rapid catabolism of Fli-1 and removal of Fli-1 inhibition on the Col1 promoter and thus increases in collagen expression.
Together with the existing literature, our findings strongly implicate the transcription factor Fli-1 in the progressive cardiac fibrosis seen with experimental uremia. If these data are confirmed by further studies, we would suggest that the signal cascade that has been elucidated may serve as a therapeutic target for clinical uremic cardiomyopathy.
GRANTS
This work was supported by NIH Grants RO1-HL-67963 and P01-CA-78582 and supported in part by the intramural research program of the National Institute on Aging.
Acknowledgments
We thank Carol Woods for her excellent secretarial assistance.
Portions of this work were presented at the 2006 and 2007 American Society of Nephrology meetings in abstract form.
REFERENCES
- 1.Blair DG, Athanasiou M. Ets and retroviruses—transduction and activation of members of the Ets oncogene family in viral oncogenesis. Oncogene 19: 6472–6481, 2000. [DOI] [PubMed] [Google Scholar]
- 2.Brilla CG, Zhou G, Matsubara L, Weber KT. Collagen metabolism in cultured adult rat cardiac fibroblasts: response to angiotensin II and aldosterone. J Mol Cell Cardiol 26: 809–820, 1994. [DOI] [PubMed] [Google Scholar]
- 3.Czuwara-Ladykowska J, Shirasaki F, Jackers P, Watson DK, Trojanowska M. Fli-1 inhibits collagen type I production in dermal fibroblasts via an Sp1-dependent pathway. J Biol Chem 276: 20839–20848, 2001. [DOI] [PubMed] [Google Scholar]
- 4.Dhulipal PD Ets oncogene family. Indian J Exp Biol 35: 315–322, 1997. [PubMed] [Google Scholar]
- 5.Elkareh J, Kennedy DJ, Yashaswi B, Vetteth S, Shidyak A, Kim EG, Smaili S, Periyasamy SM, Hariri IM, Fedorova L, Liu J, Wu L, Kahaleh MB, Xie Z, Malhotra D, Fedorova OV, Kashkin VA, Bagrov AY, Shapiro JI. Marinobufagenin stimulates fibroblast collagen production and causes fibrosis in experimental uremic cardiomyopathy. Hypertension 49: 215–224, 2007. [DOI] [PubMed] [Google Scholar]
- 6.Fedorova OV, Lakatta EG, Bagrov AY. Endogenous Na,K pump ligands are differentially regulated during acute NaCl loading of Dahl rats. Circulation 102: 3009–3014, 2000. [DOI] [PubMed] [Google Scholar]
- 7.He YY, Huang JL, Chignell CF. Delayed and sustained activation of extracellular signal-regulated kinase in human keratinocytes by UVA: implications in carcinogenesis. J Biol Chem 279: 53867–53874, 2004. [DOI] [PubMed] [Google Scholar]
- 8.Hromas R, Klemsz M. The ETS oncogene family in development, proliferation and neoplasia. Int J Hematol 59: 257–265, 1994. [PubMed] [Google Scholar]
- 9.Jinnin M, Ihn H, Yamane K, Mimura Y, Asano Y, Tamaki K. Alpha2(I) collagen gene regulation by protein kinase C signaling in human dermal fibroblasts. Nucleic Acids Res 33: 1337–1351, 2005. [DOI] [PMC free article] [PubMed] [Google Scholar]
- 10.Kennedy D, Omran E, Periyasamy SM, Nadoor J, Priyadarshi A, Willey JC, Malhotra D, Xie Z, Shapiro JI. Effect of chronic renal failure on cardiac contractile function, calcium cycling, and gene expression of proteins important for calcium homeostasis in the rat. J Am Soc Nephrol 14: 90–97, 2003. [DOI] [PubMed] [Google Scholar]
- 11.Kennedy DJ, Elkareh J, Shidyak A, Shapiro AP, Smaili S, Mutgi K, Gupta S, Tian J, Morgan E, Khouri S, Cooper CJ, Periyasamy SM, Xie Z, Malhotra D, Fedorova OV, Bagrov AY, Shapiro JI. Partial nephrectomy as a model for uremic cardiomyopathy in the mouse. Am J Physiol Renal Physiol 294: F450–F454, 2008. [DOI] [PMC free article] [PubMed] [Google Scholar]
- 12.Kennedy DJ, Vetteth S, Periyasamy SM, Kanj M, Fedorova L, Khouri S, Kahaleh MB, Xie Z, Malhotra D, Kolodkin NI, Lakatta EG, Fedorova OV, Bagrov AY, Shapiro JI. Central role for the cardiotonic steroid marinobufagenin in the pathogenesis of experimental uremic cardiomyopathy. Hypertension 47: 488–495, 2006. [DOI] [PubMed] [Google Scholar]
- 13.Kometiani P, Tian J, Li J, Nabih Z, Gick G, Xie Z. Regulation of Na/K-ATPase beta1-subunit gene expression by ouabain and other hypertrophic stimuli in neonatal rat cardiac myocytes. Mol Cell Biochem 215: 65–72, 2000. [DOI] [PubMed] [Google Scholar]
- 14.Kubo M, Czuwara-Ladykowska J, Moussa O, Markiewicz M, Smith E, Silver RM, Jablonska S, Blaszczyk M, Watson DK, Trojanowska M. Persistent down-regulation of Fli1, a suppressor of collagen transcription, in fibrotic scleroderma skin. Am J Pathol 163: 571–581, 2003. [DOI] [PMC free article] [PubMed] [Google Scholar]
- 15.Sarnak MJ, Levey AS, Schoolwerth AC, Coresh J, Culleton B, Hamm LL, McCullough PA, Kasiske BL, Kelepouris E, Klag MJ, Parfrey P, Pfeffer M, Raij L, Spinosa DJ, Wilson PW. Kidney disease as a risk factor for development of cardiovascular disease: a statement from the American Heart Association Councils on Kidney in Cardiovascular Disease, High Blood Pressure Research, Clinical Cardiology, and Epidemiology and Prevention. Hypertension 42: 1050–1065, 2003. [DOI] [PubMed] [Google Scholar]
- 16.Sato Y Role of ETS family transcription factors in vascular development and angiogenesis. Cell Struct Funct 26: 19–24, 2001. [DOI] [PubMed] [Google Scholar]
- 17.Truong AH, Ben-David Y. The role of Fli-1 in normal cell function and malignant transformation. Oncogene 19: 6482–6489, 2000. [DOI] [PubMed] [Google Scholar]
- 18.Wadman IA, Osada H, Grutz GG, Agulnick AD, Westphal H, Forster A, Rabbitts TH. The LIM-only protein Lmo2 is a bridging molecule assembling an erythroid, DNA-binding complex which includes the TAL1, E47, GATA-1 and Ldb1/NLI proteins. EMBO J 16: 3145–3157, 1997. [DOI] [PMC free article] [PubMed] [Google Scholar]
- 19.Wallenstein S, Zucker CL, Fleiss JL. Some statistical methods useful in circulation research. Circ Res 47: 1–9, 1980. [DOI] [PubMed] [Google Scholar]
- 20.Wang Y, Fan PS, Kahaleh B. Association between enhanced type I collagen expression and epigenetic repression of the FLI1 gene in scleroderma fibroblasts. Arthritis Rheum 54: 2271–2279, 2006. [DOI] [PubMed] [Google Scholar]
- 21.Zhang XK, Gallant S, Molano I, Moussa OM, Ruiz P, Spyropoulos DD, Watson DK, Gilkeson G. Decreased expression of the Ets family transcription factor Fli-1 markedly prolongs survival and significantly reduces renal disease in MRL/lpr mice. J Immunol 173: 6481–6489, 2004. [DOI] [PubMed] [Google Scholar]
- 22.Zhang XK, Watson DK. The FLI-1 transcription factor is a short-lived phosphoprotein in T cells. J Biochem 137: 297–302, 2005. [DOI] [PubMed] [Google Scholar]


