

Abstract
The absorptive cells of the small intestine, enterocytes, are not generally thought of as a cell type that stores triacylglycerols (TGs) in cytoplasmic lipid droplets (LDs). We revisit TG metabolism in enterocytes by ex vivo and in vivo coherent anti-Stokes Raman scattering (CARS) imaging of small intestine of mice during dietary fat absorption (DFA). We directly visualized the presence of LDs in enterocytes. We determined lipid amount and quantified LD number and size as a function of intestinal location and time post-lipid challenge via gavage feeding. The LDs were confirmed to be primarily TG by biochemical analysis. Combined CARS and fluorescence imaging indicated that the large LDs were located in the cytoplasm, associated with the tail-interacting protein of 47 kDa. Furthermore, in vivo CARS imaging showed real-time variation in the amount of TG stored in LDs through the process of DFA. Our results highlight a dynamic, cytoplasmic TG pool in enterocytes that may play previously unexpected roles in processes, such as regulating postprandial blood TG concentrations.
Keywords: small intestine, dietary fat absorption, CARS microscopy
With obesity and cardiovascular disease being worldwide health issues, the impetus of understanding the parameters that govern energy intake and blood lipid concentration has emerged. Blood lipid concentration and a major portion of energy intake are regulated through the highly efficient process of dietary fat absorption (DFA) by the small intestine. Greater than 95% of dietary fat consumed is absorbed whether a low- or high-fat diet is consumed (1), as evidenced by the small amount of fat that is excreted in feces. In the small intestine lumen, dietary fat in the form of triacylglycerol (TG) is hydrolyzed to generate FFAs and monoacylglycerols (MGs) by pancreatic lipase. These products are then emulsified with the help of phospholipids and bile acids present in bile to form micelles. FFAs and MGs are then taken up by the absorptive cells of the small intestine, enterocytes, where they are resynthesized into TGs and incorporated into the core of chylomicrons (CMs), which are secreted via the lymphatic system into the circulation (2, 3).
Most current models of the synthesis of CMs show the resynthesized TG in this process entering the lumen of the endoplasmic reticulum (ER) where the assembly of CMs begins and do not highlight the potential for the resynthesized TG to enter a cytoplasmic TG storage pool unless there is a defect in CM synthesis or secretion (1, 3–8). In fact, wild-type mice fed a high-fat diet, or challenged with an oil bolus by oral gavage, are commonly reported as having no lipid droplet (LD) accumulation in enterocytes (9–11). Nevertheless, both indirect and direct evidence exists supporting the presence of a cytoplasmic storage pool in enterocytes. In humans, sequential meal tests demonstrated that CMs secreted after a second meal carried TG ingested in the first meal (12, 13). In rats, TG is synthesized within 30 s after an intraduodenal fat infusion (14); however, the secretion of TG into the lymph does not reach a steady state until 4 h after infusion, suggesting that the rate-limiting step in DFA is the transport of TG from the ER to the Golgi (15). This lead the investigators to hypothesize that during this time, TG resides on the cytoplasmic side of the ER for later secretion (16). In addition, more TG was found in the cytoplasm of enterocytes isolated from high fat compared with chow-fed rabbits by biochemical analysis (17). Finally, electron microscopy images of enterocytes from humans challenged with fat loads demonstrated the existence of a cytoplasmic TG pool (18). Resynthesized TG that first enters a cytoplasmic TG storage pool may not be immediately available for the synthesis of CMs; however, upon lipolysis and reesterification, it may then enter the lumen of the ER where the assembly of CMs begins. Nevertheless, whether a dynamic, cytoplasmic TG pool exists during the process of DFA remains unclear, as reviewed by Murphy (7). This is most likely due to the limitations of cell models for mimicking this process and methods for investigating this complex process in vivo.
Coherent anti-Stokes Raman scattering (CARS) microscopy is an emerging technique that permits vibrational imaging of specific molecules with three-dimensional submicron spatial resolution (19, 20). With a particularly strong CARS signal from C-H stretch vibration, CARS microscopy has been used for label- and fixation-free imaging of lipid domains in single bilayers (21), myelin sheath in nervous system (22), and LDs in adipocytes (23), foam cells (24), mouse skin (25), and Caenorhabditis elegans (26). These studies demonstrate the exciting possibilities of investigating the role of lipids in cell biology and physiology by CARS microscopy.
By label-free CARS imaging, we report direct visualization of LDs in enterocytes in fresh small intestine tissues from mice challenged acutely or chronically with dietary fat. In addition, we quantified the lipid amount and LD number and size by Image J analysis of CARS images. By combining CARS with fluorescence imaging, we show that these LDs are primarily located in the cytoplasm. Finally, we demonstrate real-time observation of a dynamic, cytoplasmic TG pool in enterocytes by in vivo CARS imaging of exposed small intestine. These results depict cytoplasmic TG accumulation and depletion within enterocytes of mice during the process of DFA.
MATERIALS AND METHODS
Mouse model
All procedures were approved by the Purdue Animal Care and Use Committee. All mice used in this study were C57BL/6J mice, 3–5 months of age, unless otherwise specified. The mice were maintained in a 12-h-light and 12-h-dark cycle, fed either a low-fat rodent chow diet (Harlan Teklad; no. 5053) or a high-fat, semipurified diet (Research Diet; no. D12492). DGAT1-deficient mice were bred and genotyped as described (27). In all experiments, mice were food deprived for 4 h before procedures were initiated unless specified. Gavage feeding needles (no. FTP-20-30) were purchased from Instech Solomon.
Tissue harvest and maintenance
Mice were first euthanized by ketamine/xylazine overdose. Small intestine tissue, from pylorus to cecum, was harvested and divided into five regions as shown in Fig. 1A. Each small intestine was first divided into three equal length segments. The first one-third was divided evenly and denoted as regions 1 and 2. The middle one-third was also divided evenly and denoted as regions 3 and 4. The last one-third was denoted as region 5. The intestine segments were subsequently rinsed in PBS (pH 7.0) several times to remove chyme until the rinse solution appeared clear. For intact tissue imaging, fresh tissues (5 mm) were placed in 3 ml DMEM (Gibco) supplemented with 20 mM HEPES (J.T. Baker), 100 U/ml penicillin-streptomycin (Gibco), and 10% FBS. Tissues kept at 4°C maintained good morphology over 5 h. Small intestine tissue was cut longitudinally and laid flat for luminal imaging as shown in Fig. 1A. All tissues were imaged within 3 h after euthanasia.
Fig. 1.

Validation of CARS microscopy for imaging LDs in enterocytes. A: Mouse small intestine was divided into five regions. Tissues from region 2 were cut open longitudinally and imaged in lumen view. B: CARS spectrum of lipids in the small intestine. C, D: CARS image of villi from wide type mice fasted 4 h. A monolayer of enterocytes constitutes the outer layer of each villus, and the microvilli are evident on the apical side of enterocytes. Inset of D shows a CARS image of two enterocytes. The cytoplasmic organelles show a bright contrast due to the abundant CH2 groups in their phospholipid membranes. The nuclei display a dark contrast. E, F: Enterocytes from DGAT1-deficient mice fed 50 μl oil via oral gavage and 3 h after gavage show a high level of LD accumulation with the diameter of LDs up to 9 μm. G, H: Enterocytes from mice fed 50 μl olive oil with 5 μl PL81 via oral gavage and 3 h after gavage show a high level of small LD accumulation. D, F, and H are zoom-in views of the squares in C, E, and G, respectively.
Isolation of enterocytes
The procedure of enterocyte isolation from small intestines followed a previously described protocol (28) and is provided in Supporting Information.
CARS and two-photon excited fluorescence imaging
CARS and two-photon excited fluorescence (TPEF) imaging were performed at the same multimodal microscope shown in supplementary Figure I (29). Pump and Stokes lasers were generated from two synchronized Ti:sapphire lasers (Tsunami; Spectra-Physics, Mountain View, CA) with a pulse width of 5 ps. These two lasers were tightly synchronized (Lock-to-Clock; Spectra-Physics), collinearly combined, and directed into a laser scanning confocal microscope (FV300/IX71; Olympus America, Center Valley, PA). A 60× water immersion objective [numerical aperture (NA) = 1.2] or a 20× air objective (NA = 0.75) were used to focus the laser beams into the sample. The average powers of the pump and Stokes beams at the sample were 40 and 30 mW, respectively. The epidetected CARS (E-CARS) signals were collected by the same objective for focusing, while the forward-detected CARS (F-CARS) signals were collected using an air condenser (NA = 0.55). External photomultiplier tube detectors (H7422-40 and R3896; Hamamatsu, Japan) were used to receive the E-CARS and F-CARS signals. In our experiments, the E-CARS and F-CARS images have almost the same contrast (see supplementary Figure III), indicating that E-CARS is a reflection of forward CARS signal (2). Therefore, E-CARS images were used when only the CARS signal was required unless specified. Within each figure, the same intensity scale was used for each panel. The total acquisition time is 3.26 s per image. F-CARS images were used when CARS and TPEF were combined to study colocalization of different structures because the forward channel is not sensitive to TPEF signal. TPEF signals were generated by the pump laser at the same excited wavelength (∼707 nm). For TPEF imaging, nucleus was labeled by Hoechst (Molecular Probe), and Golgi complex was labeled by BODIPY-ceramide (Molecular Probes). Two band-pass filters (hp520/40m-2p; Chroma) were used to transmit the fluorescence signal of Hoechst and BODIPY.
The CARS spectrum of a single villus was obtained from a series of CARS images of the same villus acquired at different Raman shifts. The pump wavelength was fixed, and the Stokes wavelength was manually tuned. The CARS intensity at each Raman shift was normalized by the peak power of the Stokes beam. For imaging lipids, the pump laser and the Stokes laser were tuned to 14,140 and 11,300 cm−1, respectively, to generate a Raman shift of ∼2,840 cm−1 that excites the symmetric CH2 vibration (19, 23). Band-pass filters (600/65 nm; Ealing Catalog) were used for transmission of the CARS signal at 588 nm. All imaging experiments were conducted at room temperature 22°.
Immunocytochemistry
Isolated enterocytes were used for all experiments involving immunocytochemistry. Immunolabeling was performed using a procedure modified from the literature (30) and is described in the Supporting Information.
Animal surgery for in vivo CARS imaging
The animal surgery procedure was modified from a method previously reported in the literature (31). Briefly, a mouse fed 300 μl olive oil via oral gavage was anesthetized by intraperitoneal injection of ketamine/xylazine (100 mg/kg ketamine and 10 mg/kg xylazine). After the mouse was in deep anesthesia, a longitudinal incision (2 cm) was made along the abdominal median line and a segment of the small intestine was exteriorized. An 8 to ∼10 cm section of the small intestine was exposed and a 2 cm section of the jejunum region was cut open longitudinally along the antimesenteric border and rinsed in prewarmed PBS (pH 7). The anesthetized mouse was placed in a custom-made stage affixed to the microscope stage. With the lumen facing downward, exteriorized jejunum segment was placed in a glass-bottomed dish affixed to the stage (see supplementary Figure II). The dish was filled with 37°C DMEM medium (1–2 ml). This opened section of small intestine was then examined on an inverted CARS microscope. The anesthetized animal was checked every 5 min to verify the status of anesthesia. The body temperature was maintained using warmed towels placed near the animal. Ketamine/xylazine (50 and 5 mg/kg) was readministered to maintain anesthesia during the imaging time.
Image J analysis
Small intestine tissue (region 2) from mice fed 300 μl olive oil via oral gavage and at different times after gavage were used for determination of lipid amount by Image J analysis (for 1, 3, and 6 h after gavage, n = 5 mice, for 12 h after gavage, and n = 3 mice). One to two villi were analyzed for each image depending on the view of different image. All of the images were acquired under the same experimental conditions, including laser power and photomultiplier voltage. We used adaptive thresholding to obtain a value of threshold for the identification of LDs. Because all of the images were taken under the same experimental condition, the same threshold value was then applied to analyze all of the images. The lipid amount as a percentage of area within each villus was calculated. The same method was used to calculate the lipid amount as a percentage of area in different regions of small intestine and to determine the average LD diameter in the in vivo CARS images. The images used for Image J analysis of LD size have an area of 235.5 × 235.5 μm with a pixel size of 0.46 μm.
Electron microscopy
Small intestine tissue (region 2 in Fig. 1A) from mice fed 300 μL olive oil, 3 h after gavage feeding were used. The electron micrographs of enterocytes were recorded on a FEI/Philips CM-10 bio-twin transmission electron microscope, and the procedure is described in Supporting Information.
Biochemical assay of TG concentration
The mucosa from region 2 (see Fig. 1A) was scraped, collected, flash frozen in liquid nitrogen, and stored at −80°C. Lipids in the mucosa were extracted by the HIP (hexane/isopropanol 3:2) method (32). Briefly, after homogenization of the mucosa with 1 M Tris-HCL (pH 7.4), HIP and water were added and then the mucosa sample was incubated for 30 min with occasional mixing. The upper part containing lipids was removed to a new tube. After evaporating the organic phase under nitrogen, lipids were dissolved in 2% Triton X-100 water solution. The amounts of TG were then determined by a WAKO L-Type TG determination kit (WAKO Chemicals) and were normalized to the protein concentration. The protein concentration was measured by a bicinchoninic acid protein assay (Pierce).
RESULTS
Validation of CARS microscopy for imaging LDs in enterocytes
We first examined the capability of our laser-scanning CARS microscope in fixation-free, label-free imaging of enterocytes in small intestine tissue dissected from mice. Fresh small intestine tissue representing the jejunum (from region 2, Fig. 1A) from mice fasted 4 h were cut open and the lumen was exposed to laser illumination. The CARS spectrum of villi exhibited a peak at 2840 cm−1 (Fig. 1B) corresponding to the symmetric CH2 vibration mode, with a resonant signal to nonresonant background ratio of 10:1. This mode images lipids abundant in fatty acids due to their abundant CH2 bonds. These lipids include phospholipids making up cell membranes and TGs present within the cell. The F-CARS signal at 2840 cm−1 was used to visualize the finger-like villi that cover the mucosal surface of the small intestine (Fig. 1C). Zoom-in images show that each villus was lined with a monolayer of enterocytes (Fig. 1D). For an individual enterocyte (inset of Fig. 1D), the nucleus did not produce a strong CARS signal and appeared as a dark hole in the CARS image. A layer of microvilli that constitutes the apical membrane of enterocytes was clearly identified. The F- and E-CARS images gave the same contrast (see supplementary Figure III), indicating that E-CARS signals are mainly contributed by back-reflection of forward CARS signals by the tissue. Therefore, E-CARS images were used when only the CARS signal was required unless otherwise specified.
To validate the applicability of CARS microscopy in mapping TG stored in cytoplasmic lipid droplets (CLDs) in small intestine, we used diacylglycerol acyltransferase 1 (DGAT1) deficient mice and PL81-treated mice that have previously been shown to have abnormal TG accumulation in CLDs in enterocytes. DGAT1 catalyzes the last step of TG biosynthesis (33, 34), and PL81 inhibits CM secretion in enterocytes (15, 35). We challenged DGAT1-deficient mice with 50 μl olive oil and C57BL/6J mice with 50 μl olive oil containing 5 μl PL81 administered via oral gavage after a 4 h fast. Three hours after gavage, we harvested small intestine tissues representing the jejunum (region 2, Fig. 1A) and imaged with CARS microscopy. Numerous LDs were found in enterocytes of both the DGAT1-deficient mice (Fig. 1E, F) and the PL81-treated mice (Fig. 1G, H) consistent with previous reports using other imaging techniques (15, 33).
To illustrate the advantages of CARS imaging, we performed oil red O (ORO) staining of fixed small intestine tissues and compared the CARS and ORO fluorescence signals. As shown in supplementary Figure IVA and B, the CARS signal and ORO fluorescence signal overlapped well. Compared with ORO labeling of fixed tissues, CARS microscopy provides a unique tool for label-free and fixation-free imaging of LDs in intact enterocytes. We have further used this tool to investigate LD accumulation and depletion during the DFA process in ex vivo and in vivo small intestine tissue, which cannot be done with current methods requiring tissue fixation and labeling.
Observation of LDs in enterocytes from mice fed a low- or high-fat diet
We fed mice a low- or high-fat diet for 3 weeks and imaged the small intestine tissue by CARS microscopy. We observed many more and larger LDs in enterocytes of mice fed a high-fat (Fig. 2C, D) compared with a low-fat (Fig. 2A, B) diet. These results demonstrate that enterocytes of mice store TG in LDs during the normal DFA process. However, large variations in the size and number of LDs were observed in different mice (data not shown), most likely due to the variation in when individual mice last ate before imaging. To better understand the roles of the observed LDs during DFA, we quantified LD accumulation and depletion using a gavage feeding model as described below.
Fig. 2.

TG storage in LDs correlates with amount of dietary fat consumed. A–D: CARS images of small intestine tissue (region 2) dissected from mice fed low-fat (A, B) and high-fat (C, D) diets for 3 weeks. A and C were taken with a 20× air objective. B and D were taken with a 60× water objective. E–H: CARS images of the small intestine from mice fed 50 μL (E, F) and 300 μl (G, H) olive oil via oral gavage, 3 h afer gavage. F and H are zoom-in views of the squares in E and G, respectively.
Quantification of LDs in enterocytes from mice administered dietary fat via oral gavage
To monitor LD accumulation with controlled feeding amounts and times after ingestion, we challenged mice after a 4 h fast with either 50 or 300 μl olive oil via oral gavage. We chose these amounts to approximate the amount of fat present in the intestinal lumen when fed a low- or high-fat diet, respectively. Small intestine tissues representing jejunum (region 2, Fig. 1A) were imaged by CARS microscopy 3 h after gavage. Sparsely distributed LDs were found in the enterocytes from mice fed 50 μl olive oil (Fig. 2E, F). In contrast, the small intestine from mice fed 300 μl olive oil exhibited a large amount of LDs with diameters up to 10 μm within enterocytes (Fig. 2G, H). Because of the strong CARS signal from TG stored in LDs, the CARS signal from phospholipids in the cell membranes of enterocytes was not as obvious as those of mice fed 50 μl olive oil. Notably, the goblet cells could be readily differentiated from enterocytes because there was no lipid accumulation in goblet cells (see supplementary Figure III). In summary, by comparing the images from mice fed no oil, 50 μl oil, and 300 μl oil, we observed a strong correlation between the amount, size of LDs, and the amount of dietary fat consumed.
Different regions of the small intestine play different roles in the process of DFA. To study regional differences in the small intestine in storage of TG in LDs, we dissected five representative regions of the small intestine (see Fig. 1A) from mice fasted for 4 h, fed 300 μl olive oil via oral gavage, and sacrificed at 3 h after gavage. LDs were observed in all five regions (see supplementary Figure VA–E) of the small intestine, with region 2 having the highest density of LDs. The same phenomenon was observed in enterocytes from 4 h fasted mice fed 50 μl olive oil via oral gavage at 3 h after gavage (see supplementary Figure VI). We quantified the CARS images by Image J analysis and found a higher amount of lipids in the proximal part than the distal part of the small intestine, with region 2 and region 5 having the highest and lowest amounts, respectively (Fig. 3A). These observations correspond well with the location of most DFA. We note that region 1 exhibited slightly smaller and fewer LDs than region 2. This result is probably due to the fact that dietary TGs in the part of the intestine most proximal to the stomach are not yet fully digested (2). To verify the CARS data, we extracted the lipids from the small intestine regions and quantified the amount of TG in each region by a colorimetric assay and found that these results were consistent with the Image J analysis, with the proximal jejunum (region 2, Fig. 1A) exhibiting the highest amount of TG (Fig. 3B). These results provide supporting evidence that the CARS signals were contributed by TG stored in LDs.
Fig. 3.

TG storage in LDs in enterocytes is small intestine region specific. A: Image J analysis of lipid amount in different regions (n = 5 mice, 5–6 villi per mouse were analyzed for each region). B: Biochemical TG analysis among different regions by a colorimetric assay (n = 3 mice).
LDs stored in enterocytes are primarily cytoplasmic
The strong CARS signal appears to be representing TG stored in LD within the cytoplasm of enterocytes; however, a signal from TG during DFA could be due to TG within the ER or Golgi complex as part of CMs (5, 36). To determine the subcellular localization of these LDs, we have combined CARS and fluorescence imaging on the same platform using florescent markers for nucleus, Golgi, and ER. For high-resolution subcellular imaging, we isolated enterocytes from mice that were fasted for 4 h, fed 300 μl olive oil via oral gavage, and euthanized at 3 h after gavage.
To visualize nuclei, we labeled the isolated enterocytes with Hoechst. The Hoechst-labeled nuclei and the LDs were visualized by epidetected TPEF (red) and F-CARS (green) signals, respectively. The images show that LDs of different sizes were located in the extranuclear area of enterocytes (Fig. 4A). To visualize the Golgi complex, we labeled isolated enterocytes with BODIPY ceramide. As shown in Fig. 4B, the TPEF signal from Golgi complex (red) had some overlap with CARS signal (green), which appears yellow in the image. The LDs in the overlapped region were quite small, and they most likely represent assembled CMs ready for secretion. To visualize the ER, we labeled fixed, isolated enterocytes with an antibody for protein disulfide isomerase (PDI). As shown in Fig. 4C, the signal from PDI immunofluorescence (red) was well separated from the CARS signal (green), showing that the majority of the LDs, especially large ones, were not located within the ER. To confirm that the large LDs are indeed cytoplasmic, we studied their association with adipophilin and the tail-interacting protein of 47 kDa (TIP47), which are both well known to associate with CLDs in many cell types (37). We labeled isolated enterocytes with an antibody for TIP47 or adipophilin. As shown in Fig. 4D, the signal from TIP47 immunofluorescence (red) formed a punctate circle surrounding LDs of different sizes (arrow) visualized by CARS (green). Meanwhile, we observed very weak immunofluorescence signal of adipophilin in isolated enterocytes (see supplementary Figure VII). These results suggest that the LDs are indeed CLDs and highlight the possibility that TIP47 and adipophilin may play different roles in the process of DFA.
Fig. 4.
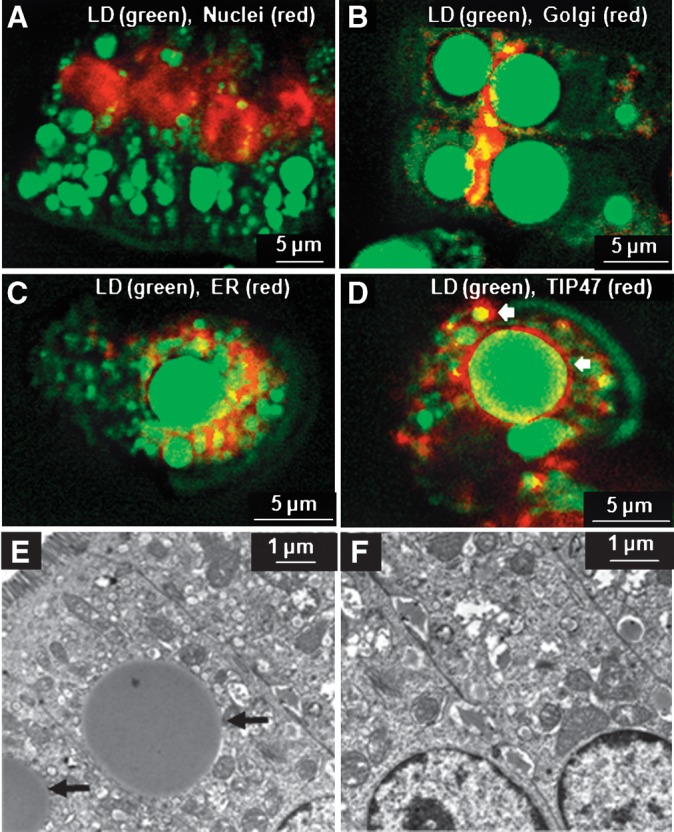
Subcellular localization of LDs by CARS (green) and fluorescence (red) microscopy. A: Enterocytes were labeled by Hoechst to visualize nucleus by TPEF. LDs were located in the extranuclear region. B: Enterocytes were labeled with BODIPY ceramide to visualize the Golgi complex by TPEF. Large LDs were located outside the Golgi complex, whereas some small LDs overlapped with the Golgi. C: Overlaid CARS and confocal fluorescence image of an isolated enterocyte labeled with PDI antibody used as an ER marker. Large LDs rarely overlapped with the PDI antibody signal. D: Overlaid CARS and confocal fluorescence image of an isolated enterocyte labeled with TIP47 antibody used as a marker of CLDs. The large LDs in enterocytes were coated with TIP47 protein. For A–D, enterocytes were isolated from mice fed 300 μl olive oil via oral gavage and sacrificed at 3 h afer gavage feeding. E, F: Electron microscopy images of single enterocytes in fixed small intestine tissues extracted from mice fed 300 μl olive oil and sacrificed at 3 h after feeding. Large LDs (indicated by arrows) are visible in the cytoplasm of some enterocytes (E). However, some enterocytes in the same tissue showed no LDs (F), indicating large cell-to-cell variability.
We further carried out an EM study to validate our CARS observations of CLDs in enterocytes. Small intestine samples from mice sacrificed at 3 h after gavage feeding of 300 μl olive oil were fixed and stained with imidazole-buffered osmium tetroxide. In some enterocytes, we observed large LDs that are neither associated with ER membrane nor Golgi complex (arrow, Fig. 4E). However, there is a large cell-to-cell variability in TG storage in CLDs. For example, some enterocytes in the same tissue showed no LDs (Fig. 4F). Therefore, EM is limiting for quantitative evaluation of LDs due to the use of thin slices and small observation areas to visualize individual cells. CARS microscopy overcomes such limitation by chemically selective imaging of LDs in a large area of fresh tissues.
In vivo CARS imaging reveals a dynamic, cytoplasmic TG pool during the DFA process
Finally, we investigated the time-dependent property of TG accumulation and depletion during the DFA process by in vivo imaging of mouse enterocytes at different times after oral gavage of 300 μl olive oil. An 8 to 10 cm section of the small intestine was exposed in a glass-bottomed dish (see supplementary Figure II) filled with 37°C medium, and a 2 cm section of the jejunum region was cut open to expose the villi to laser beams. The animal was kept physiologically active with a warm towel. At 1.5 h after gavage, small CLDs with an average diameter of 2.7 μm began to accumulate in the enterocytes (Fig. 5A, B). At 3 h after gavage, the CLDs became much larger with an average diameter up to 4.4 μm (Fig. 5C, D), indicative of fusion of LDs in the cytoplasm. At 6 h after gavage, the average diameter of LDs decreased to 3.5 μm (Fig. 5E, F). The physiological relevance of our in vivo data was verified by ex vivo CARS images (see supplementary Figure VIII) of enterocytes in small intestine tissues dissected from mice euthanized at specified times after gavage. The average diameter of CLDs in ex vivo fresh tissues showed an increase from 2.2 μm at 1 h to 5.1 μm at 3 h and a decrease to 3.4 μm at 6 h, which agrees well with the in vivo data. The amount of TG stored in LDs as a function of time after consumption were derived from Image J analysis of the ex vivo images and shown in Fig. 5G. The LD amount increased from 1 to 3 h, slightly decreased from 3 to 6 h, and became nearly depleted after 12 h digestion. These results show that TG storage in CLDs in enterocytes is highly dynamic throughout the DFA process.
Fig. 5.

In vivo CARS imaging demonstrates dynamic accumulation and depletion of TG in CLDs during the process of DFA. A, D: At 1.5 h after gavage of 300 μl olive oil, enterocytes were filled with small CLDs with an average diameter of 2.7 μm. B, E: At 3 h after gavage, larger CLDs with an average diameter of 4.4 μm were observed, implying the occurrence of LD fusion. C, F: At 6 h after gavage, compared with the level at 3 h after gavage, the CLD accumulation decreased with an average diameter of 3.5 μm. To estimate the change of lipid size in vivo at different times after gavage feeding, 8,897 LDs at 1.5 h, 3,595 LDs at 3 h, and 1,698 LDs at 6 h were used. D–F are zoom-in views of A–C, respectively. G: Variation of the amount of LDs based on the area of LD in enterocytes with different times after consumption of dietary fat. Ex vivo CARS images of region 2 small intestine tissues were obtained from five mice for 1, 3, and 6 h time points (at least 50 villi total at each time point) and from 3 mice for 12 h time point (40 villi) and analyzed by Image J software.
DISCUSSION
We directly visualized the presence of LDs in enterocytes based on the resonant CARS signal from symmetric CH2 stretch vibration. The LDs were confirmed to be primarily TG by biochemical analysis. Combined CARS and fluorescence imaging showed that these LDs were located in the cytoplasm and coated with TIP47. The amount of TG stored in enterocytes and the size of CLDs were quantified by Image J analysis and found to be highly dependent on the region of the intestine and directly correlated with amount of TG consumed. Furthermore, in vivo CARS imaging showed real-time variation in the amount of TG stored in enterocytes and size of CLDs throughout the process of DFA. CARS imaging is a unique tool that allows the label and fixation free method necessary and previously unavailable for doing these types of experiments. Together, these results highlight a dynamic, cytoplasmic TG pool in enterocytes that may play previously unexpected roles as discussed below.
DFA is a highly efficient process that may have evolved to insure the absorption of a highly energy-dense macronutrient during times when food was scarce. Mammalian enterocytes are constantly renewing and turn over every 3 to 4 days. Thus, mammalian enterocytes would not be considered a long-term TG storage depot as mammals have adipose tissue to serve this purpose. Nonetheless, the temporal storage of TG in CLDs allows the excess TG after a meal rich in dietary fat to be conserved within the cell as opposed to being excreted in feces. The storage of TG in CLDs after a meal rich in dietary fat may also alleviate lipotoxicity to enterocytes induced by high concentration of FFAs (38).
The dynamic storage of TG in CLDs highlights an underappreciated, regulatable pool of TG in enterocytes. After dietary TG is resynthesized in the ER of the enterocyte, it may be directly incorporated into CMs for secretion or temporarily stored in CLDs. In fact, the storage of TG in CLDs has been previously described in hepatocytes. Two DGAT enzyme activities in liver account for the synthesis of TGs, one on the cytoplasmic side of the ER for storage in CLDs and the other on the luminal side of the ER for the synthesis of lipoproteins (39). Mouse models with overexpression of DGAT1 or DGAT2 in liver showed that DGAT1 governs TG synthesis for secretion in lipoproteins, while DGAT2 overexpression contributes to CLD accumulation (40). There are at least three enzymes that catalyze the last step in TG biosynthesis in enterocytes: DGAT1, DGAT2, and diacylglycerol transacylase; however, their relative contributions remain unclear (3). The abnormal storage of TG in CLDs in enterocytes of DGAT1-deficient mice is consistent with the hypothesis that one or both of the other enzymes catalyzing this reaction has preference for synthesizing TG for storage in CLDs.
Our observation of TG storage in CLDs decreasing with time after feeding (Fig. 5) kindles the question about whether enterocytes are capable of hydrolysis of TG stored in CLDs. One possible candidate enzyme that may catalyze this reaction is pancreatic TG lipase. Pancreatic TG lipase has been identified in the cytoplasm of enterocytes (41, 42). It was suggested that this enzyme is able to hydrolyze cytoplasmic TG, but not TG restricted within membrane-bound organelles, such as the ER or Golgi complex. In addition, pancreatic TG lipase was shown to have much higher activity in the first quarter than the sum of the other three quarters of the small intestine. TG hydrolase is another enzyme that is expressed in enterocytes that may be involved in the hydrolysis of TG stored in CLDs (43). TG stored in CLDs has multiple potential fates after hydrolysis by intracellular lipases; the hydrolyzed products of TG may be transported back to the ER for TG resynthesis, packaging in CMs, and secretion into circulation via the lymphatic system. Alternatively, they may be secreted via the portal vein into circulation (44), oxidized within the enterocyte (45), and/or used for the synthesis of other lipids, such as cholesterol esters or phospholipids (46).
Based on the above discussion, we propose a revised model of TG metabolism within enterocytes (Fig. 6) to depict the role of TG storage in CLDs during DFA. This model is consistent with previous models describing TG storage and secretion in hepatocytes and enterocytes (7); however, it also integrates other potential metabolic fates of dietary fat within enterocytes that may play a role in DFA. In this model diacylglycerol is synthesized from the products of dietary fat digestion, MG and fatty acyl-CoA (step 1). TG is then synthesized from diacylglycerol and fatty acyl-CoA (step 2). The synthesized TG has two potential fates: direct incorporation into nascent CMs for secretion via the Golgi (step 3) or storage in CLDs. As LDs accrete in the ER membrane after high levels of dietary fat are consumed, large LDs within ER membranes bud off (47–49), thereby forming LDs in the cytoplasm (step 4). TG stored in CLDs may be hydrolyzed by pancreatic TG lipase or TG hydrolase. The hydrolyzed products have several potential fates within the enterocyte. They may be transported back to the ER to be used in esterification reactions resulting in the production of TG (step 5), phospholipids, or cholesteryl esters. Resynthesized TG would again be incorporated into nascent CM for secretion via the Golgi (step 3 and step 6). Alternatively, the hydrolyzed products of TG may be transported into circulation via the portal vein (step 7) or oxidized within the enterocyte. Transport proteins, such as L- and I-fatty acid binding proteins (L stands for liver, and I stands for intestine), could play important roles in transporting FFAs to the appropriate cellular location for metabolism. It should be noted that the existence of a cytoplasmic TG pool has been well accepted for hepatocytes where TGs are recycled and secreted in the form of VLDL; however, whether dietary fatty acids are deposited in CLDs in enterocytes or used directly for CM synthesis and secretion remains unclear (7, 50). Our observation of CLDs in ex vivo fresh tissues and in vivo provides direct evidence that dietary fatty acids enter a dynamic, cytoplasmic TG pool in enterocytes in response to a dietary fat challenge.
Fig. 6.
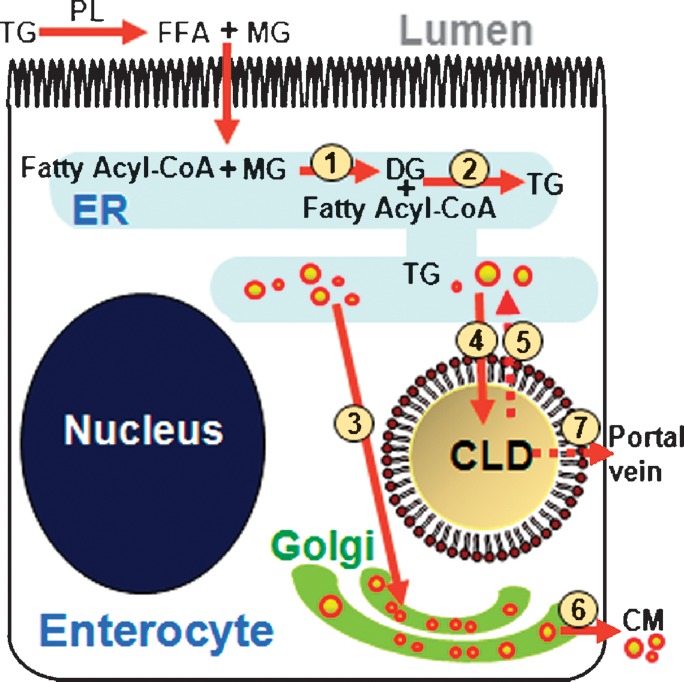
Model of the DFA process based on the finding of TG storage in CLDs within enterocytes. Dietary TG is hydrolyzed in the small intestine lumen by pancreatic lipase to FFA and MG. These products are taken up by the enterocyte where they are rapidly resynthesized in ER (steps 1 and 2) to form TG. Within the ER, the TG is packaged in the core of CMs where it is secreted via the Golgi complex into lymphatics (steps 3 and 6). Alternatively, TG synthesized in the ER may be stored in CLDs (step 4). TG stored in CLDs may be hydrolyzed by a lipase, such as pancreatic TG lipase or TG hydrolase. The hydrolyzed products of TG from CLDs may be transported back to the ER (step 5) and reenter the secretory pathway (steps 3 and 6) or excreted via the portal vein (step 7). Alternatively, hydrolyzed products may be catabolized within the enterocyte or used for other complex lipid synthesis, such as cholesterol esters or phospholipids (data not shown). DG, diacylglycerol; PL, pancreatic lipase.
It is interesting to compare the LDs observed in DGAT1−/− mice and PL81-treated mice. These two models have been known to accumulate CLDs in enterocytes. In our experiments, large LDs accumulate within the enterocytes in DGAT1−/− mice. PL81-treated mouse enterocytes do not show large LDs as observed in the DGAT1−/− mouse, although the overall LD storage level is high. The difference in LD size is possibly due to the different mechanisms involved in the formation of LDs by DGAT1 knockout and PL81 treatment. It was shown that PL81 could decrease the activity of microsomal TG transfer protein (15, 35) and affect the assembly of TG into nascent CMs in the ER. On the other hand, deficiency of DGAT1 is expected to inhibit the formation of CMs, resulting in a higher level of CLDs (33).
CONCLUSIONS
We directly observed a dynamic, cytoplasmic pool of TG in enterocytes by ex vivo and in vivo CARS imaging of mouse small intestine. This finding highlights new possibilities for regulation of the efficiency and/or rate of DFA by controlling the rate of hydrolysis by TG lipases, the transport rate of TG hydrolyzed products, or the FA oxidation rate in enterocytes. Future studies based on this finding may lead to development of new treatments to reduce postprandial hypertriglyceridemia, a risk factor for the development of cardiovascular disease, and/or improve energy balance by decreasing the energy intake portion of the equation that may ultimately be used to prevent and/or treat the problems of overweight individuals and obesity. Technically, our results demonstrate that CARS microscopy is capable of imaging intestinal TG storage and depletion in live animals. We expect that this study will open up a new approach to investigate the cell biology and physiology of TG metabolism in mammals.
Acknowledgments
The authors cordially thank Mr. Terry B. Huff and Mr. Han-wei Wang for help in optical imaging, Dr. Thuc T. Le for help in initial experiments, Ms. Yan Fu for sample preparation in electron microscoopy studies, Dr. Robert V. Farese, Jr. (Gladstone Institute of Cardiovascular Disease) for providing breeders for generating Dgat1−/− mice, and Dr. Nathan E. Wolins (Washington University School of Medicine, Saint Louis, MO) for providing TIP47, adipophilin, and PDI antibodies.
Abbreviations
CARS, coherent anti-Stokes Raman scattering
CLD, cytoplasmic lipid droplet
CM, chylomicron
DFA, dietary fat absorption
DGAT1, diacylglycerol acyltransferase 1
E-CARS, epidetected coherent anti-Stokes Raman scattering
ER, endoplasmic reticulum
F-CARS, forward-detected coherent anti-Stokes Raman scattering
LD, lipid droplet
MG, monoacylglycerol
NA, numerical aperture
ORO, oil red O
PDI, protein disulfide isomerase
TG, triacylglycerol
TIP47, tail-interacting protein of 47 kDa
TPEF, two-photon excited fluorescence
This work was partially supported by Purdue Research Foundation grants to J-X.C. and K.K.B. and institutional support to K.K.B.
Published, JLR Papers in Press, February 18, 2009.
Footnotes
The online version of this article (available at http://www.jlr.org) contains supplementary data in the form of eight figures.
References
- 1.Tso P., J. Balint, M. Bishop, and J. Rodgers. 1981. Acute inhibition of intestinal lipid transport by Pluronic L-81 in the rat. Am. J. Physiol. 241 G487–G497. [DOI] [PubMed] [Google Scholar]
- 2.Phan C. T., and P. Tso. 2001. Intestinal lipid absorption and transport. Front. Biosci. 6 d299–d319. [DOI] [PubMed] [Google Scholar]
- 3.Mansbach II C. M., and F. S. Gorelick. 2007. Development of physiological regulation of intestinal lipid absorption. II. Dietary lipid absorption, complex lipid synthesis, and the intracellular packaging and secretion of chylomirons. Am. J. Physiol. Gastrointest. Liver Physiol. 293 G645–G650. [DOI] [PubMed] [Google Scholar]
- 4.Christensen N. J., C. E. Rubin, M. C. Cheung, and J. J. Albers. 1983. Ultrastructural immunolocalization of apolipoprotein B within human jejunal absorptive cells. J. Lipid Res. 24 1229–1242. [PubMed] [Google Scholar]
- 5.Hamilton R. L., J. S. Wong, C. M. Cham, L. B. Nielsen, and S. G. Young. 1998. Chylomicron-sized lipid particles are formed in the setting of apolipoprotein B deficiency. J. Lipid Res. 39 1543–1557. [PubMed] [Google Scholar]
- 6.Dannoura A. H., N. Berriot-Varoqueaux, P. Amati, V. Abadie, N. Verthier, J. Schmitz, J. R. Wetterau, M-E. Samson-Bouma, and L. P. Aggerbeck. 1999. Anderson's disease: exclusion of apolipoprotein and intracellular lipid transport genes. Arterioscler. Thromb. Vasc. Biol. 19 2494–2508. [DOI] [PubMed] [Google Scholar]
- 7.Murphy D. J. 2001. The biogenesis and functions of lipid bodies in animals, plants and microorganisms. Prog. Lipid Res. 40 325–438. [DOI] [PubMed] [Google Scholar]
- 8.Black D. D. 2007. Development and physiological regulation of intestinal lipid absorption. I. Development of intestinal lipid absorption: cellular events in chylomicron assembly and secretion. Am. J. Physiol. Gastrointest. Liver Physiol. 293 G519–G524. [DOI] [PubMed] [Google Scholar]
- 9.Wang Y., H. Iordanov, E. A. Swietlicki, L. Wang, C. Fritsch, T. Coleman, C. F. Semenkovich, M. S. Levin, and D. C. Rubin. 2005. Targeted intestinal overexpression of the immediate early gene tis7 in transgenic mice increases triglyceride absorption and adiposity. J. Biol. Chem. 280 34764–34775. [DOI] [PubMed] [Google Scholar]
- 10.Drover V. A., M. Ajmal, F. Nassir, N. O. Davidson, A. M. Nauli, D. Sahoo, P. Tso, and N. A. Abumrad. 2005. CD36 deficiency impairs intestinal lipid secretion and clearance of chylomicrons from the blood. J. Clin. Invest. 115 1290–1297. [DOI] [PMC free article] [PubMed] [Google Scholar]
- 11.Nakano T., I. Inoue, I. Koyama, K. Kanazawa, K-i. Nakamura, S. Narisawa, K. Tanaka, M. Akita, T. Masuyama, M. Seo, et al. 2007. Disruption of the murine intestinal alkaline phosphatase gene Akp3 impairs lipid transcytosis and induces visceral fat accumulation and hepatic steatosis. Am. J. Physiol. Gastrointest. Liver Physiol. 292 G1439–G1449. [DOI] [PubMed] [Google Scholar]
- 12.Fielding B. A., J. Callow, R. M. Owen, J. S. Samra, D. R. Matthews, and K. N. Frayn. 1996. Postprandial lipemia: the origin of an early peak studied by specific dietary fatty acid intake during sequential meals. Am. J. Clin. Nutr. 63 36–41. [DOI] [PubMed] [Google Scholar]
- 13.Jackson K. G., M. D. Robertson, B. A. Fielding, K. N. Frayn, and C. M. Williams. 2002. Olive oil increases the number of triacylglycerol-rich chylomicron particles compared with other oils: an effect retained when a second standard meal is fed. Am. J. Clin. Nutr. 76 942–949. [DOI] [PubMed] [Google Scholar]
- 14.Mansbach II C. M., and P. Nevin. 1998. Intracellular movement of triacylglycerols in the intestine. J. Lipid Res. 39 963–968. [PubMed] [Google Scholar]
- 15.Tso P., J. A. Balint, and J. B. Rodgers. 1980. Effect of hydrophobic surfactant (Pluronic L-81) on lymphatic lipid transport in the rat. Am. J. Physiol. 239 G348–G353. [DOI] [PubMed] [Google Scholar]
- 16.Mansbach II C. M., and R. Dowell. 2000. Effect of increasing lipid loads on the ability of the endoplasmic reticulum to transport lipid to the Golgi. J. Lipid Res. 41 605–612. [PubMed] [Google Scholar]
- 17.Cartwright I. J., D. Plonne, and J. A. Higgins. 2000. Intracellular events in the assembly of chylomicrons in rabbit enterocytes. J. Lipid Res. 41 1728–1739. [PubMed] [Google Scholar]
- 18.Robertson M. D., M. Parkes, B. Warren, D. Ferguson, K. Jackson, D. Jewell, and K. Frayn. 2003. Mobilisation of enterocyte fat stores by oral glucose in humans. Gut. 52 834–839. [DOI] [PMC free article] [PubMed] [Google Scholar]
- 19.Cheng J. X., and X. S. Xie. 2004. Coherent anti-Stokes Raman scattering microscopy: instrumentation, theory, and applications. J. Phys. Chem. B. 108 827–840. [Google Scholar]
- 20.Cheng J. X. 2007. Coherent anti-Stokes Raman scattering microscopy. Appl. Spectrosc. 61 197A–206A. [DOI] [PMC free article] [PubMed] [Google Scholar]
- 21.Li L., and J. X. Cheng. 2008. Label-free coherent anti-Stokes Raman scattering imaging of coexisting lipid domains in single bilayers. J. Phys. Chem. B. 112 1576–1579. [DOI] [PubMed] [Google Scholar]
- 22.Wang H., Y. Fu, P. Zickmund, R. Shi, and J-X. Cheng. 2005. Coherent anti-Stokes Raman scattering imaging of axonal myelin in live spinal tissues. Biophys. J. 89 581–591. [DOI] [PMC free article] [PubMed] [Google Scholar]
- 23.Nan X., J. X. Cheng, and X. S. Xie. 2003. Vibrational imaging of lipid droplets in live fibroblast cells using coherent anti-Stokes Raman microscopy. J. Lipid Res. 44 2202–2208. [DOI] [PubMed] [Google Scholar]
- 24.Le T. T., I. M. Langohr, M. J. Locker, M. Sturek, and J. X. Cheng. 2007. Label-free molecular imaging of atherosclerotic lesions with multi-modal nonlinear optical microscopy. J. Biomed. Opt. 12 054007. [DOI] [PMC free article] [PubMed] [Google Scholar]
- 25.Evans C. L., E. O. Potma, M. Puoris'haag, D. Cote, C. P. Lin, and X. S. Xie. 2005. Chemical imaging of tissue in vivo with video-rate coherent anti-Stokes Raman scattering microscopy. Proc. Natl. Acad. Sci. USA. 102 16807–16812. [DOI] [PMC free article] [PubMed] [Google Scholar]
- 26.Hellerer T., C. Axang, C. Brackmann, P. Hillertz, M. Pilon, and A. Enejder. 2007. Monitoring of lipid storage in Caenorhabditis elegans using coherent anti-Stokes Raman scattering (CARS) microscopy. Proc. Natl. Acad. Sci. USA. 104 14658–14663. [DOI] [PMC free article] [PubMed] [Google Scholar]
- 27.Smith S. J., S. Cases, D. R. Jensen, H. C. Chen, E. Sande, B. Tow, D. A. Sanan, J. Raber, R. H. Eckel, and R. V. Farese. 2000. Obesity resistance and multiple mechanisms of triglyceride synthesis in mice lacking Dgat. Nat. Genet. 25 87–90. [DOI] [PubMed] [Google Scholar]
- 28.Xie Y., F. Nassir, J. Luo, K. Buhman, and N. O. Davidson. 2003. Intestinal lipoprotein assembly in apobec-1−/− mice reveals subtle alterations in triglyceride secretion coupled with a shift to larger lipoproteins. Am. J. Physiol. Gastrointest. Liver Physiol. 285 G735–G746. [DOI] [PubMed] [Google Scholar]
- 29.Wang H-W., T. T. Le, and J-X. Cheng. 2008. Label-free imaging of arterial cells and extracellular matrix using a multimodal CARS microscope. Opt. Commun. 281 1813–1822. [DOI] [PMC free article] [PubMed] [Google Scholar]
- 30.Wolins N. E., J. R. Skinner, M. J. Schoenfish, A. Tzekov, K. G. Bensch, and P. E. Bickel. 2003. Adipocyte protein S3–12 coats nascent lipid droplets. J. Biol. Chem. 278 37713–37721. [DOI] [PubMed] [Google Scholar]
- 31.Watson A. J. M., S. Chu, L. Sieck, O. Gerasimenko, T. Bullen, F. Campbell, M. McKenna, T. Rose, and M. H. Montrose. 2005. Epithelial barrier function in vivo is sustained despite gaps in epithelial layers. Gastroenterology. 129 902–912. [DOI] [PubMed] [Google Scholar]
- 32.Hara A., and N. S. Radin. 1978. Lipid extraction of tissues with a low-toxicity solvent. Anal. Biochem. 90 420–426. [DOI] [PubMed] [Google Scholar]
- 33.Buhman K. K., S. J. Smith, S. J. Stone, J. J. Repa, J. S. Wong, F. F. Knapp, Jr., B. J. Burri, R. L. Hamilton, N. A. Abumrad, and R. V. Farese, Jr. 2002. DGAT1 is not essential for intestinal triacylglycerol absorption or chylomicron synthesis. J. Biol. Chem. 277 25474–25479. [DOI] [PubMed] [Google Scholar]
- 34.Chen H. C., and R. V. Farese, Jr. 2005. Inhibition of triglyceride synthesis as a treatment strategy for obesity: Lessons from DGAT1-deficient mice. Arterioscler. Thromb. Vasc. Biol. 25 482–486. [DOI] [PubMed] [Google Scholar]
- 35.Fatma S., R. Yakubov, K. Anwar, and M. M. Hussain. 2006. Pluronic L81 enhances triacylglycerol accumulation in the cytosol and inhibits chylomicron secretion. J. Lipid Res. 47 2422–2432. [DOI] [PubMed] [Google Scholar]
- 36.Levy E., M. Mehran, and E. Seidman. 1995. Caco-2 cells as a model for intestinal lipoprotein synthesis and secretion. FASEB J. 9 626–635. [DOI] [PubMed] [Google Scholar]
- 37.Wolins N. E., D. L. Brasaemle, and P. E. Bickel. 2006. A proposed model of fat packaging by exchangeable lipid droplet proteins. FEBS Lett. 580 5484–5491. [DOI] [PubMed] [Google Scholar]
- 38.Listenberger L. L., X. Han, S. E. Lewis, S. Cases, R. V. J. Farese, D. S. Ory, and J. E. Schaffer. 2003. Triglyceride accumulation protects against fatty acid-induced lipotoxicity. Proc. Natl. Acad. Sci. USA. 100 3077–3082. [DOI] [PMC free article] [PubMed] [Google Scholar]
- 39.Owen M. R., C. C. Corstorphine, and V. A. Zammit. 1997. Overt and latent activities of diacylglycerol acytransferase in rat liver microsomes: possible roles in very-low-density lipoprotein triacylglycerol secretion. Biochem. J. 323 17–21. [DOI] [PMC free article] [PubMed] [Google Scholar]
- 40.Yamazaki T., E. Sasaki, C. Kakinuma, T. Yano, S. Miura, and O. Ezaki. 2005. Increased very low density lipoprotein secretion and gonadal fat mass in mice overexpressing liver DGAT1. J. Biol. Chem. 280 21506–21514. [DOI] [PubMed] [Google Scholar]
- 41.Rao R. H., and C. M. Mansbach. 1993. Alkaline lipase in rat intestinal mucosa: physiological parameters. Arch. Biochem. Biophys. 304 483–489. [DOI] [PubMed] [Google Scholar]
- 42.Mahan J. T., G. D. Heda, R. H. Rao, and C. M. Mansbach II. 2001. The intestine expresses pancreatic triacylglycerol lipase: regulation by dietary lipid. Am. J. Physiol. Gastrointest. Liver Physiol. 280 G1187–G1196. [DOI] [PubMed] [Google Scholar]
- 43.Lehner R., Z. Cui, and D. E. Vance. 1999. Subcellullar localization, developmental expression and characterization of a liver triacylglycerol hydrolase. Biochem. J. 338 761–768. [PMC free article] [PubMed] [Google Scholar]
- 44.McDonald G. B., D. R. Saunders, M. Weidman, and L. Fisher. 1980. Portal venous transport of long-chain fatty acids absorbed from rat intestine. Am. J. Physiol. 239 G141–G150. [DOI] [PubMed] [Google Scholar]
- 45.Windmueller H. G., and A. E. Spaeth. 1978. Identification of ketone bodies and glutamine as the major respiratory fuels in vivo for postabsorptive rat small intestine. J. Biol. Chem. 253 69–76. [PubMed] [Google Scholar]
- 46.Storch J., Y. X. Zhou, and W. S. Lagakos. 2008. Metabolism of apical versus basolateral sn-2-monoacylglycerol and fatty acids in rodent small intestine. J. Lipid Res. 49 1762–1769. [DOI] [PMC free article] [PubMed] [Google Scholar]
- 47.Murphy D. J., and J. Vance. 1999. Mechanisms of lipid-body formation. Trends Biochem. Sci. 24 109–115. [DOI] [PubMed] [Google Scholar]
- 48.Brown D. A. 2001. Lipid droplets: proteins floating on a pool of fat. Curr. Biol. 11 R446–R449. [DOI] [PubMed] [Google Scholar]
- 49.Martin S., and R. G. Parton. 2006. Lipid droplets: a unified view of a dynamic organelle. Nat. Rev. Mol. Cell Biol. 7 373–378. [DOI] [PubMed] [Google Scholar]
- 50.Gibbons G. F., K. Islam, and R. J. Pease. 2000. Mobilisation of triacylglycerol stores. Biochim. Biophys. Acta. 1483 37–57. [DOI] [PubMed] [Google Scholar]