

Abstract
The dynamics of visual selection and saccade preparation by the frontal eye field was investigated in macaque monkeys performing a search-step task combining the classic double-step saccade task with visual search. Reward was earned for producing a saccade to a color singleton. On random trials the target and one distractor swapped locations before the saccade and monkeys were rewarded for shifting gaze to the new singleton location. A race model accounts for the probabilities and latencies of saccades to the initial and final singleton locations and provides a measure of the duration of a covert compensation process—target-step reaction time. When the target stepped out of a movement field, noncompensated saccades to the original location were produced when movement-related activity grew rapidly to a threshold. Compensated saccades to the final location were produced when the growth of the original movement-related activity was interrupted within target-step reaction time and was replaced by activation of other neurons producing the compensated saccade. When the target stepped into a receptive field, visual neurons selected the new target location regardless of the monkeys’ response. When the target stepped out of a receptive field most visual neurons maintained the representation of the original target location, but a minority of visual neurons showed reduced activity. Chronometric analyses of the neural responses to the target step revealed that the modulation of visually responsive neurons and movement-related neurons occurred early enough to shift attention and saccade preparation from the old to the new target location. These findings indicate that visual activity in the frontal eye field signals the location of targets for orienting, whereas movement-related activity instantiates saccade preparation.
INTRODUCTION
To investigate the neural basis of the decision processes of saccade target selection, we have recorded neural activity in the frontal eye field (FEF) of macaque monkeys trained to perform visual search tasks (Bichot and Schall 1999; Bichot et al. 2001; Sato and Schall 2003; Sato et al. 2001; Schall 2004; Schall and Hanes 1993; Schall et al. 1995; Thompson et al. 1996, 1997). When monkeys have generalized experience with different search arrays, the initial response of visually responsive neurons does not discriminate between a target and distractors, but subsequently the activation of neurons with the target in their response field evolves to exceed the activity of neurons with a distractor in their response field. The target of the search array can be said to be selected when the activity becomes different. However, the visual search tasks in these experiments used static displays, so it remains unknown how the decision processes in FEF, or in other visuomotor areas, account for unexpected changes of salience in the image so that subjects can react effectively to the changing image.
To address this question, we used a perturbation task called search-step that combines visual singleton search with the classic double-step saccade manipulation (Becker and Jürgens 1979; Lisberger et al. 1975; Westheimer 1954; Wheeless et al. 1966). In no-step trials, monkeys shift their gaze to a color singleton in an array of homogeneous distractors. On random trials the target changes location before the saccade. If the target is presented in a visual search array with distractors, the target and one distractor are exchanged through an isoluminant color change, referred to as search-step. If the target is presented alone, the target is simply removed at one location and appears at another; this will be referred to as double-step. We will use the term target-step to refer to either the search-step or double step conditions. In these target-step trials, two outcomes are possible. Monkeys could shift gaze in error to the original target location (these are referred to as noncompensated saccades) or they could cancel the initial saccade and shift gaze directly to the final target location (these are referred to as compensated saccades). In target-step trials monkeys are reinforced only for producing compensated saccades. The probability of not compensating for the target step increases with the delay between presentation of the target (alone or in a search array) and the target step.
Performance in the target-step task has been understood as the outcome of a race between processes producing the alternative saccades (Becker and Jürgens 1979; Lisberger et al. 1975) in a manner paralleling the model of stop signal (countermanding) task performance as a race between a GO process that initiates movement and a STOP process that interrupts the GO process (Boucher et al. 2007; Logan and Cowan 1984). The mathematical model of countermanding performance provides the means to estimate the duration of the stop process; this is referred to as the stop signal reaction time (SSRT). The same analysis can be applied to double-step or search-step task performance to estimate target-step reaction time (TSRT). Subsequently, a formal race model was developed for double-step and search-step performance (Camalier et al. 2007). This model consists of three processes with stochastically independent finish times: 1) a GO process producing the saccade to the initial target location, 2) a STOP process interrupting the preparation of the saccade to the initial target, and 3) a second GO process producing the saccade to the final target location. This model was fit to search-step and double-step performance by monkeys and humans and was found to predict the probability and latency of correct and error saccades under different stimulus conditions. The model demonstrated that TSRT does indeed measure the duration of the covert stop process. Therefore the measure of TSRT from search-step task performance provides critical leverage for determining whether a particular neuron produces a signal sufficient to select the new location of a target and to control saccade production. Specifically, only neurons that modulate within TSRT can contribute to changing gaze behavior.
Other neurophysiological studies have used the double-step task to dissociate retinal from motor error signals by requiring monkeys to produce a sequence of saccades to the original and then the final location after the target is displaced (Gnadt and Andersen 1988; Goldberg and Bruce 1990; Mays and Sparks 1980; Tian et al. 2000). The emphasis on producing a sequence of two saccades is different from the emphasis on accuracy of the first saccade in the task we use. In fact, we have found that following as opposed to redirecting gaze in the double-step task results in different patterns of performance (Ray et al. 2004). Other investigators described the activity of neurons in the superior colliculus (SC) of monkeys responding to double-step targets (Lünenburger et al. 2003; Mohler and Wurtz 1976; Sparks 1978). However, ours is the first description of neural activity collected with systematic variation of target-step delay (TSD) to control the production of compensated and noncompensated saccades and analyzed in the context of the race model of performance. The results extend previous findings using this search-step task (Murthy et al. 2001, 2007) and have been presented in preliminary form (Murthy et al. 2000).
METHODS
Search and step tasks
Using positive reinforcement, three macaque monkeys were trained to perform visual search tasks in which they shifted gaze to a color singleton to receive fluid reward. Monkeys initiated each trial by fixating a central square for a variable amount of time (500–800 ms). This fixation stimulus disappeared simultaneously with the appearance of the target alone or in a search array, an eight-element circular array of isoluminant red and green squares. Across blocks of trials, the array consisted of a green singleton among red distractors or vice versa. For monkey F, the green was CIE x = 283, y = 612 and red was CIE x = 655, y = 327, with a luminance of 11.1 cd/m2. For the other monkeys, the green was CIE x = 281, y = 609 and red was CIE x = 632, y = 338, with a luminance of 13.4 cd/m2. Eccentricity of the stimuli was adjusted according to the location of the response field of each isolated neuron. To equate visibility, stimuli were scaled for eccentricity according to cortical magnification (Rovamo and Virsu 1979). In ≥50% of trials the color singleton target remained at its original location (no-step trials) and monkeys were reinforced for shifting gaze to it (Fig. 1). In other trials, the search array was presented but then, following a variable TSD, the target appeared at a new location in the array. In other words, after the TSD, the target and one distractor swapped positions through an isoluminant color change. We refer to these trials as target-step trials. This target displacement manipulation was done when the target was presented in a search array (search-step) or when the target was presented alone (double-step). To prevent monkeys from withholding saccades, no more than 50% of trials were target-step trials (Emeric et al. 2007). In a typical daily session the color of the target did not switch. Across sessions, the target and distractor colors were switched by using the complementary search array. The search-step and double-step conditions were performed in blocks, one after another when spike isolation persisted for a long enough duration.
FIG. 1.

Search-step and double-step tasks. Following fixation of a central spot a color singleton was presented with 7 distractors (top) or alone (bottom). On random trials the singleton stepped to a different location across the array after a variable delay. Performance on these target-step trials was probabilistic. Monkeys were rewarded for canceling the original saccade and producing a compensated saccade to the new singleton location. Noncompensated saccades to the original singleton location were errors; such errors were almost always followed by unrewarded corrective saccades to the final singleton location.
When the target stepped to a new location, performance was probabilistic with two possible responses. A compensated saccade (also referred to as a “final angle response” in the literature) to the final target location was reinforced. A noncompensated saccade (“initial angle response”) to the original target location was not reinforced. The probability of executing a compensated or noncompensated saccade varied with the TSD, which was titrated to ensure an approximately equal number of compensated (correct) and noncompensated (error) responses. The TSD was increased following a compensated saccade and decreased following a noncompensated saccade in a staircase procedure typically involving the use of five to seven delays at 16.6-ms (refresh rate) intervals. Given idiosyncrasies across monkeys and demand differences across tasks, TSDs typically varied between 50 and 300 ms to achieve 50% correct target-step trials. However, the value of target-step reaction time was not affected by the staircasing procedure used (Nelson et al. 2008).
During neurophysiological data collection, the target appeared with equal probability at each of the eight possible array positions. However, in target-step trials the number of initial and final target locations was restricted to increase the yield of data. This was accomplished through the following procedure. The response field of the neuron was localized; the response fields of FEF neurons commonly occupy two or three array positions. Therefore on target-step trials the initial and final target locations were restricted to the three array positions centered on the response field and the three positions symmetrically opposite in the array. The target never stepped within or beside the response field. This amounts to 18 target-step combinations (6 possible initial target locations × 3 possible final locations for each initial location). Consequently, the target only stepped into or out of the response field. Target-step combinations were randomized and interleaved with no-step trials. In preliminary sessions during which only performance was monitored, target steps were completely randomized across all array locations. Performance did not differ from that obtained in the neurophysiological sessions. The behavioral data indicated that the monkeys could not predict the location of the target or the occurrence of target-step trials.
Data collection
Data were collected from three adult monkeys (two Macaca mulatta and one Macaca radiata) weighing 7–12 kg. The animals were cared for in compliance with the Guide for the Care and Use of Laboratory Animals and the guidelines of the Vanderbilt Animal Care and Use Committee. Surgical and data collection methods have been described in detail elsewhere (Schall et al. 1995). Briefly, monkeys were seated within a magnetic field to monitor eye movements using the scleral search coil technique. Experiments were under the control of a computer running TEMPO VideoSync (Reflective Computing) that controlled stimulus presentation (Sony Trinitron 500-PS monitor), recorded eye movements (250 Hz) and single-unit activity (1 kHz), and delivered the juice reward. Saccades were detected off-line by an algorithm that first detected a significant elevation in velocity (>30°/s), then defined the beginning and end of the monotonic change in eye position lasting ≥12 ms before and after this high-velocity movement. Neural activity was recorded with insulated tungsten microelectrodes (1–5 MΩ; FHC) that were introduced to the cortex through guide tubes positioned in a grid (Crist et al. 1988) and advanced with a hydraulic microdrive (FHC). Action potentials were amplified, filtered, and discriminated using a BAK analog time-amplitude window discriminator. Single units were included in the present sample if the amplitude of the action potential was sufficiently above background to reliably trigger the time-amplitude window discriminator, the wave shape was invariant, and the neuron isolation was sustained for a sufficient time to allow behavioral data to be collected.
Race model analysis of behavior
Performance in target-step trials has been described as the outcome of a race between a process producing the noncompensated saccade and a process producing the compensated saccade (Becker and Jürgens 1979; Lisberger et al. 1975). Performance in a saccade-countermanding (stop signal) task that requires only canceling a planned saccade can be accounted for by a formal race model (Logan and Cowan 1984). We have recently shown that double-step and search-step performance of macaques and humans can be accounted for quantitatively by the same formal model of finish times, but with two processes producing the alternative saccades and a stop process that interrupts the first process (Camalier et al. 2007). This race model defines a quantity called target-step reaction time (TSRT), which is the time needed to cancel the partially prepared initial movement in response to the displacement of the target. TSRT is formally equivalent to the stop signal reaction time defined in the stop signal (countermanding) task (Logan and Cowan 1984). In an interactive race model of countermanding saccades, we have found that stop signal reaction time measures the latency of an active inhibition process (Boucher et al. 2007). Likewise, the independent race model of double-step and search-step performance confirms that TSRT measures the latency of the stop process that interrupts the process that would produce the noncompensated saccade to the initial target location (Camalier et al. 2007).
According to the race model, TSRT demarcates the time at which a subject changes from producing erroneous noncompensated saccades to producing correct compensated saccades to the final target location. Figure 2 illustrates how TSRT is derived from the compensation function and the response time distribution. The portion of the distribution before TSRT represents those trials in which the saccade was produced before the time required inhibiting that response because of the target step. Consequently, these target-step trial responses are those noncompensated saccades that would have been directed to the initial target location. The portion of the distribution following TSRT contains trials in which adequate time elapsed to cancel the partially prepared saccade to the initial target location and produce a compensated saccade to the new target location following its step. Generally speaking, the moment that TSRT elapses measures the maximum noncompensated saccade latency and the minimum compensated saccade latency.
FIG. 2.
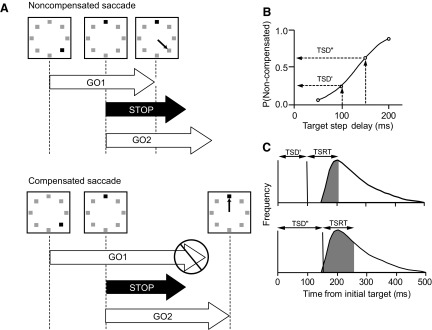
Race model of performance. A: illustration of 3 processes necessary to explain performance; each has stochastic and independent finish times. A go process is initiated following the initial presentation of the array (GO1); its termination time corresponds to the response time on no-step trials. The target step elicits a stop process that can interrupt the first go process (STOP) and another go process (GO2); its termination time corresponds to the response time of the saccade to the final target location. Noncompensated saccades are produced when GO1 finishes before STOP; the finish time of GO2 on these trials corresponds to the latency of the corrective saccades to the final target location. Compensated saccades are produced when STOP finishes before GO1, which interrupts completion of GO1 (indicated by the cross-out symbol) and permits termination of GO2 that produces a saccade to the final target location. B: compensation function with the probability of noncompensated saccades highlighted for shorter and longer target-step delays (TSD′ and TSD″, respectively). C: illustration of how target-step reaction time (TSRT) is determined. Gray area in each distribution of response times in no-step trials corresponds to the probability of noncompensated saccades for shorter (TSD′) and longer (TSD″) delays. TSRT measures the longest latency of noncompensated saccades that are initiated before the STOP process finishes. The portion of the response time distribution above TSRT corresponds to GO1 finish times longer than the finish time of the STOP process (TSRT); this is the fraction of trials in which compensated saccades are produced to the final target location.
The fraction of noncompensated saccades plotted as a function of TSD is referred to as the compensation function, which shows the relation between the primary independent variable—the TSD—and its effects on behavior, which also depend on the form of the response latency distributions. Shorter response latencies translate into greater probabilities of errantly committing a noncompensated response. The probability of making a noncompensated response is drawn from this compensation function to calculate the TSRT at a particular TSD. The time at which this probability equals the proportion of saccades made in the no-step distribution subtracted from the TSD gives the TSRT at that delay. In other words, the no-step latency giving that proportion is equivalent to the minimum latency of no-step saccades that would have been reprogrammed had a target step occurred; this latency represents the finish time of interrupting the preparation of the first saccade process. TSRT for a particular TSD is calculated by integrating the no-step saccade latency distribution from 0 ms until the integral equals the proportion of noncompensated saccades at that TSD. The no-step latency value at the limit of that integral defines the minimum no-step saccade latency that could have been compensated if the target had stepped, thus representing the completion of the compensation process. This method of calculation assumes that TSRT is constant. Violation of this implausible assumption does not change the outcome if TSRT does not covary with the no-step saccade latency (Band et al. 2003; DeJong et al. 1990). We also calculated TSRT with a second method that does not assume that TSRT is constant. Here the difference between the mean no-step saccade latency and the TSD at which 50% of the noncompensated responses are generated (i.e., mean of the compensation function) is used to estimate the mean TSRT. The mean of the compensation function was determined by fitting a cumulative Weibull function, W(t), to the compensation function. An estimate of the mean of the best-fit compensation function was given by W(t) = γ − (γ − δ) × exp[−(t/α)β], where t ranges from the minimum to the maximum step delay, α is the time at which the compensation function reaches 64% of its maximum value γ, β is the slope, and δ is the minimum value.
Estimating TSRT from the behavioral data provided an unprecedented opportunity to relate the time course of neural modulation to visual selection and motor preparation. A TSRT value is derived for each neuron individually based on the behavior while that neuron was recorded; then two criteria can be applied to distinguish neurons that are directly involved in visual target selection and saccade preparation. First, a neuron must respond differently prior to a compensated saccade versus a noncompensated saccade. Second, this difference in activity must arise before TSRT has elapsed. If the visual and motor processing needed to generate a saccade to the first target finishes before TSRT, gaze is directed in error to the first target location (i.e., noncompensated response). However, if the TSRT is reached before the preparation of the saccade to the first target is finished, then a correct saccade directed to the second target location is produced (i.e., compensated response). Activity subsequent to TSRT elapsing cannot affect gaze-shifting behavior. In this way, search-step data reveal the minimum time needed for neurons to be influenced by new perceptual information.
Analysis of neural activity
Measurements of neural discharge were accomplished by converting discrete spike times to continuous spike density functions by convolving spike trains with a combination of growth and decay exponential functions that resembled a postsynaptic potential given by R(t) = [1 − exp(−t/τg)] × [exp(−t/τd)], where rate as a function of time [R(t)] varies according to the time constant for the growth phase (τg) and the time constant for the decay phase (τd). Physiological data from excitatory synapses indicate that τg = 1 ms and τd = 20 ms (Kim and Connors 1993; Sayer et al. 1990). The rationale for this approach was to derive physiologically plausible spike density functions as described elsewhere (Hanes and Schall 1996; Hanes et al. 1998; Thompson et al. 1996). To obtain robust spike density functions, we selected a set of trials at a TSD (±17 ms) that provided the maximum number of trials.
To quantify the degree to which neurons selectively modulated across the different step conditions (i.e., target stepping into or out of the receptive field), ratios of activity on step trials to activity on latency-matched no-step trials were calculated. These step response ratios used the mean level of activation during the 40 ms spanning TSRT. This was done to allow for small errors in the estimation of TSRT. Additionally, these ratios were calculated in the 20-ms interval prior to the mean noncompensated saccade latency; these results did not vary substantially from the results reported in the following text. Geometric means of these ratios are provided in the following text in addition to the more common arithmetic mean because geometric means are invariant to inversion of the numerator (step trial activity) and denominator (no-step trial activity) that generate a step response ratio and are less affected by outliers.
Besides the magnitude we also quantified the time course of the differential activity during step trials and latency-matched no-step trials. The average spike density functions in step trials and latency-matched no-step trials were compared as a function of time from target presentation. To perform this time-course analysis, we subtracted the average spike density function for step trials from the average spike density function during latency-matched no-step trials. This subtraction was performed for neurons with visually evoked activity and for neurons with movement-related activity. The resulting spike density functions will be referred to as differential spike density functions. The time at which significant differential activity began during step trials and latency-matched no-step trials was defined as the instant when the differential spike density function exceeded by 2SDs the mean difference in activity during the 200-ms interval before target presentation, provided the difference reached 6SDs and remained above the 2SD threshold for 50 ms. Estimation of the time of differential activity allows us to establish a criterion that identifies neurons that play an active role in target selection and control of eye movements. Such neurons must modulate with the behavior and must occur prior to the TSRT. Otherwise these neurons would not be able to control the performance as demanded by the task. The time interval between the defined onset of differential activity and the average TSRT was then determined and is referred to as neural discrimination time.
The time of modulation of neurons was also determined using receiver operating characteristic (ROC) analysis (Green and Swets 1966), as previously described (Thompson et al. 1996). The spike density functions from sets of either compensated or noncompensated step trials were compared with those from latency-matched no-step trials. Spike trains from the original sets of trials were bootstrapped to construct 500 simulated spike trains in each set for reliable comparison. Comparisons were conducted by calculating ROC curves for successive 1-ms bins, starting at the time of array or target presentation and continuing until all saccades were initiated. The area under the ROC curve provides a quantitative measure of the separation between two distributions of activity. An area under the ROC curve value of 0.5 signifies that the two distributions being compared are completely overlapped, whereas an extreme value of 0.0 or 1.0 signifies that the two distributions do not overlap. To describe the growth in the area under the ROC curve over time, the data were fit with a cumulative Weibull distribution function. The time of differential activity was determined from the growth of the ROC area over time and was defined as the time when the ROC area reached a value of 0.7.
RESULTS
Search-step and double-step behavioral performance
In a previous report we described in detail the performance of individual monkey and human subjects (Camalier et al. 2007). Figure 3 and Table 1 summarize the behavioral results obtained, which collectively validate the applicability of the race model to explain monkeys’ performance in search-step and double-step tasks. Figure 4 plots the compensation functions averaged across all the search-step and double-step trials separately for each monkey. Following the shortest TSDs, monkeys more often canceled saccades to the original target location and produced compensated saccades to the final target location. As the TSD increased, monkeys increasingly failed to withhold the saccades to the original target location and produced noncompensated saccades.
FIG. 3.

Saccade latencies. Left: no-step (thin lines) and target-step latency distributions (thick lines) in the search-step task in which compensated (solid black) and noncompensated saccades (dotted black) were made. Gray line shows the distribution of compensated saccade latencies relative to corresponding TSDs. Right: double-step latencies with conventions as above.
TABLE 1.
Saccade latencies (ms)
| Monkey | No-step |
Target-noncompensated | Target-compensated—TSD | |||
|---|---|---|---|---|---|---|
| Search-Step | Double-Step | Search-Step | Double-Step | Search-Step | Double-Step | |
| C | 215 ± 44 | 194 ± 49 | 204 ± 27 | 179 ± 28 | 216 ± 37 | 200 ± 31 |
| F | 229 ± 66 | 221 ± 49 | 201 ± 32 | 199 ± 27 | 217 ± 54 | 232 ± 42 |
| L | 229 ± 41 | 262 ± 48 | 219 ± 27 | 245 ± 32 | 222 ± 38 | 246 ± 37 |
Values are mean ± SD. Compensated saccade latencies were measured relative to the target step.
FIG. 4.

Performance in search-step (black) and double-step (gray) tasks from combined experimental sessions for each monkey. Each data point represents the probability of making a noncompensated saccade at a given TSD. Corresponding data points are fitted with a cumulative Weibull distribution function (see methods) to generate a compensation function.
According to the race model, a compensated saccade is produced if the process producing the original saccade is interrupted. The latency of this interruption is TSRT. TSRT was estimated from the mean of the compensation function and by the method of integration applied to the data for each session. TSRTs estimated by the two methods can vary depending on the particular distribution of the no-step reaction times and the shape of the compensation function. Because there is no a priori reason to weight one method of estimation over the other, we averaged both estimates to obtain a single TSRT for each session. Across the three subjects, TSRT (±SD) was 123 (±19) ms for search-step and 96 (±33) ms for double-step trials. TSRT values for double-step trials tended to be less than those for search-step trials (Fig. 5, Table 2) [t(87) = 4.32, P < 0.001]. More details about performance can be found in Camalier et al. (2007).
FIG. 5.

Distributions of target-step reaction times for each monkey during the search-step (black) and double-step (white) tasks.
TABLE 2.
Target-step reaction time (ms)
| Monkey | Search-step |
Double-step | ||
|---|---|---|---|---|
| Mean | Integration | Mean | Integration | |
| C | 116 ± 15 | 114 ± 15 | 103 ± 10 | 103 ± 10 |
| F | 130 ± 16 | 128 ± 15 | 89 ± 6 | 82 ± 13 |
| L | 116 ± 27 | 125 ± 26 | 69 ± 11 | 72 ± 23 |
Values are mean ± SD.
Overview of physiological analyses
FEF units were recorded from the rostral bank of the arcuate sulcus, which was determined by sulcal landmarks during craniotomies for monkeys C and F and confirmed via structural magnetic resonance imaging scans and microstimulation in monkey L. In all, 76 neurons exhibiting task-related modulation were recorded from five hemispheres while the three monkeys performed the search-step task. For 14 of these neurons, data were also collected during performance of the double-step task using a blocked design. The FEF contains diverse neurons that can be distinguished functionally, with the majority of neurons exhibiting visual responses and many others associated with saccade preparation (Bruce and Goldberg 1985; DiCarlo and Maunsell 2005; Hanes et al. 1998; Helminski and Segraves 2003; Schall 1991; Segraves and Goldberg 1987; Sommer and Wurtz 2001). Recent evidence for biophysical differences among cell types in FEF has been provided (Cohen et al. 2009). Neurons with visual responses and presaccadic movement-related activity were distinguished with the conventional memory-guided saccade task (Bruce and Goldberg 1985; Hikosaka and Wurtz 1983) and visual inspection of patterns of modulation before visually guided saccades. Visual activity was a brisk response following the presentation of a flashed visual stimulus. Movement-related activity was identified as a progressively increasing discharge rate preceding saccade initiation and a return to baseline following the saccade. Many neurons with visual responses lack the buildup of activity before a saccade into the response field. Most neurons with movement-related activity also have a measure of a visual response, but a fraction sampled did not. To quantify the relative magnitude of visual and movement activity in the memory-guided saccade task, a visual-movement index (VMI) was calculated for each neuron. Visual activity (VA) was defined as the mean firing rate above the spontaneous activity of the neuron in a time window 0 to 200 ms after stimulus onset. Movement activity (MA) was defined as the mean firing rate above the same spontaneous activity of a time window 50 to 0 ms before saccade onset. The spontaneous activity was measured as the mean firing rate in a span of 800 to 400 ms before the stimulus onset. VMI was calculated as VMI = (VA − MA)/(VA + MA). Therefore neurons with comparatively higher movement activity yield negative VMI and neurons with greater visual activity yield positive VMI. Visuomovement neurons that responded to the target onset and discharged before saccade onset yield VMI values between pure visual and pure movement neurons. The average VMI (±SE) for movement, visuomovement, and visual neurons were −0.19 (±0.06), 0.16 (±0.07), and 0.17 (±0.07), respectively, which were significantly different from each other [ANOVA, F(2,75) = 8.53, P < 0.001].
For this report, we analyzed the activity of 24 visual, 28 visuomovement, and 24 movement neurons that provided sufficient data to accomplish the range of analyses. The events in the task and the performance of the monkeys results in several different kinds of trials. Thus the results of a progression of analyses will be presented. We will describe the pattern of modulation when the target stepped into the receptive field and monkeys either compensated by shifting gaze directly to the final target location or failed to compensate by shifting gaze to the original target location outside the receptive field. We will also describe the pattern of modulation when the target stepped out of the receptive field and monkeys either compensated by shifting gaze directly to the final target location or failed to compensate by shifting gaze to the original target location inside the receptive field. In addition to describing how neural representations in FEF respond to unexpected changes of salience in the image so that monkeys can react effectively, the dissociation between the target location and saccade direction that is created by target steps enhances cell classification beyond that provided by the conventional memory-guided task. The theoretical thrust of the analyses is guided by the previous success applying the race model of stopping to analyze neural activity in the FEF (Hanes et al. 1998) and SC (Paré and Hanes 2003) of monkeys performing a saccade-countermanding task. One of the key results of those studies was that neurons with movement-related activity, but not neurons with only visual responses, modulated activity within the stop signal reaction time. This result demonstrated that neurons with only visual responses did not produce activity sufficient to control saccade initiation. In contrast, neurons with the presaccadic movement-related buildup of activity and fixation neurons did produce activity sufficient to control whether and when a saccade was initiated. We will analyze the data collected during search-step and double-step performance in the same manner, using TSRT as a measure of the interval in which the critical events must transpire to encode the target step and to cancel the original saccade plan to produce the compensated saccade to the final target location. As in these previous studies, we will distinguish visual responses from movement-related activity.
Visual response when the target steps into the receptive field
Figure 6 shows the activity of a representative visually responsive neuron. This neuron responded robustly when a visual stimulus was presented in its response field. Figure 6A illustrates the selection process by which this neuron's activity can distinguish the presence of a target or a distractor in its receptive field. The neural representation of the target was elevated relative to a distractor representation that was reduced or suppressed. Activity was recorded on no-step trials in which the monkey correctly shifted gaze to the target. As shown before (Thompson et al. 1996), the initial increase of activity was identical when the stimulus in the response field was a target or a distractor. Activity continued to increase when the target was in the response field, whereas the spike rate decreased for a distractor. The point at which the two rates of activity began to diverge significantly defines the target selection time. This neuron selected the target in its response field 110 ms following the presentation of the search array.
FIG. 6.

Visually responsive neuron during target-step trials in the search-step task when a distractor in the receptive field became the target. Stimulus conditions and saccade direction are diagrammed above the spike density functions; the solid gray circle indicates the location of the neuron's receptive field that shifted to a location where the receptive field would reside after the saccade. The range of saccade latencies is marked on the time axis by the open bar. The vertical red arrow marks the time of differential activity during (A) no-step trials when the target was in the receptive field (thick line) compared with no-step trials when distractors were in the receptive field (thin line). B: compensated step trials when the target stepped into the receptive field 67 ms after array presentation (blue solid line) compared with latency-matched no-step trials with distractors in the receptive field (thin black line). The solid vertical line indicates TSD. TSRT is indicated by the dashed vertical line. The horizontal bar on the time axis indicates the range of compensated saccade latencies. C: noncompensated step trials when the target stepped into the receptive field 67 ms after array presentation (blue dotted line) compared with latency-matched no-step trials with distractors in the receptive field (thin black line). The horizontal bar on the time axis indicates the range of noncompensated saccade latencies.
Measuring the neural response during no-step saccades does not rule out the possibility that the high maintained spike rate associated with the target being in the response field is because that stimulus will be the endpoint of the impending saccade. Distinguishing visual and movement-related processes is difficult because the target and the saccade are in the same location in space. The search-step task, however, creates the dissociation of selecting the target and preparing saccades when the monkey shifts gaze away from the singleton target location. Modulation on target-step trials is contrasted with activity recorded during no-step trials when the monkey correctly shifted gaze to the target location (Fig. 6, B and C). Activity when the target steps into the neuron's response field is compared with activity in no-step trials in which a distractor remained in the response field for the duration of the trial. In this way, the moment that differential activity arises shows how quickly FEF neurons can respond to new visual input. Activity on other trials in which the target steps out of the response field is compared with correct no-step trials in which the target occupied the response field throughout the trial. Differential activity in this comparison reveals that the neuron responds to the disappearance of the target by reducing the representation of the original target location. Critically, these comparisons require matching for saccade latency. As shown earlier, target-step trials with compensated and noncompensated saccades differ in saccade latency. Therefore to ensure valid comparisons, activity on target-step trials must be compared with that subset of no-step trials that have an equivalent range of saccade latencies; we will refer to this subset of no-step trials as latency-matched trials.
Figure 6, B and C compares the activity of this visual neuron on trials in which the target stepped into the receptive field 67 ms after the presentation of initial array with the activity during latency-matched no-step trials when the distractor remained in the receptive field. Selection of the stepped target at its new location within the neuron's receptive field occurred irrespective of whether the monkey shifted gaze to the initial or to the final target location, as reported previously (Murthy et al. 2001). On step trials in which the monkey shifted gaze correctly to the final target location (Fig. 6B) the activity became different 180 ms after array presentation, 113 ms after the target step, and 37 ms before TSRT. On step trials in which the monkey failed to compensate for the target step and shifted gaze incorrectly to the initial target location outside the receptive field (Fig. 6C) the activity became different 199 ms after array presentation, 132 ms after the target step, and 18 ms before TSRT. The modulation was similar on step trials regardless of where the monkey shifted gaze in the array.
The pattern of visual activity observed in double-step trials was comparable to what was observed in search-step trials (Fig. 7). In both search-step and double-step tasks this neuron selected the new target in the receptive field within TSRT. In the absence of distractors, target selection times tended to occur earlier. Similarly, the response to the target stepping into the receptive field was earlier and more pronounced than that observed in search-step trials. On no-step trials (Fig. 7A) this visual neuron selected the target 65 ms after target presentation, which corresponds to the visual latency of the neuron. On double-step trials in which the monkey made a compensated saccade to the final target location (Fig. 7B) this neuron modulated 155 ms after initial target presentation, 71 ms after the step, but 29 ms before TSRT. On double-step trials in which the monkey made a noncompensated saccade to the initial target location (Fig. 7C) the activity became different 158 ms after initial target presentation, 74 ms after the step, but 26 ms before TSRT.
FIG. 7.

Visually responsive neuron during double-step trials when the target stepped into the receptive field 84 ms following array presentation. Same neuron and conventions as in Fig. 6.
To quantify the modulation selecting the target, the ratio of the discharge rate in compensated step trials to the discharge rate during the same interval for latency-matched no-step trials was determined.1 Values >1.0 indicate that the neuron signaled the presence of the new target in its receptive field. This ratio, which we will refer to as step response ratio, was calculated in the 40 ms interval spanning TSRT. Unusually high values of the step response ratio (>7) were considered unreliable because of relatively low discharge rates and so were not included in the statistical tests. The distribution of these ratios across individual session at a given TSD (±17 ms) that yielded maximum number of trials, which was no less than 10 trials, is illustrated in Fig. 8.
FIG. 8.

Visual target selection in the search-step and double-step conditions in which the target stepped into the receptive field of the neuron. Step response ratios, i.e., ratios of activity of (A) visual and (B) visuomovement neurons at ±20 ms TSRT during compensated target-step trials compared with latency-matched no-step trials (open black) and during noncompensated target-step trials compared with latency-matched no-step trials (solid black) in the search-step task. Ratios of activity of visual and visuomovement neurons at ±20 ms TSRT during compensated target-step trials compared with latency-matched no-step trials (open gray) and during noncompensated target-step trials compared with latency-matched no-step trials (solid gray) in the double-step task are stacked in the corresponding bin. Step response ratios are measured at a TSD (±17 ms) that provided the maximum number of trials.
For the search-step task, the step response ratio for the example visual neuron at the 67 ms TSD was 2.07 for compensated trials and 2.17 for noncompensated trials. The distribution of these ratios across the sample of visual neurons is presented in Fig. 8A. The mean ± SE of the step response ratios for all visual neurons was 1.72 ± 0.19 (geometric mean = 1.55, 95% confidence interval [CI] = 0.66) for compensated trials and 1.51 ± 0.21 (geometric mean = 1.35, 95% CI = 0.58) for noncompensated trials, indicating activity was significantly higher when a distractor became the target versus when it remained a distractor, irrespective of whether monkeys shifted gaze to it directly for both compensated [t(20) = 3.69, P < 0.001] and noncompensated saccades [t(20) = 2.47, P = 0.01]. Across all sessions, the step response ratio exceeded 1.0 for 81% of the compensated values and 86% of the noncompensated values. However, the distribution of the step response ratios in compensated trials was not different from the distribution of the step response ratios in noncompensated trials [paired t-test, t(20) = 1.94; P = 0.07].
The mean ± SE of the step response ratios for visuomovement neurons was 1.77 ± 0.22 (geometric mean = 1.53, 95% CI = 0.43) for compensated trials and 1.72 ± 0.23 (geometric mean = 1.47, 95% CI = 0.46) for noncompensated trials (Fig. 8B). Activity was significantly higher when a distractor became the target versus when it remained a distractor, irrespective of whether monkeys shifted gaze to it directly for both compensated [t(24) = 3.51, P < 0.001] and noncompensated saccades [t(24) = 3.08, P = 0.002]. Across all sessions, the step response ratio exceeded 1.0 for 84% of the compensated values and 76% of the noncompensated values. Like visual neurons, visuomovement neurons did not show any difference in the distributions of the step response ratio of compensated and noncompensated values [paired t-test, t(24) = 0.47; P = 0.64].
Although derived from fewer samples, similar results were obtained during the double-step task. Activity significantly increased when a target suddenly appeared in the receptive field. The step response ratio for the example visual neuron at 84 ms TSD was 3.12 for compensated trials and 4.61 for noncompensated trials. The mean ± SE of the step response ratios derived at a TSD that provided maximum trials in a session for all visual neurons was 1.68 ± 1.15 (geometric mean = 0.78, 95% CI = 2.26) for compensated trials and 1.94 ± 1.12 (geometric mean = 1.41, 95% CI = 2. 20) for noncompensated trials (Fig. 8A). Likewise, the mean ± SE of the step response ratios for visuomovement neurons was 1.20 ± 0.22 (geometric mean = 1.13, 95% CI = 0.43) for compensated trials and 1.22 ± 0.08 (geometric mean = 1.21, 95% CI = 0.17) for noncompensated trials (Fig. 8B).
To summarize, in both step tasks, activity became greater when the target stepped into the receptive field relative to when the distractor or no stimulus remained in the receptive field. The majority of the visually responsive neurons responded significantly to the unexpected appearance of the target in the receptive field, irrespective of whether the monkeys shifted gaze to it. This forms the basis of their classification as visual cells.
Visual response when the target steps out of the receptive field
Figure 9 compares the activity of the representative visual neuron during search-step trials when the target stepped out of the receptive field 67 ms following array presentation with the activity during no-step trials when the target remained in the receptive field. This neuron had a pattern of discharge rate in target-step trials that was indistinguishable from that in no-step trials. In other words, this neuron maintained a lingering representation of the target that had already stepped from the response field, as evidenced by step response ratio values close to 1.0. The step response ratio for the example visual neuron at the 67 ms TSD was 0.87 for compensated trials and 0.98 for noncompensated trials. Across the sample of visual neurons, the means ± SE of the step response ratio was 0.95 ± 0.04 (geometric mean = 0.93, 95% CI = 0.38) for compensated trials and 0.98 ± 0.05 (geometric mean = 0.95, 95% CI = 0.39) for noncompensated trials (Fig. 11A). The step response ratio was <1.0 for 61% of the compensated values and 70% of the noncompensated values. The modulation was not significantly less in step trials versus no-step trials, either for compensated saccades [t(22) = −1.4, P = 0.08] or for noncompensated saccades [t(22) = −0.41, P = 0.34]. This means that the majority of visual neurons did not show differential modulation in response to the disappearance of the target from the receptive field, either when the monkey correctly shifted gaze or when the monkey performed incorrectly.
FIG. 9.

Visual activity during target-step trials in the search-step task in which the target stepped out of the neuron's receptive field 67 ms after array presentation. A: compensated target-step trials (red solid) and latency-matched no-step trials (black). B: noncompensated target-step trials (red dotted) and latency-matched no-step trials (black). Same neuron and conventions as in Fig. 6.
Across the sample of visuomovement neurons, the mean ± SE of the step response ratio was 0.98 ± 0.06 (geometric mean = 0.93, 95% CI = 0.12) for compensated trials and 0.93 ± 0.03 (geometric mean = 0.91, 95% CI = 0.06) for noncompensated trials (Fig. 11B). The step response ratio was <1.0 for 56% of the compensated values and 70% of the noncompensated values. This distribution was not significantly <1.0 when monkeys compensated after the target disappeared from the receptive field [t(26) = −0.30, P = 0.38]. Although when monkeys failed to compensate and shifted gaze to the original target location in the receptive field the distribution of step response ratios was significantly <1.0 [t(26) = −2.38, P = 0.01], but a paired t-test shows the distribution in noncompensated trials was not different from the distribution in compensated trials [t(26) = 0.82, P = 0.42].
Modulation by the example neuron in double-step trials was qualitatively similar to that of the search-step activity. In the absence of distractors, this neuron did not represent the disappearance of the target from its response field when the monkey correctly shifted gaze elsewhere to the final target location (Fig. 10A) or incorrectly shifted gaze to the original target location in the response field (Fig. 10B), which then contained no visual stimulus at all. The lingering representation of the shifted target by this neuron resulted in a discharge rate in target-step trials similar to that in no-step trials. The mean ± SE of the step response ratio for the example visual neuron in double-step trials at the 84 ms TSD was 0.89 for compensated trials and 1.1 for noncompensated trials. Across the sample of visual neurons, the mean ± SE of the step response ratios was 0.90 ± 0.07 (geometric mean = 0.90, 95% CI = 0.14) for compensated trials and 0.87 ± 0.15 (geometric mean = 0.84, 95% CI = 0.30) for noncompensated trials (Fig. 11A). For visuomovement neurons, the mean ± SE step response ratio was 0.83 ± 0.12 (geometric mean = 0.79, 95% CI = 0.23) for compensated trials and 0.89 ± 0.04 (geometric mean = 0.89, 95% CI = 0.08) for noncompensated trials (Fig. 11B).
FIG. 10.

Visual activity during target-step trials in the double-step task in which the target stepped out of the receptive field 84 ms after array presentation. A: compensated target-step trials (red solid) and latency-matched no-step trials (black). B: noncompensated target-step trials (red dotted) and latency-matched no-step trials (black). Same neuron and conventions as in Fig. 6.
FIG. 11.

Visual target selection in the search-step and double-step tasks in which the target stepped out of the receptive field. Step response ratios, i.e., ratios of activity of (A) visual and (B) visuomovement neurons at ±20 ms TSRT during compensated target-step trials compared with latency-matched no-step trials (open) and during noncompensated target-step trials compared with latency-matched no-step trials (solid). Conventions are the same as those in Fig. 8.
To summarize, when the target stepped out of the receptive field, visually responsive neurons either did not register this change or modestly decreased their spike rate. This indicates that FEF visual activity alone may be inadequate to predict saccade choice. This is consistent with the nature of modulation of FEF neurons when monkeys make natural errors in visual search (Thompson et al. 2005a). After FEF visual neurons select a target, they maintain a high level of activity for that target location even when it becomes invalid.
Movement-related activation when the target steps into the movement field
Figure 12 illustrates the activity of a representative movement neuron in no-step trials and in search-step trials when the target stepped into the movement field. This neuron exhibited a pronounced increase of discharge rate before and during memory-guided saccades but little modulation following target presentation (not shown). When the target of the search array appeared in the movement field in no-step trials, this neuron's activity began to increase on average 84 ms following presentation of the search array (Fig. 12A). This time demarcates the beginning of the saccade preparation process that concludes with initiation of the saccade when the activity reaches a specific threshold discharge rate (Hanes and Schall 1996). The remaining panels in this figure demonstrate the neuron's response on target-step trials in which the target stepped into the movement field 84 ms following the initial presentation of the search array. The activity on these step trials is compared with latency-matched no-step trials when the distractor remained in the movement field. When the monkey correctly shifted gaze to the new target in the movement field this neuron's activity began to increase 201 ms after array presentation, 117 ms after the step, which was 12 ms before TSRT elapsed (Fig. 12B). Similarly, when the monkey failed to reprogram the saccade and shifted gaze to the initial target location in error the discharge rate began to increase 208 ms after array presentation, 124 ms after the step, which was 5 ms before TSRT (Fig. 12C). It is important to note that the target-step activity shown in Fig. 12C does not correspond to the initial noncompensated errant saccade. Instead, this activity is related to the corrective saccade made subsequent to the initial noncompensated errant saccade. Although not reinforced, monkeys made quick corrective saccades on nearly all noncompensated trials. The preparation of the corrective saccade occurred in parallel with the preparation of the initial errant saccade and was the subject of a previous study (Murthy et al. 2007).
FIG. 12.

Movement activity during target-step trials in the search-step task in which the target stepped into the neuron's response field 84 ms after array presentation. Stimulus conditions and saccade direction are diagrammed in the rectangular boxes. A solid gray circle indicates the location of the neuron's response field. The vertical red arrow marks the time of differential activity during (A) correct no-step trials when the target was in (thick) the response field compared with correct no-step trials when the target was out (thin) of the response field. B: compensated target-step trials (blue solid) compared with latency-matched no-step trials (black). The horizontal bar indicates the range of compensated saccade latencies. C: noncompensated trials (blue dotted) compared with latency-matched no-step trials (black). The horizontal bar indicates the range of noncompensated saccade latencies.
The pattern of activity was similar during the double-step task as in the search-step task. When a single target was presented and remained in the movement field this neuron began saccade preparation 69 ms after target presentation (Fig. 13A). On correct target-step trials the activity became different 168 ms after array presentation, 84 ms after the step, but 28 ms before TSRT (Fig. 13B). On incorrect trials, when the monkey shifted gaze to where the target had previously been, the neuron modulated 201 ms after array presentation, 117 ms after the step, 5 ms following TSRT (Fig. 13C). Again, note that the neural activity following errors in Fig. 13C for the double-step task is involved in the production of a corrective saccade following the initial errant noncompensated saccade.
FIG. 13.

Movement activity during target-step trials in the double-step task in which the target stepped into the response field 84 ms after array presentation. A: correct no-step trials when the target was in (thick) and out (thin) of the response field. B: compensated trials (blue solid) and latency-matched no-step trials (black). C: noncompensated trials (blue dotted) and latency-matched no-step trials (black). Same neuron and conventions as in Fig. 12.
The step response ratio for the example movement neuron at 84 ms TSD was 5.84 for compensated trials and 2.74 for noncompensated trials. Across the entire movement neuron sample, the mean ± SE of the step response ratios was 2.15 ± 0.34 (geometric mean = 1.64, 95% CI = 0.66) for compensated trials and 1.26 ± 0.12 (geometric mean = 1.13, 95% CI = 0.24) for noncompensated trials (Fig. 14). The step response ratio was >1.0 for 71% of the compensated values but for 67% of the noncompensated values. When the target stepped into the movement field, the step response ratio was significantly >1.0 for both compensated [t(23) = 3.40, P = 0.001] and noncompensated saccades [t(23) = 2.11, P = 0.02]. Modulation in step trials at a given TSD was greater for compensated saccades than that for noncompensated saccades [paired t-test, t(23) = 3.03, P = 0.003].
FIG. 14.

Saccade preparation in the search-step and double-step tasks in which the target stepped into the movement field. Ratios of activity of movement neurons at ±20 ms TSRT during compensated target-step trials compared with latency-matched no-step trials (open) and during noncompensated target-step trials compared with latency-matched no-step trials (solid).
In double-step trials this example movement neuron had a step response ratio 5.74 for compensated trials and 1.49 for noncompensated trials. Across the population of movement neurons tested with the double-step task, the average step response ratio for the double-step task was 2.66 ± 1.40 (geometric mean = 2.04, 95% CI = 2.75) for compensated saccades and 1.62 ± 0.57 (geometric mean = 1.45, 95% CI = 1.11) for noncompensated saccades (Fig. 14).
To summarize, movement-related neurons contribute to saccade production by increasing their discharge rates when a target appeared in their movement fields such that monkeys shift gaze to it. However, in contrast to visual neurons, movement neurons exhibited weaker or no modulation before TSRT if monkeys made noncompensated gaze shifts to the target at its original location outside the movement field. In other words, noncompensated saccades were produced because the activity of the movement neurons producing the saccade to the original target location reached the threshold to trigger the saccade.
Movement-related activation when the target steps out of the movement field
The experimental condition in which the target steps out of the movement field provides an opportunity to distinguish neurons that play an active role in saccade control. Activity during target-step trials was compared with that in latency-matched no-step trials when the target remained in the movement field. If a neuron's discharge rate becomes significantly less in the compensated target-step trials than that in the latency-matched no-step trials before TSRT, then that neuron can be said to directly control saccade initiation (Hanes et al. 1998; Paré and Hanes 2003). A step response ratio significantly <1.0 when the target steps away from the movement field identifies neurons that instantiate the process of canceling the partially prepared saccade toward the initial target location such that the monkey compensates for the target step by shifting gaze to the new target location outside of the movement field.
Figure 15 compares the activity of a representative movement neuron during target-step trials in the search-step task when the target stepped out of the movement field 84 ms following array presentation. When the monkey correctly shifted gaze to the new target outside of the movement field this neuron ceased its growth of activity 208 ms after array presentation, 124 ms after the target-step, which was 5 ms before TSRT elapsed (Fig. 15A). From this point, the activity continued to diminish, indicating that the saccade to the target that had originally appeared in the movement field was canceled. In contrast, when the monkey failed to reprogram the saccade and shifted gaze to the initial target location in error the discharge rate steadily increased after array presentation to the threshold to trigger the saccade, seemingly uninfluenced by the target step so that gaze was errantly shifted to the stimulus into the movement field that, by then, was a distractor (Fig. 15B). Similar patterns of activity were produced by this movement neuron during double-step trials when the target stepped out of the movement field. When the monkey responded correctly and shifted gaze outside of the movement field the neuron began to diminish its firing rate 202 ms after presentation of the initial target, which was 118 ms after the target step and 5 ms after TSRT (Fig. 16A). In contrast, when the monkey failed to control gaze appropriately and made an errant saccade to the initial target location the neuron's activity failed to subside (Fig. 16B). The pattern of modulation of FEF movement neurons during target-step trials in the search-step and double-step tasks was effectively identical to that observed in FEF and SC during the saccade stop signal task (Hanes et al. 1998; see also Paré and Hanes 2003).
FIG. 15.

Movement activity during target-step trials in the search-step task in which the target stepped out of the neuron's response field 84 ms after array presentation. A: compensated step trials (red solid) and latency-matched no-step trials (black). B: noncompensated step trials (red dotted) and latency-matched no-step trials (black). Same neuron and conventions as in Fig. 12.
FIG. 16.

Movement activity during target-step trials in the double-step task in which the target stepped out of the neuron's response field 84 ms after array presentation. A: compensated trials (red solid) and latency-matched no-step trials (black). B: noncompensated step trials (red dotted) and latency-matched no-step trials (black). Same neuron and conventions as in Fig. 12.
The step response ratio for the example movement neuron at 84 ms TSD was 0.39 for compensated trials and 1.12 for noncompensated trials in the search-step task. Across the entire movement neuron sample, the mean ± SE of the step response ratios was 0.74 ± 0.06 (geometric mean = 0.69, 95% CI = 0.11) for compensated trials and 1.02 ± 0.03 (geometric mean = 1.01, 95% CI = 0.05) for noncompensated trials (Fig. 17). The step response ratio was <1.0 for 86% of the compensated values and 50% of the noncompensated values. As expected, these ratios were significantly less for compensated saccades [t(21) = −4.68, P < 0.001] but not for noncompensated saccades [t(21) = 0.86, P = 0.8]. The average step response ratio for noncompensated saccades was higher than that for compensated saccades across the sample of neurons [paired t-test, t(21) = 4.45, P < 0.001].
FIG. 17.

Saccade preparation in the search-step and double-step tasks in which the target stepped out of the neuron's movement field. Ratios of activity of movement neurons at ±20 ms TSRT during compensated target-step trials compared with latency-matched no-step trials (open) and during noncompensated target-step trials compared with latency-matched no-step trials (solid). Conventions are the same as those in Fig. 8.
In the double-step task, the step response ratio for the example movement neuron at 84 ms TSD was 0.47 for compensated trials and 1.08 for noncompensated trials. Across the entire movement neuron sample, the mean ± SE of the step response ratios was 0.62 ± 0.08 (geometric mean = 0.60, 95% CI = 0.17) for compensated trials and 1.01 ± 0.02 (geometric mean = 1.01, 95% CI = 0.03) for noncompensated trials (Fig. 17).
Temporal modulation of FEF neurons during search-step
Among neurons with significant modulation in target-step trials, measuring the time of modulation of activity relative to the behavioral TSRT yields useful information concerning the role that visual and movement neurons can play in search-step performance. Concurrent measurements of TSRT and the time of modulation allow us to establish a criterion that identifies neurons that can play an active role in selecting targets, specifying saccade endpoints, and controlling saccade initiation. Such neurons must modulate prior to TSRT; otherwise, they would not be able to contribute to these processes as required by the race model. In this section we summarize the population results from target-step trials in the search-step task. Because of the small sample sizes the summary statistics from the double-step task were not as stable and so are not reported; however, results were in general agreement with the patterns observed in the search-step data.
For this study we selected only data from sessions in which neurons modulated after the target step because modulation earlier than TSD cannot be considered relevant to the task. Figure 18A plots cumulative distributions of the modulation times for visual, visuomovement, and movement neurons relative to the TSRT when monkeys compensated for the target stepping into their response field. These data reveal three relationships. First, the pie charts indicate that a high fraction of visual (83%), visuomovement (89%), and movement (100%) neurons were modulated. Thus nearly all such neurons in FEF respond when a distractor becomes a target in their response field. Second, the distributions of the modulation times were not significantly different from each other [one-way ANOVA, F(68) = 1.27, P = 0.29]. Thus the response to the target stepping into the response field occurred simultaneously across all neurons recorded in FEF. Finally, the median modulation time relative to TSRT across the population of neurons was 0 ms. The mean ± SE modulation time relative to TSRT for visual, visuomovement, and movement neurons was −5 ± 6, −1 ± 8, and 11 ± 8 ms, respectively. Across the population the mean ± SE modulation time (2 ± 4 ms) was not significantly different from TSRT [t(68) = 0.4, P = 0.69]. In other words, when monkeys compensated for the target stepping into neurons’ response fields, the neural modulation in FEF coincided with the TSRT calculated from the race model applied to the performance while each neuron was sampled. The variability of the times of neural modulation relative to TSRT is probably due largely to irreducible measurement error and intrinsic randomness of the race processes described by TSRT. Furthermore, as indicated by the range of latencies of the compensated saccades, all of the neural modulation preceded the initiation of the compensated saccade.
FIG. 18.

Distributions of times of modulation of activity for visual (gray solid), visuomovement (black dotted), and movement (black solid) neurons when the target stepped into (A) or away from (B) the response field. Distributions are aligned on TSRT. Vertical bar indicates time of target step. Horizontal bar delimits the 5th to 95th percentile of compensated saccade latencies; median time is indicated by arrow. Pie charts indicate the fraction of neurons that were modulated. C: distributions of times of modulation of activity for visual (red), visuomovement (green), and movement (blue) neurons, when the target stepped into (solid) or away from (dotted) the response field, that were modulated in both trial conditions. When monkeys compensated for the target stepping into the response field, frontal eye field (FEF) neurons were modulated concomitantly with TSRT. When monkeys compensated for the target stepping away from the response field, FEF neurons were modulated before TSRT.
Figure 18B plots the times of modulation of visual, visuomovement, and movement neurons relative to TSRT when monkeys compensated for the target stepping out of their response field. Several results are evident. First, relative to what was observed when the target stepped into responses fields, substantially lower fractions of visual neurons (58%) and visuomovement neurons (36%), but only a somewhat lower fraction of movement neurons (71%), were modulated. It should be noted that a higher fraction of movement neurons were modulated than were visually responsive neurons. Second, the distributions of modulation times were not significantly different from each other [one-way ANOVA, F(40) = 2.44, P = 0.10]. Thus the response to the target's being replaced by a distractor occurred simultaneously across the population of FEF neurons sampled. Finally, the means ± SE modulation times for visual (−38 ± 13 ms), visuomovement (−60 ± 10 ms), and movement neurons (−28 ± 5 ms) preceded TSRT. Across the population this time (−39 ± 6 ms) was significantly earlier than TSRT [one-tailed t-test, t(40) = −6.83, P < 0.001]. These data indicate that when monkeys compensated for the target stepping away from their response field, a smaller fraction of neurons was modulated compared with when the target stepped into the response field. The processes of identifying that the target is no longer the target and inhibiting the original saccade started before TSRT, the time at which the original saccade was actively inhibited (Boucher et al. 2007; Camalier et al. 2007). Furthermore, as indicated by the range of latencies of the compensated saccades, all of the neural modulation preceded the initiation of the compensated saccade.
These results were quantitatively but not qualitatively different if the time of the difference in neural activity was measured from the area under the receiver operating characteristic (ROC) curve calculated from sets of compensated step trials compared with the latency-matched no-step trials. We considered only those neurons that provided at least five trials in both sets. According to this approach when a distractor became the target in their response field, the majority of neurons (75% visual, 79% visuomovement, and 92% movement) in FEF responded. The means ± SE modulation times measured relative to TSRT were 12 ± 6 ms for visual neurons, 16 ± 8 ms for visuomovement neurons, and 25 ± 6 ms for movement neurons; these distributions were not significantly different from each other [F(2,61) = 0.9, P = 0.41]. Across the population the mean ± SE modulation time (18 ± 4 ms) was greater than TSRT [t(61) = 4.4, P < 0.001]. When the target within the neuron's response field became a distractor, according to the ROC analysis 33% of visual neurons, 39% of visuomovement neurons, and 67% of movement neurons responded. The mean ± SE modulation times relative to TSRT for visual neurons (10 ± 21 ms), visuomovement neurons (−38 ± 19 ms), and movement neurons (16 ± 8 ms) were significantly different from each other [F(2,34) = 3.9, P = 0.03]. Across the population the average time of modulation on these trials (−3 ± 9 ms) was not different from TSRT [t(34) = −0.3, P = 0.8]. Compared with the more sensitive method of measuring the presence and time of neural modulation, the ROC analysis measured a lower fraction of neurons modulated with later modulation times. This outcome is entirely consistent with the original observation that the beginning of the selection process precedes the midpoint of the selection process (see Fig. 12; Thompson et al. 1996) and highlights why the more sensitive procedure is preferred for this analysis.
The comparison illustrated in Fig. 18, A and B consists of samples from individual neurons including neurons that were modulated only when the target stepped inside the neuron's response field but not when the target stepped out from the neuron's response field; therefore the comparison across times of modulation is confounded by a comparison across neurons. This limitation was addressed in the data illustrated in Fig. 18C, which shows the cumulative distributions of modulation times relative to TSRT for the different conditions for the subset of neurons that exhibited modulation in both types of trials. Overall, FEF neurons modulated on average 43 ms earlier when the target stepped out of the neuron's response field compared with when the target stepped into the response field [paired t-test, t(40) = 5.56, P < 0.001]. To test whether the earlier modulation was mediated by visual neurons or saccade-related neurons or both, we compared each class of neurons separately. The mean ± SE time at which visual neurons signaled that a target became a distractor (−38 ± 13 ms) was not different from the mean ± SE time at which these neurons signaled that a distractor became the target (−10 ± 7 ms) [paired t-test, t(13) = 1.83, P = 0.09]. On the other hand, the means ± SE time taken by visuomovement and movement neurons (visuomovement: −60 ± 10 ms; movement: −28 ± 5 ms), to inhibit the saccade directed to the original target location preceded the time taken (visuomovement: 4 ± 8 ms; movement: 14 ± 10 ms) to initiate the saccade directed to the final location of the target [paired t-test, visuomovement: t(9) = 4.8, P < 0.001; movement: t(16) = 4.0, P < 0.001]. These results suggest several conclusions. First, a group of neurons in FEF participate only in selection of the location of the target and program a saccade to that location, but do not respond differentially when the target leaves their response field. Second, a group of movement-related neurons that respond in both types of trials cancel preparation of the original saccade before they initiate the preparation of the final saccade. Third, visual neurons register the appearance and the disappearance of the target through the same range of times.
DISCUSSION
Since the introduction of the double-step task by Westheimer (1954) oculomotor control has been explored in much detail using this perturbation (Aslin and Shea 1987; Becker and Jürgens 1979; Findlay and Harris 1984; Hallett and Lightstone 1976a,b; Hou and Fender 1979; Komoda et al. 1973; Levy-Schoen and Blanc-Garin 1974; Lisberger et al. 1975; Wheeless et al. 1966). However, unlike many other double-step studies for which the focus was on coordinate transformations used by the oculomotor system (Gnadt and Andersen 1988; Goldberg and Bruce 1990; Guthrie et al. 1983; Hallett and Lightstone 1976a,b; Honda 1989) or the adaptive properties of the oculomotor system (e.g., Deubel et al. 1986), we used the double-step and search-step tasks to study the dynamic interaction of visual processing and saccade programming, consistent with the motivation of the original behavioral studies (Hou and Fender 1979; Komoda et al. 1973; Westheimer 1954; see also Corneil and Munoz 1996). The conceptual framework that performance is the outcome of a race between a GO process that initiates a saccade and a STOP process that inhibits the saccade enhanced our application. The race model has been used successfully to explain performance in countermanding (stop signal) tasks in which subjects withhold gaze shifts in response to a stop-signal (Hanes and Schall 1995). The requirement of the countermanding task to withhold a saccade in response to the stop signal was somewhat different from that in the double-step and search-step tasks to both withhold the original saccade and redirect gaze to the current position of the target, although the core motivation was the same (e.g., De Jong et al. 1995; Verbruggen et al. 2008). However, unlike the saccade stop signal task used in previous electrophysiological investigations (Hanes et al. 1998; Paré and Hanes 2003) in which the focus was on the relation between gaze holding (mediated by fixation neurons) and gaze shifting (mediated by movement neurons) processes, the search-step task can clarify the relation between the activity of visual neurons that perform target selection and the activity of movement neurons that realize saccade production to the selected target.
In this study we reported in more detail how saccades can be erroneously directed to the original location of the target even when most visual neurons select the new target stepping into their response field early enough to have been used for saccade planning (Murthy et al. 2001). We also report several new observations. First, unlike the clear response to the change from a distractor to a target, we observed that a lower fraction of visual neurons responded to the replacement by a distractor or outright disappearance of the target from their receptive field and were modulated by the removal of the target did so concomitant with the selection of the new target location. Second, we report on how the production of either erroneous or correct saccades is correlated with the modulation times across the populations of movement-related neurons. As observed previously (Brown et al. 2008; Hanes and Schall 1996; Woodman et al. 2008), saccades are initiated when the activity of movement-related neurons grows stochastically to a specific threshold. When the target steps to a new location, incorrect noncompensated saccades to the original location were produced when the activity of the movement neurons preparing the first saccade reached their threshold despite the target step. Correct compensated saccades to the final target location were produced when the activity of the movement neurons preparing the first saccade was prevented from reaching the threshold and the activity of the movement neurons preparing the compensated saccade instead grew to the threshold. Thus whereas visual neurons signal only weakly the removal of the target from their response field when compensated saccades are produced, movement neurons signal the change of status of the stimulus in a pronounced manner so as not to produce the erroneous saccade. Also, we found that the inhibition of the incorrect saccade preceded the preparation of the correct saccade began. These results highlight the distinct roles that FEF visual and movement-related neurons play during the control of target selection and provide new insights into the control of target selection and saccade production during visual search.
Race model of target-step saccade performance
Earlier investigators suggested that performance of the classic saccade double-step task, in which subjects are expected to redirect gaze to the final target location, can be accounted for in terms of a race between two processes (Becker and Jürgens 1979; Lisberger et al. 1975). Recently, we have shown that performance in the saccade double-step and search-step tasks can be analyzed in the same manner as performance in the stop signal task to yield a measure corresponding to SSRT that we refer to as target-step reaction time (TSRT); we also showed through formal stochastic modeling that only certain race model architectures can account for saccade double-step and search-step performance of macaques and humans (Camalier et al. 2007). A race simply between two GO processes producing the alternative saccades could not fit the data. An explicit STOP process is needed to interrupt the first GO process producing the saccade to the original target location. Taken all together, the probability and latencies of compensated and noncompensated saccades as well as the incidence and latency of corrective saccades after errors could be accounted for most effectively by an architecture in which the STOP process that races to interrupt the first GO process runs in parallel with the second GO process that produces the compensated saccade. The characteristic of the STOP process has been elaborated in the results of Kapoor and Murthy (2008) who observed an additive interaction between the inhibition that withholds memory-guided saccades and TSRT. Thus redirecting saccades in double-step and search-step tasks requires a presumably inhibitory interruption process. The duration of this process can be derived from performance data in the form of TSRT. In other words, TSRT measures the time at which the interruption process is effective. The TSRT measured in double-step trials (∼100 ms) is comparable to what is measured in the saccade stop signal task with comparable stimulus luminance values. The value of TSRT tends to be longer for search-step (∼125 ms) especially if the target and distractor are more similar, thus making the target step less salient. The longer TSRT in search-step trials compared with double-step (or stop signal) trials can be understood as simply due to delayed encoding and selection of the stimulus signaling the change of saccade (compare Figs. 6 and 7).
To summarize, the experimental design of the target-step task creates a condition in which visual selection and saccade production can be dissociated. Moreover, the measurement of TSRT affords an ability to distinguish neurons with activity modulating in time to effect target selection or saccade preparation. Thus for our purpose, the most critical feature of the proposed race model is the ability to estimate the TSRT and relate it to the pattern of activity in visual and movement neurons to understand the relationship between visual target selection and saccade production during visual search.
Visual response to the target step
An abrupt change in planning of a saccade in response to the visual perturbation provided a means to investigate the relationship between the modulation of visual activity associated with target selection and saccade production. In this report we provide a thorough description of how the time course of visual selection of the target stepped into neuron's receptive field influenced preparation of the correct saccade to that target and how quickly visually responsive neurons responded to the removal or replacement of the target from its receptive field for the prevention of error. We observed that the majority of the visually responsive neurons registered the step of the target into the receptive field by increasing their discharge rate. This modulation was concomitant with the TSRT when the preparation of the saccade to the original target location was interrupted. This observation notwithstanding, another important result is that the visual target selection process by itself did not reliably predict whether the original saccade would be canceled. In other words, the step of the target into neurons’ receptive field was registered regardless of whether a compensated saccade was ultimately produced to the final target location (Murthy et al. 2001). Thus although selecting the new target location is necessary for producing an accurate, compensated saccade, it is not sufficient.
If the neural representation of the new target location does not specify saccade production, perhaps the neural representation of the old target location would suffice. In fact, though, we found that when the target became a distractor (search-step) or even disappeared (double-step), fewer visually responsive neurons were significantly modulated. This result is useful to compare with what these visual neurons in FEF do during the stop signal task when the target in the receptive field does not change when the stop signal appears at the fixation spot (Hanes et al. 1998). Under this condition, few of the visual neurons were modulated at all and those that were did so well after SSRT. The fact that in this study some of the visual neurons responded to the replacement of the target by a distractor in their receptive field before TSRT is consistent with reports that some FEF neurons can signal stimulus features in the search array (e.g., Bichot et al. 1996; Peng et al. 2008; Xiao et al. 2006).
These results have several implications. First, this pattern of results provides further evidence that the activity of visually responsive neurons in FEF is not sufficient to specify saccade production. This general conclusion is consistent with previous studies showing that the timing of target selection by most visual neurons in FEF or other structures does not predict the timing of saccade initiation during a pop-out search (McPeek and Keller 2002a; Sato and Schall 2003; Thompson et al. 1996; see also Ipata et al. 2006; Shen and Paré 2007; Thomas and Paré 2007) and that these neurons select the target of a search array when no saccade is produced (Thompson et al. 1997, 2005b).
Second, by instructing subjects to follow the sequence of stimuli instead of redirecting gaze, the double-step task has been used extensively to investigate how the visual and oculomotor system update representations and perform coordinate transformations both psychophysically (Awater and Lappe 2006; Dassonville et al. 1995; Guthrie et al. 1983; Hallett and Lightstone 1976a,b; Park et al. 2003; Schlag and Schlag-Rey 2002) and physiologically (Goldberg and Bruce 1990; Mays and Sparks 1980; Tian et al. 2000). In particular, previous studies have indicated that visual neurons in sensorimotor structures respond to a stimulus flashed just before a saccade at a location that will be in the receptive field of a neuron after the saccade. Neurons that exhibit this kind of modulation were initially found in the lateral intraparietal area (Duhamel et al. 1992; Heiser and Colby 2006) and, subsequently, in FEF (Sommer and Wurtz 2006; Umeno and Goldberg 1997, 2001). This pattern of modulation has been referred to as remapping. In monkeys performing a pop-out visual search task it has been reported that visually responsive neurons in the SC represent the location of the salient object in a search array even if monkeys shift gaze to a distractor before producing a corrective saccade to the overlooked target (McPeek and Keller 2002b). These authors suggested that the sustained representation by these visual neurons remapped the location of the target in the reference frame of the errant saccade to afford rapid error correction. If it is the case that visual target selection is necessary but not sufficient for saccade production, then the functional role of this remapping relative to saccade production is uncertain. However, using this search-step task we have previously described how movement-related neurons in FEF produce activity in time and pattern sufficient to produce corrective saccades (Murthy et al. 2007).
Third, to the extent that visual neurons in FEF correspond to attention allocation (Corbetta and Shulman 2002; Juan et al. 2004; Schall 2004), these results can be related to recent observations about the allocation of attention in visual search tasks that include abrupt or competing stimuli (Schreij et al. 2008; Theeuwes and Burger 1998). First, an influential model of visual attention proposed that attention is disengaged from one location before it engages at another location (e.g., Posner et al. 1984); in contrast to this, the fact that FEF neurons selected vigorously the target at the new location, whereas many other neurons were still active for the old target location, indicates that visual attention can be directed to a new location before it is removed from an old location (Sato and Schall 2003; Schall 2004; see also Khayat et al. 2006; Kusunoki and Goldberg 2003). Second, the lingering representation of the old target location after the new location has been selected by neurons in FEF leads to the prediction that attention may be at least momentarily split between the two target locations (e.g., Bichot et al. 1999).
Response of movement-related neurons to the target step
The observation that saccades are initiated when the activity of FEF movement neurons increases stochastically to a threshold was confirmed in this study (Brown et al. 2008; Hanes and Schall 1996; Woodman et al. 2008). Movement neurons produced higher discharge rates when monkeys made correct saccades to the target that stepped into their movement field compared with when saccades were directed elsewhere. Furthermore, as observed previously in monkeys performing the saccade stop signal task (Brown et al. 2008; Hanes et al. 1998; Paré and Hanes 2003), preparation of the saccade to the initial target location through the gradual growth of activity can be interrupted to permit production of the compensated saccade by other movement neurons. This modulation of movement-related activity occurred coincident with TSRT and before the compensated saccade latency, demonstrating in another task that the signal produced by these neurons is sufficient to control saccade initiation. What is the origin of the signal that interrupts the growth of the movement-related activity in compensated trials? One possibility is that the replacement of the target by distractor in visual neurons’ receptive field. The distribution of visual target deselection times that started considerably earlier than TSRT was statistically indistinguishable from the distribution of movement neuron modulation times. This suggests that the interruption of movement activity in FEF may occur as soon as the target displacement is identified by visual neurons. However, a lower proportion of visual neurons exhibited deselection of the target compared with the majority of visual neurons that selected the target, indicating that an alternate source of stop signal could also be the selection of the new target location that occurred concomitant with TSRT. The present study corroborates the general finding that the interruption of activity of FEF movement neurons might be mediated by visual neurons encoding target step; whether selection or deselection of the target exclusively play a critical role in saccade choice is a subject of further investigation.
A recent study by Ludwig et al. (2007) describes a stochastic accumulator model of double-step saccade performance. This model included the following characteristics: saccade direction is coded by pools of units with broad movement fields; the presentation of a target results in increased activation of the unit centered on the target location with progressively less activation in neighboring units; the activation of each unit corresponds to evidence in favor of the target being in its response field; the activation of each unit is subject to leakage such that if the target steps out of the movement field, activation passively decays; a saccade is generated to the location coded by the unit with activation that reaches a specific threshold; the latency of the saccade is determined by the time that the threshold is reached plus a constant efferent delay; the rate of accumulation varies randomly across target onsets and within a trial; the within-trial noise is independent across units. This model could account for major features of the data including the production of averaging saccades. Although this model is probably correct in many respects, the current findings highlight a potentially major shortcoming. The reduction of activation exclusively through leakage appears insufficient to account for the appearance of the activity of FEF movement neurons when the original saccade is canceled. In fact, a recent interactive race model of saccade stopping shows that active inhibition is necessary to turn off the units that would have produced the original saccade (Boucher et al. 2007). Based on the chronometric analysis shown in Fig. 18, the likely source of such inhibition to movement neurons, which is presumably mediated by inhibitory interneurons, is from the activity of visual neurons representing the new target location. The proposed physiological model is consistent with the GO–GO–STOP model that explains behavioral performance in target-step tasks (Camalier et al. 2007; Kapoor and Murthy 2008).
Does such chronometry necessarily imply that visual selection instantiates the STOP process? We do not think this to be the case for three reasons. First, if visual selection were to disrupt movement preparation directly, then this would require the STOP process to be spatially specific. However, in a separate behavioral study we have shown that the STOP process is additive with a gaze control process that withholds a planned saccade (Kapoor and Murthy 2008). Such additivity is more consistent with a STOP process that is either spatially nonspecific or that has a foveal location. Second, a direct visual-to-motor suppression implies that visual neurons would need to have extensive inhibitory connections with motor representations encompassing all incongruent or nonmatched spatial locations. Such connectivity is unlikely to foster flexible visual-to-motor mapping that is the hallmark of adaptive sensorimotor behavior. Instead it is more parsimonious to think that movement interruption occurs through a nonspecific STOP process that suppresses potential saccades to all other objects in the visual field. Such a global signal need not be confined to a single brain structure but probably encompasses a distributed network with nodes including the FEF, SC, prefrontal cortex, thalamus, basal ganglia, and brain stem. These areas have been shown to possess signals related to visual fixation and together are likely to instantiate the STOP process. Third, chronometric analysis of the current study provides evidence in support of a global STOP architecture. Because such a signal should not be able to distinguish between GO processes producing the noncompensated saccade and the compensated saccade, the time of selection of the compensated saccade is expected to be delayed relative to the time of movement deselection. This prediction is borne out by the measurement of modulation times (Fig. 18). Interestingly the nearly 30-ms delay between responding to the target leaving response field and responding to the target entering the response field matches well with simulations of an interactive race model architecture of countermanding saccade performance that predicts the duration of the active phase of the STOP process is about 30 ms (Boucher et al. 2007). Such an architecture does not necessarily imply that subsequent corrective saccades need to be slow. We suggest that executive control during error correction may selectively enhance corrective saccades programming such that the reaction times of the corrective saccades may be sufficiently fast to produce rapid or even predictive correction (Camalier et al. 2007; Murthy et al. 2007; Ray et al. 2004).
On the classification of neuron types
The adaptability and arbitrariness of macaque and human behavior cannot be explained without a distinction between sensory and motor processes. In fact the hallmark of the double-step task, for which it has been extensively used by physiologists, is its use as a paradigm to dissociate neurons coding stimuli in retinal coordinates, presumably reflecting sensory processing, from those neurons coding stimuli in spatial coordinates, presumably for motor preparation (Bracewell et al. 1996; Guthrie et al. 1983; Mazzoni et al. 1996). Although in this study we focus on the control of target selection, interpretation of the results also hinges on the distinction between visually evoked and movement-related activity. Although the complexity of identifying neural activity with cognitive processes (Schall 2004) is a complex issue, we do not see how some such identification can be avoided to interpret the results. Implicit in the descriptions of most studies describing sensorimotor processing, numerous investigators have described visual, visuomovement, and movement neurons in FEF (Bruce and Goldberg 1985; DiCarlo and Maunsell 2005; Helminski and Segraves 2003; Segraves and Goldberg 1987; Umeno and Goldberg 1997, 2001) and SC (Horwitz and Newsome 1999; Mays and Sparks 1980; McPeek and Keller 2002a) and have identified visual neurons in FEF and SC with visual processing but not saccade programming (Horwitz and Newsome 1999; Horwitz et al. 2004; McPeek and Keller 2002b; Sato and Schall 2003; Sato et al. 2001; Thompson et al. 1996, 1997). In fact, a biophysical correlate of the fundamental neuron types in FEF has been reported (Cohen et al. 2009). Data from the stop-signal task show that saccade-related but not visual activity in FEF and SC can be identified with saccade programming that specifies whether and when saccades will be initiated (Hanes et al. 1998; Paré and Hanes 2003). Differential anatomical connectivity also provides further evidence for distinguishing neuron types. For example, it is well known that neurons in different layers of the cortex entertain different afferents and efferent targets and, consequently, have more or less distinct functional properties. Combined recording and electrical stimulation studies have shown that neurons in FEF with movement-related activity project to the SC (Segraves and Goldberg 1987; Sommer and Wurtz 2001) and brain stem (Segraves 1992) and are likely to correspond to pyramidal neurons in layer 5 (Fries 1984). However, it is uncertain whether neurons with exclusive visual responses throughout project to the SC (Segraves and Goldberg 1987; Sommer and Wurtz 2001). Certainly, neurons in the supragranular layers of FEF that do not project to the SC subserve visual target selection (Thompson et al. 1996). Thus the weight of the evidence seems to us to support the distinction between visually responsive and movement-related neurons.
The distinction between visual and movement-related neurons is also reinforced by the distinct patterns of activation observed in the search-step and double-step data discussed previously; whereas neural selection in visual neurons did not distinguish between the type of response that would ensue, movement related neurons did. More problematic to this notion of a strict dichotomy are the neurons that seem to have a response pattern reflecting a composite of visual and movement patterns. Although in the selection of targets appearing in their response fields their pattern of discharge are like visual neurons, when targets disappear from their response fields they appear to behave like movement neurons displaying a decrease in their activity reminiscent of countermanding-like activity. Even though these data suggest that these so-called visuomovement neurons might reflect a continuum between sensory and motor processing, the activity of most visuomovement neurons in noncompensated trials continued to exhibit deselection albeit after the saccade. Since deselection in these neurons was not dependent on whether monkeys made a compensated or noncompensated response, unlike in movement neurons, we suggest that deselection is more reflective of sensory processing. Visual neurons that display such hybrid activity have also been reported previously from our lab in a different task that required monkeys to direct their saccades away from an oddball target (Sato and Schall 2003). In this task, in addition to target selection, a response-selection stage that maps the location of the target to a saccade is required for successful performance. Although the majority of visual neurons appeared to encode the location of the oddball target, irrespective of the endpoint of the saccade, the additional requirement of response selection, however, was reflected in the modulation pattern of some visual neurons. A similar remapping of retinal to spatial or oculomotor coordinates was also observed in a class of visual neurons (quasi-visual) described in the SC (Mays and Sparks 1980) and in the FEF (Goldberg and Bruce 1990). These data together lead us to believe that the pattern of visuomovement neurons we observed may be equivalent to the quasi-visual neurons (Mays and Sparks 1980) and type II neurons (Sato and Schall 2003) previously described and may represent a stage that selects the endpoint of the saccade, a step of processing that is more than visual processing but less than motor programming.
Mechanistic account of failures of inhibition
Normal visual behavior is accomplished through a continuous cycle of fixation and visual analysis interrupted by saccades. The loose coupling between fixation duration and endpoint accuracy in visual search (e.g., Hooge and Erkelens 1996) provides the basis for distinguishing between the process responsible for specifying where gaze will be directed from the process specifying when gaze will shift and provides an explanation of how errors of search can occur. One account for errors in the search-step task is that the visual neurons simply do not signal the location of the target after it steps to a new location. In fact, more naturalistic studies have shown that misjudgments can happen due to failure to update the representation of a changed feature of fixated objects (Droll et al. 2005). However, we found that visually responsive neurons in FEF did commonly select the new location of the target (see also Murthy et al. 2001). Thus the production of a compensated saccade was not an automatic consequence of the selection of the new target location. There are two possible explanations for this result that may not be mutually exclusive. One explanation is that on some trials the STOP process was not effectively engaged by the visual selection. The second explanation is that for some trials visual selection may not be sufficiently strong to overcome the strong activation of movement neurons that produce the noncompensated saccades. In such trials we imagine that the response of movement neurons that instantiates the GO process producing the noncompensated saccade is too advanced to be interrupted by the STOP process.
Both of these explanations are consistent with the general hypothesis that there are at least two levels or stages of representation in FEF, one for visual selection and the other for motor preparation. The visual selection stage corresponds to the formation of the visual salience map of the location of potential targets for orienting of attention. The motor representation stage corresponds to the development of activity that will produce a saccade unless it is interrupted. Such a multilayer architecture of sensory–motor transformation affords flexibility of stimulus response mapping at the cost of occasional disagreements between the two stages. However, these disagreements create opportunities to investigate the neural mechanisms of sensory–motor transformations.
GRANTS
This work was supported by Robin and Richard Patton through the E. Bronson Ingram Chair in Neuroscience and National Institutes of Health Grants T32 EY-08126, F32 EY-14502, R01 EY-8890, P30 EY-08126, and P30 HD-015052.
Acknowledgments
We thank C. Camalier for assistance with the analysis of behavior, E. Gotcher-Priddy for assistance in manuscript preparation, S. Hoffman for assistance with TEMPO, and M. Feurtado for animal care. A. Murthy, J. D. Schall, and K. G. Thompson conceived and designed the experiment; A. Murthy carried out the experiment; S. M. Shorter analyzed behavioral data; S. Ray analyzed physiology data; S. M. Shorter and S. Ray prepared illustrations; and A. Murthy, J. D. Schall, S. M. Shorter, and S. Ray wrote the manuscript.
Footnotes
According to the race model, the probability of reprogramming a saccade when the target is displaced depends on TSRT, the target-step delay, and the form of the distribution of response times on no-step trials. To ensure the most valid comparisons between neural activity on target-step trials and no-step trials, it is necessary to equate trials on the basis of response latency. The logic is that compensated saccades to the final target location must be compared with the latest portion of the no-step distribution, those saccades that were late enough that, had the target step occurred, there would be sufficient time to reprogram the saccade to the final target location. Likewise, noncompensated saccades must be compared with the no-step saccades with latencies so short that had the target step occurred, there would not be enough time to inhibit the saccade to the original target location.
REFERENCES
- Aslin and Shea 1987.Aslin RN, Shea SL. The amplitude and angle of saccades to double-step target displacements. Vision Res 27: 1925–1942, 1987. [DOI] [PubMed] [Google Scholar]
- Asrress and Carpenter 2001.Asrress KN, Carpenter RHS. Saccadic countermanding: a comparison of central and peripheral stop signals. Vision Res 41: 2645–2651, 2001. [DOI] [PubMed] [Google Scholar]
- Awater and Lappe 2006.Awater H, Lappe M. Mislocalization of perceived saccade target position induced by perisaccadic visual stimulation. J Neurosci 26: 12–20, 2006. [DOI] [PMC free article] [PubMed] [Google Scholar]
- Band et al. 2003.Band G, van der Molen M, Logan G. Horse-race model simulations of the stop-signal procedure. Acta Psychol 112: 105–142, 2003. [DOI] [PubMed] [Google Scholar]
- Becker and Jürgens 1979.Becker W, Jürgens R. An analysis of the saccadic system by means of double step stimuli. Vision Res 19: 967–983, 1979. [DOI] [PubMed] [Google Scholar]
- Bichot et al. 1999.Bichot NP, Cave KR, Pashler H. Visual selection mediated by location: feature-based selection of noncontiguous locations. Percept Psychophys 61: 403–423, 1999. [DOI] [PubMed] [Google Scholar]
- Bichot and Schall 1999.Bichot NP, Schall JD. Saccade target selection in macaque during feature and conjunction visual search. Vis Neurosci 16: 81–89, 1999. [DOI] [PubMed] [Google Scholar]
- Bichot et al. 2001.Bichot NP, Thompson KG, Rao SC, Schall JD. Reliability of macaque frontal eye field neurons signaling saccade targets during visual search. J Neurosci 21: 713–725, 2001. [DOI] [PMC free article] [PubMed] [Google Scholar]
- Boucher et al. 2007.Boucher L, Palmeri TJ, Logan GD, Schall JD. Inhibitory control in mind and brain: an interactive race model of countermanding saccades. Psychol Rev 114: 376–397, 2007. [DOI] [PubMed] [Google Scholar]
- Brown et al. 2008.Brown JW, Hanes DP, Schall JD, Stuphorn V. Relation of frontal eye field activity to saccade initiation during a countermanding task. Exp Brain Res 190: 135–151, 2008. [DOI] [PMC free article] [PubMed] [Google Scholar]
- Bruce and Goldberg 1985.Bruce CJ, Goldberg ME. Primate frontal eye fields. I. Single neurons discharging before saccades. J Neurophysiol 53: 603–635, 1985. [DOI] [PubMed] [Google Scholar]
- Bullock and Rhodes 2003.Bullock D, Rhodes B. Competitive queuing for planning and serial performance. In: The Handbook of Brain Theory and Neural Networks, edited by Arbib MA. Cambridge, MA: MIT Press, 2003, p. 241–248.
- Cabel et al. 2000.Cabel D, Armstrong I, Reingold E, Munoz D. Control of saccade initiation in a countermanding task using visual and auditory stop signals. Exp Brain Res 133: 431–441, 2000. [DOI] [PubMed] [Google Scholar]
- Camalier et al. 2007.Camalier CR, Gotler A, Murthy A, Thompson KG, Logan GD, Palmeri TJ, Schall JD. Dynamics of saccade target selection: race model analysis of double step and search step saccade production in human and macaque. Vision Res 47: 2187–2211, 2007. [DOI] [PMC free article] [PubMed] [Google Scholar]
- Cohen et al. 2009.Cohen JY, Pouget P, Heitz RP, Woodman GF, Schall JD. Biophysical support for functionally distinct cell types in the frontal eye field. J Neurophysiol 101: 912–916, 2009. [DOI] [PMC free article] [PubMed] [Google Scholar]
- Corbetta and Shulman 2002.Corbetta M, Shulman GL. Control of goal-driven and stimulus driven attention in the brain. Nat Rev Neurosci 3: 201–215, 2002. [DOI] [PubMed] [Google Scholar]
- Corneil and Munoz 1996.Corneil BD, Munoz DP. The influence of auditory and visual distractors on human orienting gaze shifts. J Neurosci 16: 8193–8207, 1996. [DOI] [PMC free article] [PubMed] [Google Scholar]
- Crist et al. 1988.Crist CF, Yamasaki DS, Komatsu H, Wurtz RH. A grid system and a microsyringe for single cell recording. J Neurosci Methods 26: 117–122, 1988. [DOI] [PubMed] [Google Scholar]
- Dassonville et al. 1995.Dassonville P, Schlag J, Schlag-Rey M. The use of egocentric and exocentric location cues in saccadic programming. Vision Res 35: 2191–2199, 1995. [DOI] [PubMed] [Google Scholar]
- DeJong et al. 1990.DeJong R, Coles MGH, Logan GD, Gratton G. Searching for the point of no return: the control of response processes in speeded choice reaction performance. J Exp Psychol Hum Percept Perform 16: 164–182, 1990. [DOI] [PubMed] [Google Scholar]
- DeJong et al. 1995.DeJong R, Coles MGH, Logan GD, Gratton G. Strategies and mechanisms in nonselective and selective inhibitory motor control. J Exp Psychol Hum Percept Perform 21: 498–511, 1995. [DOI] [PubMed] [Google Scholar]
- Deubel et al. 1986.Deubel H, Wolf W, Hauske G. Adaptive gain control of saccadic eye movements. Hum Neurobiol 5: 245–253, 1986. [PubMed] [Google Scholar]
- DiCarlo and Maunsell 2005.DiCarlo JJ, Maunsell JHR. Using neuronal latency to determine sensory–motor processing pathways in reaction time tasks. J Neurophysiol 93: 2974–2986, 2005. [DOI] [PubMed] [Google Scholar]
- Droll et al. 2005.Droll JA, Hayhoe MM, Triesch J, Sullivan BT. Task demands control acquisition and storage of visual information. J Exp Psychol 31: 1416–1438, 2005. [DOI] [PubMed] [Google Scholar]
- Duhamel et al. 1992.Duhamel JR, Colby CL, Goldberg ME. The updating of the representation of visual space in parietal cortex by intended eye movements. Science 255: 90–92, 1992. [DOI] [PubMed] [Google Scholar]
- Emeric et al. 2007.Emeric EE, Brown JW, Boucher L, Carpenter RHS, Hanes DP, Harris R, Logan GD, Mashru RN, Paré M, Pouget P. Influence of history on saccade countermanding performance in humans and macaque monkeys. Vision Res 47: 35–49, 2007. [DOI] [PMC free article] [PubMed] [Google Scholar]
- Findlay and Harris 1984.Findlay JM, Harris LR. Small saccades to double-stepped targets moving in two dimensions. In: Theoretical and Applied Aspects of Eye Movement Research, edited by Gale AG, Johnson F. Amsterdam: Elsevier, 1984, p. 71–78.
- Fries 1984.Fries W Cortical projections to the superior colliculus in the macaque monkey: a retrograde study using horseradish peroxidase. J Comp Neurol 230: 55–76, 1984. [DOI] [PubMed] [Google Scholar]
- Gnadt and Andersen 1988.Gnadt JW, Andersen RA. Memory related motor planning activity in posterior parietal cortex of macaque. Exp Brain Res 70: 216–220, 1988. [DOI] [PubMed] [Google Scholar]
- Goldberg and Bruce 1990.Goldberg ME, Bruce CJ. Primate frontal eye fields. III. Maintenance of a spatially accurate saccade signal. J Neurophysiol 64: 489–508, 1990. [DOI] [PubMed] [Google Scholar]
- Green and Swets 1966.Green DM, Swets JA. Signal Detection Theory. Psychophysics. New York: Wiley, 1966.
- Guthrie et al. 1983.Guthrie BL, Porter JD, Sparks DL. Corollary discharge provides accurate eye position information to the oculomotor system. Science 221: 1193–1195, 1983. [DOI] [PubMed] [Google Scholar]
- Hallett and Lightstone 1976a.Hallett PE, Lightstone AD. Saccadic eye movements to flashed targets. Vision Res 16: 107–114, 1976a. [DOI] [PubMed] [Google Scholar]
- Hallett and Lightstone 1976b.Hallett PE, Lightstone AD. Saccadic eye movements towards stimuli triggered during prior saccades. Vision Res 16: 99–106, 1976b. [DOI] [PubMed] [Google Scholar]
- Hanes and Carpenter 1999.Hanes DP, Carpenter RHS. Countermanding saccades in human. Vision Res 39: 2777–2791, 1999. [DOI] [PubMed] [Google Scholar]
- Hanes et al. 1998.Hanes DP, Patterson WF, Schall JD. Role of frontal eye fields in countermanding saccades: visual, movement, and fixation activity. J Neurophysiol 79: 817–834, 1998. [DOI] [PubMed] [Google Scholar]
- Hanes and Schall 1995.Hanes DP, Schall JD. Countermanding saccades in macaque. Vis Neurosci 12: 929–937, 1995. [DOI] [PubMed] [Google Scholar]
- Hanes and Schall 1996.Hanes DP, Schall JD. Neural control of voluntary movement initiation. Science 274: 427–430, 1996. [DOI] [PubMed] [Google Scholar]
- Heiser and Colby 2006.Heiser LM, Colby CL. Spatial updating in area LIP is independent of saccade direction. J Neurophysiol 95: 2751–2767, 2006. [DOI] [PubMed] [Google Scholar]
- Helminski and Segraves 2003.Helminski JO, Segraves MA. Macaque frontal eye field input to saccade-related neurons in the superior colliculus. J Neurophysiol 90: 1046–1062, 2003. [DOI] [PubMed] [Google Scholar]
- Hikosaka and Wurtz 1983.Hikosaka O, Wurtz RH. Visual and oculomotor functions of monkey substantia nigra pars reticulata. III. Memory-contingent visual and saccade responses. J Neurophysiol 49: 1268–1284, 1983. [DOI] [PubMed] [Google Scholar]
- Holroyd et al. 2005.Holroyd CB, Yeung N, Coles MGH, Cohen JD. A mechanism for error detection in speeded response time tasks. J Exp Psychol Gen 134: 163–191, 2005. [DOI] [PubMed] [Google Scholar]
- Honda 1989.Honda H Perceptual localization of visual stimuli flashed during saccades. Percept Psychophys 45: 162–174, 1989. [DOI] [PubMed] [Google Scholar]
- Hooge and Erkelens 1996.Hooge ITC, Erkelens CJ. Control of fixation duration in a simple search task. Percept Psychophys 58: 969–976, 1996. [DOI] [PubMed] [Google Scholar]
- Horwitz and Newsome 1999.Horwitz GD, Newsome WT. Separate signals for target selection and movement specification in the superior colliculus. Science 284: 1158–1161, 1999. [DOI] [PubMed] [Google Scholar]
- Hou and Fender 1979.Hou RL, Fender DH. Processing of direction and magnitude by the saccadic eye-movement system. Vision Res 19: 1421–1426, 1979. [DOI] [PubMed] [Google Scholar]
- Ipata et al. 2006.Ipata AE, Gee AL, Goldberg ME, Bisley JW. Activity in the lateral intraparietal area predicts the goal and latency of saccades in a free-viewing visual search task. J Neurosci 26: 3656–3661, 2006. [DOI] [PMC free article] [PubMed] [Google Scholar]
- Juan et al. 2004.Juan CH, Shorter-Jacobi SM, Schall JD. Dissociation of spatial attention and saccade preparation. Proc Natl Acad Sci USA 101: 15541–15544, 2004. [DOI] [PMC free article] [PubMed] [Google Scholar]
- Kapoor and Murthy 2008.Kapoor V, Murthy A. Covert inhibition potentiates online control in a double-step task. J Vis 8: 1–16, 2008. [DOI] [PubMed] [Google Scholar]
- Khayat et al. 2006.Khayat PS, Spekreijse H, Roelfsema PR. Attention lights up new object representations before the old ones fade away. J Neurosci 26: 138–142, 2006. [DOI] [PMC free article] [PubMed] [Google Scholar]
- Kim and Connors 1993.Kim HG, Connors BW. Apical dendrites of the neocortex: correlation between sodium-and calcium-dependent spiking and pyramidal cell morphology. J Neurosci 13: 5301–5311, 1993. [DOI] [PMC free article] [PubMed] [Google Scholar]
- Komoda et al. 1973.Komoda MK, Festinger L, Phillips LJ, Duckman RH, Young RA. Some observations concerning saccadic eye movements. Vision Res 13: 1009–1020, 1973. [DOI] [PubMed] [Google Scholar]
- Kornylo et al. 2003.Kornylo K, Dill N, Saenz M, Krauzlis RJ. Cancelling of pursuit and saccadic eye movements in humans and monkeys. J Neurophysiol 89: 2984–2999, 2003. [DOI] [PubMed] [Google Scholar]
- Kusunoki and Goldberg 2003.Kusunoki M, Goldberg ME. The time course of perisaccadic receptive field shifts in the lateral intraparietal area of the monkey. J Neurophysiol 89: 1519–1527, 2003. [DOI] [PubMed] [Google Scholar]
- Lappin and Eriksen 1966.Lappin JS, Eriksen CW. Use of a delayed signal to stop a visual reaction-time response. J Exp Psychol 72: 805–811, 1966. [Google Scholar]
- Levy-Schoen and Blanc-Garin 1974.Levy-Schoen A, Blanc-Garin J. On oculomotor programming and perception. Brain Res 71: 443–450, 1974. [DOI] [PubMed] [Google Scholar]
- Lisberger et al. 1975.Lisberger SG, Fuchs AF, King WM, Evinger LC. Effect of mean reaction time on saccadic responses to two-step stimuli with horizontal and vertical components. Vision Res 15: 1021–1025, 1975. [DOI] [PubMed] [Google Scholar]
- Logan and Cowan 1984.Logan G, Cowan WB. On the ability to inhibit thought and action: a theory of an act of control. Psycholo Rev 91: 295–327, 1984. [Google Scholar]
- Logan and Irwin 2000.Logan GD, Irwin DE. Don't look! Don't touch! Inhibitory control of eye and hand movements. Psychon Bull Rev 7: 107–112, 2000. [DOI] [PubMed] [Google Scholar]
- Ludwig et al. 2007.Ludwig CJH, Mildinhall JW, Gilchrist ID. A population coding account for systematic variation in saccadic dead time. J Neurophysiol 97: 795–805, 2007. [DOI] [PubMed] [Google Scholar]
- Lünenburger et al. 2003.Lünenburger L, Lindner W, Hoffmann KP. Neural activity in the primate superior colliculus and saccadic reaction times in double-step experiments. Neural control of space coding and action production. Prog Brain Res 142: 91–107, 2003. [DOI] [PubMed] [Google Scholar]
- Mays and Sparks 1980.Mays LE, Sparks DL. Saccades are spatially, not retinotopically coded. Science 208: 163–161, 1980. [DOI] [PubMed] [Google Scholar]
- McPeek and Keller 2002a.McPeek RM, Keller EL. Saccade target selection in the superior colliculus during a visual search task. J Neurophysiol 88: 2019–2034, 2002a. [DOI] [PubMed] [Google Scholar]
- McPeek and Keller 2002b.McPeek RM, Keller EL. Superior colliculus activity related to concurrent processing of saccade goals in a visual search task. J Neurophysiol 87: 1805–1815, 2002b. [DOI] [PubMed] [Google Scholar]
- Mohler and Wurtz 1976.Mohler CW, Wurtz RH. Organization of monkey superior colliculus: intermediate layer cells discharging before eye movements. J Neurophysiol 39: 722–744, 1976. [DOI] [PubMed] [Google Scholar]
- Murthy et al. 2007.Murthy A, Ray S, Shorter SM, Priddy EG, Schall JD, Thompson KG. Frontal eye field contributions to rapid corrective saccades. J Neurophysiol 97: 1457–1469, 2007. [DOI] [PubMed] [Google Scholar]
- Murthy et al. 2000.Murthy A, Thompson KG, Schall JD. Neural control of saccade target selection: a comparison of search-step and double-step tasks. Soc Neurosci Abstr 26: 966, 2000. [Google Scholar]
- Murthy et al. 2001.Murthy A, Thompson KG, Schall JD. Dynamic dissociation of visual selection from saccade programming in frontal eye field. J Neurophysiol 86: 2634–2637, 2001. [DOI] [PubMed] [Google Scholar]
- Nelson et al. 2008.Nelson MJ, Boucher L, Logan GD, Palmeri TJ, Schall JD. Nonstationarity of saccade response time in stopping and stepping tasks. Program No. 770.11. 2008 Neuroscience Meeting Planner. Washington, DC: Society for Neuroscience, 2008, Online.
- Osman et al. 1986.Osman AM, Kornblum S, Meyer DE. The point of no return in choice reaction time: controlled and ballistic stages of response preparation. J Exp Psychol Hum Percept Perform 12: 243–258, 1986. [DOI] [PubMed] [Google Scholar]
- Osman et al. 1990.Osman AM, Kornblum S, Meyer DE. Does motor programming necessitate response execution? J Exp Psychol Hum Percept Perform 16: 183–198, 1990. [DOI] [PubMed] [Google Scholar]
- Paré and Hanes 2003.Paré M, Hanes DP. Controlled movement processing: superior colliculus activity associated with countermanded saccades. J Neurosci 23: 6480–6489, 2003. [DOI] [PMC free article] [PubMed] [Google Scholar]
- Park et al. 2003.Park J, Schlag-Rey M, Schlag J. Spatial localization precedes temporal determination in visual perception. Vision Res 43: 1667–1674, 2003. [DOI] [PubMed] [Google Scholar]
- Peng et al. 2008.Peng X, Sereno ME, Silva AK, Lehky SR, Sereno AB. Shape selectivity in primate frontal eye field. J Neurophysiol 100: 796–814, 2008. [DOI] [PMC free article] [PubMed] [Google Scholar]
- Posner et al. 1984.Posner MI, Walker JA, Friedrich FJ, Rafal RD. Effects of parietal injury on covert orienting of attention. J Neurosci 4: 1863–1874, 1984. [DOI] [PMC free article] [PubMed] [Google Scholar]
- Pouget et al. 2005.Pouget P, Emeric EE, Stuphorn V, Reis K, Schall JD. Chronometry of visual responses in frontal eye field, supplementary eye field, and anterior cingulate cortex. J Neurophysiol 94: 2086–2092, 2005. [DOI] [PubMed] [Google Scholar]
- Ray et al. 2004.Ray S, Schall JD, Murthy A. Programming of double-step saccade sequences: modulation by cognitive control. Vision Res 44: 2707–2718, 2004. [DOI] [PubMed] [Google Scholar]
- Rovamo and Virsu 1979.Rovamo J, Virsu V. An estimation and application of the human cortical magnification factor. Exp Brain Res 37: 495–510, 1979. [DOI] [PubMed] [Google Scholar]
- Sato et al. 2001.Sato T, Murthy A, Thompson KG, Schall JD. Search efficiency but not response interference affects visual selection in frontal eye field. Neuron 30: 583–591, 2001. [DOI] [PubMed] [Google Scholar]
- Sato and Schall 2003.Sato TR, Schall JD. Effects of stimulus-response compatibility on neural selection in frontal eye field. Neuron 38: 637–648, 2003. [DOI] [PubMed] [Google Scholar]
- Sayer et al. 1990.Sayer RJ, Friedlander MJ, Redman SJ. The time course and amplitude of EPSPs evoked at synapses between pairs of CA3/CA1 neurons in the hippocampal slice. J Neurosci 10: 826–836, 1990. [DOI] [PMC free article] [PubMed] [Google Scholar]
- Schall 1991.Schall JD Neuronal activity related to visually guided saccades in the frontal eye fields of rhesus monkeys: comparison with supplementary eye fields. J Neurophysiol 66: 559–579, 1991. [DOI] [PubMed] [Google Scholar]
- Schall 2004.Schall JD On the role of frontal eye field in guiding attention and saccades. Vision Res 44: 1453–1467, 2004. [DOI] [PubMed] [Google Scholar]
- Schall and Hanes 1993.Schall JD, Hanes DP. Neural basis of saccade target selection in frontal eye field during visual search. Nature 366: 467–469, 1993. [DOI] [PubMed] [Google Scholar]
- Schall et al. 1995.Schall JD, Hanes DP, Thompson KG, King DJ. Saccade target selection in frontal eye field of macaque. I. Visual and premovement activation. J Neurosci 15: 6905–6918, 1995. [DOI] [PMC free article] [PubMed] [Google Scholar]
- Schlag and Schlag-Rey 2002.Schlag J, Schlag-Rey M. Through the eye, slowly: delays and localization errors in the visual system. Nat Rev Neurosci 3: 191–215, 2002. [DOI] [PubMed] [Google Scholar]
- Schmolesky et al. 1998.Schmolesky MT, Wang Y, Hanes DP, Thompson KG, Leutgeb S, Schall JD, Leventhal AG. Signal timing across the macaque visual system. J Neurophysiol 79: 3272–3278, 1998. [DOI] [PubMed] [Google Scholar]
- Schreij et al. 2008.Schreij D, Owens C, Theeuwes J. Abrupt onsets capture attention independent of top-down control settings. Percept Psychophys 70: 208–218, 2008. [DOI] [PubMed] [Google Scholar]
- Segraves 1992.Segraves MA Activity of monkey frontal eye field neurons projecting to oculomotor regions of the pons. J Neurophysiol 68: 1967–1985, 1992. [DOI] [PubMed] [Google Scholar]
- Segraves and Goldberg 1987.Segraves MA, Goldberg ME. Functional properties of corticotectal neurons in the monkey's frontal eye field. J Neurophysiol 58: 1387–1419, 1987. [DOI] [PubMed] [Google Scholar]
- Shen and Paré 2007.Shen K, Paré M. Neuronal activity in superior colliculus signals both stimulus identity and saccade goals during visual conjunction search. J Vis 7: 1–13, 2007. [DOI] [PubMed] [Google Scholar]
- Smith and Schenk 2007.Smith DT, Schenk T. Enhanced probe discrimination at the location of a colour singleton. Exp Brain Res 181: 367–375, 2007. [DOI] [PubMed] [Google Scholar]
- Sommer and Wurtz 2001.Sommer MA, Wurtz RH. Frontal eye field sends delay activity related to movement, memory, and vision to the superior colliculus. J Neurophysiol 85: 1673–1685, 2001. [DOI] [PubMed] [Google Scholar]
- Sommer and Wurtz 2006.Sommer MA, Wurtz RH. Influence of the thalamus on spatial visual processing in frontal cortex. Nature 444: 374–377, 2006. [DOI] [PubMed] [Google Scholar]
- Sparks 1978.Sparks DL Functional properties of neurons in the monkey superior colliculus: coupling of neuronal activity and saccade onset. Brain Res 156: 1–16, 1978. [DOI] [PubMed] [Google Scholar]
- Theeuwes and Burger 1998.Theeuwes J, Burger R. Attentional control during visual search: the effect of irrelevant singletons. J Exp Psychol Hum Percept Perform 24: 1342–1353, 1998. [DOI] [PubMed] [Google Scholar]
- Thomas and Paré 2007.Thomas NWD, Paré M. Temporal processing of saccade targets in parietal cortex area LIP during visual search. J Neurophysiol 97: 942–947, 2007. [DOI] [PubMed] [Google Scholar]
- Thompson et al. 2005a.Thompson KG, Bichot NP, Sato TR. Frontal eye field activity before visual search errors reveals the integration of bottom-up and top-down salience. J Neurophysiol 93: 337–351, 2005a. [DOI] [PMC free article] [PubMed] [Google Scholar]
- Thompson et al. 1997.Thompson KG, Bichot NP, Schall JD. Dissociation of visual discrimination from saccade programming in macaque frontal eye field. J Neurophysiol 77: 1046–1050, 1997. [DOI] [PubMed] [Google Scholar]
- Thompson et al. 2005b.Thompson KG, Biscoe KL, Sato TR. Neuronal basis of covert spatial attention in the frontal eye field. J Neurosci 25: 9479–9487, 2005b. [DOI] [PMC free article] [PubMed] [Google Scholar]
- Thompson et al. 1996.Thompson KG, Hanes DP, Bichot NP, Schall JD. Perceptual and motor processing stages identified in the activity of macaque frontal eye field neurons during visual search. J Neurophysiol 76: 4040–4055, 1996. [DOI] [PubMed] [Google Scholar]
- Tian et al. 2000.Tian J, Schlag J, Schlag-Rey M. Testing quasi-visual neurons in the monkey's frontal eye field with the triple-step paradigm. Exp Brain Res 130: 433–440, 2000. [DOI] [PubMed] [Google Scholar]
- Umeno and Goldberg 1997.Umeno MM, Goldberg ME. Spatial processing in the monkey frontal eye field. I. Predictive visual responses. J Neurophysiol 78: 1373–1383, 1997. [DOI] [PubMed] [Google Scholar]
- Umeno and Goldberg 2001.Umeno MM, Goldberg ME. Spatial processing in the monkey frontal eye field. II. Memory responses. J Neurophysiol 86: 2344–2352, 2001. [DOI] [PubMed] [Google Scholar]
- Verbruggen et al. 2008.Verbruggen F, Schneider DW, Logan GD. How to stop and change a response: the role of goal activation in multi-tasking. J Exp Psychol Hum Percept Perform 34: 1212–1228, 2008. [DOI] [PubMed] [Google Scholar]
- Vince 1948.Vince MA The intermittency of control movements and the psychological refractory period. Br J Psychol 38: 149–157, 1948. [DOI] [PubMed] [Google Scholar]
- Westheimer 1954.Westheimer G Eye movements to horizontally moving visual stimulus. Arch Ophthalmol 52: 932–941, 1954. [DOI] [PubMed] [Google Scholar]
- Wheeless et al. 1966.Wheeless LL, Boynton RM, Cohen GH. Eye-movement responses to step and pulse-step stimuli. J Opt Soc Am 56: 956–960, 1966. [DOI] [PubMed] [Google Scholar]
- Woodman et al. 2008.Woodman GF, Kang MS, Thompson KG, Schall JD. The effect of visual search efficiency on response preparation: neurophysiological evidence for discrete flow. Psychol Sci 19: 128–136, 2008. [DOI] [PMC free article] [PubMed] [Google Scholar]
- Xiao et al. 2006.Xiao Q, Barborica A, Ferrera VP. Radial motion bias in macaque frontal eye field. Vis Neurosci 23: 49–60, 2006. [DOI] [PubMed] [Google Scholar]