

Abstract
T1r3 is a critical subunit of T1r sweet taste receptors. Here we studied how the absence of T1r3 impacts responses to sweet stimuli by taste neurons in the nucleus tractus solitarius (NTS) of the mouse. The consequences bear on the multiplicity of sweet taste receptors and how T1r3 influences the distribution of central gustatory neurons. Taste responses to glycine, sucrose, NaCl, HCl, and quinine were electrophysiologically recorded from single NTS neurons in anesthetized T1r3 knockout (KO) and wild-type (WT) C57BL/6 mice. Other stimuli included l-proline, d-fructose, d-glucose, d-sorbitol, Na-saccharin, acesulfame-K, monosodium glutamate, NaNO3, Na-acetate, citric acid, KCl, denatonium, and papaverine. Forty-one WT and 41 KO neurons were recorded. Relative to WT, KO responses to all sweet stimuli were significantly lower, although the degree of attenuation differed among stimuli, with near zero responses to sugars but salient residual activity to artificial sweeteners and glycine. Residual KO across-neuron responses to sweet stimuli were variably similar to nonsweet responses, as indexed by multivariate and correlation analyses. In some cases, this suggested that residual KO activity to “sweet” stimuli could be mediated by nonsweet taste receptors, implicating T1r3 receptors as primary contributors to NTS sweet processing. The influence of T1r3 on the distribution of NTS neurons was evaluated by comparing neuron types that emerged between WT and KO cells. Neurons tuned toward sweet stimuli composed 34% of the WT sample but did not appear among KO cells. Input from T1r3-containing receptors critically guides the normal development of NTS neurons oriented toward sweet tastants.
INTRODUCTION
Preference and intake of substances humans describe as tasting sweet, such as sugars and artificial sweeteners, vary widely among inbred strains of mice. This variation is largely determined by a single chromosomal region known as the Sac (saccharin preference) locus (Bachmanov et al. 1996; Capeless and Whitney 1995; Fuller 1974; Lush 1989). Sac corresponds to the gene Tas1r3, which is expressed in taste bud cells, is polymorphic between mouse strains with robust and relatively weak preference for sweet stimuli, and encodes T1r3, a taste receptor subunit (Bachmanov et al. 2001; Kitagawa et al. 2001; Max et al. 2001; Montmayeur et al. 2001; Nelson et al. 2001; Sainz et al. 2001). T1r3 combines with T1r2 to form a functional taste receptor for a broad range of sweet stimuli (Li et al. 2002; Nelson et al. 2001). Mice that would normally prefer sweet tastants but are genetically altered to lack the T1r3 subunit (T1r3 knockouts) display dramatic reductions in their preference and intake of multiple types of sweet-tasting substances, including sugars and artificial sweeteners (Damak et al. 2003; Zhao et al. 2003).
Defining how the activation of T1r3-containing receptors gives rise to appetitive responses toward sweet stimuli will require knowledge of how input mediated by T1r3 shapes the processing of sweet tastants in the brain, which interprets incoming receptor messages and ultimately executes the appropriate perceptual and behavioral response. Understanding this issue is complicated by several lines of evidence raising the possibility that more than one class of gustatory receptor could contribute to the central processing of sweet taste. For example, T1r3 knockout mice still maintain an ability to detect sugars under certain taste behavioral paradigms, and peripheral gustatory nerves in these animals still respond to particular sweet tastants (Damak et al. 2003; Delay et al. 2006). Importantly, variation at Tas1r3 influences taste behavioral and peripheral gustatory nerve sensitivity to many but not all sweet stimuli, as shown through genetic linkage analyses in hybrid mice and experiments using congenic mice with different T1r3 alleles (Inoue et al. 2004, 2007). Although there are multiple possible explanations for these observations, one is that there exist T1r3-independent taste receptor mechanisms for detecting sweet stimuli (Damak et al. 2003; Delay et al. 2006; Inoue et al. 2004, 2007). Because of the potential multiplicity of sweet taste receptors, it is not easily intuited from the extant literature as to how T1r3 receptors contribute to responses in sweet-sensitive central gustatory neurons and influence the emergence of different types of sweet-responsive cells.
Here we examined the contribution of T1r3-containing taste receptors to sensitivity to sweet stimuli in first-order central gustatory neurons. Taste responses to a variety of stimuli were electrophysiologically recorded from neurons in nucleus tractus solitarius (NTS) in T1r3 knockout (KO) (Damak et al. 2003) and wild-type (WT) control mice. The stimulus-response properties of these neurons were compared between genotypes to determine the influence of T1r3 on the processing of sweet stimuli in NTS. This work contributes to our understanding of the multiplicity of taste receptors for sweet stimuli and has implications for how sensory input from T1r3-containing receptors guides the development of tuning orientations among gustatory neurons in the CNS.
Portions of these results were presented in preliminary form at the 2007 meeting of the Association for Chemoreception Sciences, Sarasota, FL, and the 2008 International Symposium on Olfaction and Taste, San Francisco, CA.
METHODS
Animals
Adult male and female C57BL/6 WT and T1r3 KO mice were used. All animals were naive to taste solutions and had not been used in prior experiments. WT mice were originally obtained from The Jackson Laboratory (Bar Harbor, ME). Homozygous T1r3 KO (−/−) mice, which were developed from the C57BL/6 strain and lack the entire T1r3 coding region, were as described (Damak et al. 2003). WT and T1r3 KO mice are genetically identical with the exception that KOs carry a nonfunctional T1r3 allele. Animals were reared at The University of Tennessee Health Science Center, where they were housed in a vivarium that maintained a 12-h light/dark cycle and an ambient temperature of ∼23°C. Food and water were available ad libitum. Random WT and KO mice were genotyped using PCR amplification of tail DNA.
Animals were prepared for electrophysiological recording in accordance with Institutional Animal Care and Use Committee and National Institutes of Health guidelines. First, mice were anesthetized using urethane (1 g/kg, ip) followed by pentobarbital (0.05 g/kg, ip). Injections were separated by 3–5 min. Once anesthetized, each mouse was tracheotomized and secured in a nontraumatic head holder that angled the snout ∼30° downward; this configuration served to minimize brain stem movements associated with breathing. The occipital bone was removed and parts of the cerebellum were aspirated to expose the brain stem and allow vertical access to the rostral, gustatory NTS. Body temperature was maintained at ∼35°C by a heating pad. Supplements of urethane (∼0.15 g/kg each, ip) were given as needed to maintain anesthesia throughout an experiment.
Electrophysiological recording
The region of the brain stem containing the rostral, gustatory-sensitive pole of the NTS was visually located using vascular landmarks on the dorsal surface of the exposed tissue (Supplemental Fig. S11; Lemon and Smith 2005; Lemon et al. 2004). A hydraulic manipulator was used to slowly advance the microelectrode ventrally through the brain stem. The region of the NTS containing gustatory-responsive neurons was identified by a change in neural activity associated with the application of various taste stimuli to the mouth.
Extracellular action potentials were recorded from single units in gustatory NTS using etched tungsten microelectrodes, insulated except for the tip (impedance = 1–8 MΩ at 1 kHz; FHC, Bowdoinham, ME). Electrophysiological activity was band-pass filtered (bandwidth = 0.3–6 kHz), differentially amplified 5,000 times (Grass P511 with high-impedance probe), and monitored on a storage oscilloscope and loudspeaker. Neural activity was digitized (sampling rate = 25 kHz) and action potentials generated by an individual neuron identified based on waveform consistency, which was assessed using a spike-waveform template-matching algorithm (Power1401 data acquisition interface/Spike2 software, CED, Cambridge, UK). Digital records of spike trains recorded from each neuron were downloaded to storage media for later analysis.
Taste stimuli
Single NTS neurons were tested with 18 different taste chemicals (Table 1) applied to the mouse oral cavity. Some cells were lost before completion of all stimulus trials, although we structured the stimulus presentation sequence to enable a usable data array to be collected from each neuron. The stimulus battery included sodium and nonsodium salts, acids, bitter tastants, and a set of stimuli generally classified as sweet. Diverse sweet stimuli were tested, including mono- and disaccharides, artificial sweeteners, a sugar alcohol, and sweet-tasting amino acids, such as glycine. It is noteworthy that the taste of glycine is insensitive to variation at the T1r3 genetic locus (Inoue et al. 2004, 2007). Stimuli were reagent grade and originally purchased from standard suppliers (Sigma and Fisher) with the exception of acesulfame-K, which was a gift to the laboratory of D. V. Smith. Stimuli were dissolved in deionized water and presented at room temperature. WT and KO neurons were tested with a common set of stimulus concentrations, herein referred to as standard concentrations or the standard stimuli (Table 1). Considering published data available on the majority of stimuli used here, the standard concentrations evoke effective integrated responses in peripheral taste nerves in WT mice (Danilova and Hellekant 2003; Gannon and Contreras 1995; Inoue et al. 2004, 2007). For experiments on neurons in WT mice, multiple concentrations of selected tastants were also included to more completely characterize neural tuning orientation and selectivity (Table 1).
TABLE 1.
Taste stimuli, their abbreviations, and concentrations
| Stimulus | Class | Abbreviation | Concentration, M |
|---|---|---|---|
| Block 1 | |||
| Glycine | Sweet | G | 0.1, 0.3, 0.5, 1 |
| Sucrose | Sweet | S | 0.3, 0.5, 1 |
| NaCl | Salt | N | 0.01, 0.03, .1 |
| HCl | Acid | H | 0.001, 0.003, 0.01 |
| Quinine-HCl | Bitter | Q | 0.001, 0.003, 0.01 |
| Block 2 | |||
| d-sorbitol | Sweet | sor | 1 |
| d-fructose | Sweet | fru | 1 |
| l-proline | Sweet | pro | 1 |
| Na+-saccharin | Art. sweet | sac | 0.01 |
| Acesulfame-K+ | Art. sweet | ace | 0.1 |
| l-glutamic acid (Na+) | Glutamate | msg | 0.5 |
| Block 3 | |||
| d-glucose | Sweet | glu | 1 |
| Na+-acetate | Salt | naa | 0.1 |
| Na+-nitrate | Salt | nan | 0.1 |
| Potassium chloride | Salt | kcl | 0.1 |
| Citric acid | Acid | cit | 0.01 |
| Papaverine-HCl | Bitter | pap | 0.03 |
| Denatonium benzoate | Bitter | den | 0.01 |
Standard concentrations are in bold.
Taste solutions were tested in partially random order. Stimuli were assigned to one of three blocks (Table 1) that were presented using the same sequence for each cell, although stimulus presentation order within a block was randomized to control for possible carryover effects. Segregating stimuli into sequential, randomized blocks, rather than randomizing presentation order across all stimuli, aimed to facilitate collection of at least a common set of partial, usable data among neurons in case some cells were lost later in a recording session. For blocks including the concentration series in WT neurons, multiple concentrations of a stimulus were tested in ascending order although the ordering of the stimuli within that block was randomized. When possible, neurons were repeatedly tested with stimuli to index how reliably the initial response to a tastant could predict subsequent responses to this stimulus.
Taste solutions were delivered to the tongue and palate via a funnel/gravity flow system at a rate of ∼1.4 ml/s. A multiple-way solenoid fluid valve (MCV-3V-M6, Takasago Electric, Nagoya, Japan), which was controlled by the data acquisition system, regulated stimulus delivery. An elbowed, polyethylene tube extended from the output port of this valve and was directed toward the palate of each subject. Solutions bathed both the palate and tongue, as they were deflected downward to the tongue on encountering the palate. The solution flow rate and small size of the mouse oral cavity allowed for nearly simultaneous stimulation of the palate and tongue. The delivery system appeared to provide nearly whole mouth stimulation based on a test using methylene blue dye. Visual inspection of a mouse using a dissecting microscope showed that presentation of dye via the delivery system clearly stained the palate, nasoincisor ducts and the majority of the tongue including the anterior portion innervated by the VIIth nerve, which is thought to mediate perceptual taste discriminations in rodents (Spector and Grill 1992; St. John and Spector 1998).
During the search phase, gustatory neurons were sought out and isolated while driving them with brief presentations of taste stimuli, subsequently rinsed from the mouth using deionized water. In a few initial experiments, a quaternary mixture of (in M) 1 glycine, 0.1 NaCl, 0.01 HCl, and 0.01 quinine-HCl was used to find taste cells. Because the NaCl component of this mixture may lead to a tendency to select neurons highly sensitive to NaCl, prominent in rostral NTS, it was opted to use only binary or single stimulus search solutions and to also include 0.5 M sucrose. We attempted to balance across neurons and genotype the number of times each stimulus was used in the search process. The majority of neurons reported here were located using the latter search strategy.
During data acquisition, stimulus trials followed a water → stimulus → water protocol. Deionized water was presented first for 6 s, followed immediately by a stimulus for 6 s, and then the flow returned to deionized water. One to 2 min were allowed to elapse between trials, which was sufficient time to allow neurons to return to baseline levels of spontaneous firing. The stimulus delivery system was thoroughly rinsed with deionized water between stimulus presentations.
Data analysis
Taste responses were quantified as the number of spikes during the first second of a stimulus response minus the number of spikes in the 1-s period that preceded stimulus onset. Analyses focused on the first second of activity as behavioral data indicate rodents can take <1 s to decide the identity of a taste stimulus (Halpern 1985; Halpern and Tapper 1971; Scott 1974). To attempt to circumvent inconsistencies in response quantification in this brief window because of subtle vagaries in the flow of different stimuli or variability in neural activation, response onset, rather than being assigned to stimulus onset, was defined for each trial by using a sliding-window statistical method (Di Lorenzo and Lemon 2000). Here, the spike train was divided into 50-ms bins, where each bin held a spike count. It was evaluated whether or not the mean of a 10-bin window beginning at 250 ms after stimulus onset was greater than the mean prestimulus firing rate by 1.96 SD (i.e., 95% confidence). If greater, a significant response was detected and the time of the first bin within the window in which the spike count was at least one was defined as response onset. Otherwise, the window was advanced one bin forward in time and the window and prestimulus means compared again. This algorithm reiterated until either a response could be detected or the first bin of the window moved beyond 2 s after stimulus onset (i.e., no detectable response), in which case response onset was arbitrarily set to 500 ms following stimulus onset. This routine was carried out using custom code implemented in the Spike2 script language. This code also generated for each neuron a file that contained all taste response statistics and data. The volume of data stored in these files for all neurons was managed and formatted for analyses by custom C++ code compiled under GCC version 2.95.3 (http://gcc.gnu.org).
Taste responses were compared between strains to determine the contribution of T1r3 to the sweet sensitivity properties of NTS neurons. Some comparisons used ANOVA. Others involved multiple comparisons among groups of neurons with unequal n's, accomplished using a two-tailed t-test and a Bonferroni-corrected α. For each neuron, responses to stimuli repeatedly tested (at the same concentration) were averaged before analysis. Correlations among taste responses were assessed using Pearson's r. These statistics were computed using STATISTICA (version 6.1 StatSoft, Tulsa, OK).
Exploratory visualization of across-neuron patterns of response was carried out using multidimensional scaling (MDS). MDS was performed using the Statistics Toolbox version 5.0 for MATLAB (Release 14, The MathWorks, Natick, MA). Pairwise Euclidean distances among data points were used for this analysis. MDS can generate a compact representation of high-dimensional data (e.g., responses to stimuli across many neurons) that captures particular modes of variability and relationships extant in multivariate data.
Hierarchical cluster analyses were used to identify general trends in responding among WT and KO neurons. This technique lumped cells into groups by similarities in their stimulus-response properties. Input to cluster analyses were matrices of Pearson correlations among neurons computed by their responses to representative sweet, salty, sour, and bitter stimuli. Cluster analyses were performed using STATISTICA and the “unweighted pair-group average” amalgamation schedule. Cluster analysis defined neural groupings based on multiple responses, providing a more rigorous classification than simply using a cell's best stimulus.
RESULTS
PCR amplification of DNA sampled from WT (n = 4) and T1r3 KO mice (n = 3) verified the presence of the T1r3 allele in WT mice and an absence of this gene in KOs (Supplemental Fig. S2A). PCR also confirmed in DNA from KO mice the presence of the neomycin cassette inserted in place of the T1r3 allele (Damak et al. 2003).
Neural sampling characteristics
Trains of action potentials recorded from 82 gustatory-responsive neurons were analyzed. Histological analysis indicated that electrode placement targeted taste neurons in NTS (Supplemental Fig. S2B). Forty-one cells were sampled from 21 WT mice [10 males, 11 females; mean body weight: males = 28.8 ± 1 (SE) g; females = 23.3 ± 0.6 g], and 41 neurons were recorded from 24 KO mice (16 males, 8 females; mean body weight: males = 30.5 ± 0.6 g; females = 22.8 ± 1 g). Nineteen WT cells were from males and 22 were from females. In KO mice, 26 cells were recorded from males and 15 were from females. To determine if sex influenced neural activity in each strain a 2 × 5 mixed ANOVA was performed on responses to (in M) 0.5 sucrose, 1 glycine, 0.1 NaCl, 0.01 HCl, and 0.01 quinine; this battery included prototypical sweet, salty, sour, and bitter tastants. In both strains, the main effect of sex and sex × stimulus interaction were nonsignificant (P > 0.3), indicating that taste responses did not differ between males and females. Thus sex was not included as a factor in subsequent analyses.
Analyses of WT neurons involved data from a total of 1141 stimulus trials, where the mean number of trials recorded from a single cell was 28 ± 2 (minimum = 16; maximum = 49). Data from 738 trials were acquired from KO neurons. For KO cells, the mean number of trials sampled was 18 ± 1.1 (minimum = 7; maximum = 34). Across all trials, mean spontaneous firing rates for WT and KO neurons were 2 ± 0.1 and 2.5 ± 0.2 spikes/s, respectively. When an individual stimulus was repeatedly tested (at the same concentration), it was presented to WT neurons on average 2.3 ± 0.1 times (minimum = 2; maximum = 11) and to KO cells on average 2.1 ± 0.04 times (minimum = 2; maximum = 3). An analysis of 206 (125 WT, 81 KO) pairs of initial and subsequent stimulus responses showed them to be strongly positively correlated (r = +0.89, P < 0.05). Thus the first sampled response to a stimulus provided a reasonable estimate of how a neuron would respond to this tastant over multiple presentations. This is important for cases where stimuli could be tested only once. The taste response characteristics of sample WT and KO NTS neurons are presented in Fig. 1.
FIG. 1.

Neural sampling characteristics. A: digitial oscilloscope records from 2 wild-type (WT) and 2 knockout (KO) neurons. Upward arrow indicates taste stimulus onset. B: taste response properties of an example WT and KO neuron. The WT neuron was stimulated with 40 stimulus trials and the KO cell was tested with 28. The response magnitude to each stimulus is represented by a bar. An integer above a bar indicates a value averaged over that many trials. Sample portions of digital oscilloscope sweeps for each neuron are shown. Also shown for each cell is an example of spike sorting/capture; 10 sequential action potentials are superimposed.
All WT neurons were tested with the concentration series for each block 1 tastant (Table 1). WT cells showed a wide range of sensitivities, from tuned mainly to only a single class of tastant to broadly responsive to all block 1 stimuli (Fig. 2). For some WT neurons, their broad tuning and concentration-dependent responses did not fit with the traditional “best stimulus” neural classification. It is noteworthy that a subset of WT cells responded to both sweet and bitter tastants, such as sucrose and quinine (Figs. 1 and 2). Cosensitivity to sucrose and quinine has been observed previously for NTS neurons recorded from C57BL/6 mice (McCaughey 2007). Traditional across-neuron patterns of response to prototypical sweet, salty, sour, and bitter stimuli are shown for both WT and KO neurons in Fig. 3; Pearson correlations among these patterns are given in Table 2. The average breath of tuning index (H) (Smith and Travers 1979), calculated using responses to (in M) 1 glycine, 0.5 sucrose, 0.1 NaCl, 0.01 HCl, and 0.01 quinine, was the same for WT (0.73 ± 0.021) and KO (0.73 ± 0.02) neurons.
FIG. 2.
Taste responses in each WT neuron to the concentration series for block 1 stimuli. Responses to stimuli tested more than once (at the same concentration) were averaged. Table 1 gives stimulus abbreviations. In this plot, response profiles are ordered according to a neuron's grouping resulting from cluster analysis (Fig. 7), where group is denoted by a character above each profile (G, glycine oriented; S, sucrose oriented; B, broadly oriented; N, NaCl oriented). Cells are ranked within each group by their breadth of tuning value (H) (Smith and Travers 1979), which is given following the group identifier above each profile. H was computed using responses to (in M) 1 glycine, 0.5 sucrose, 0.1 NaCl, 0.01 HCl, and 0.01 quinine.
FIG. 3.

Across-neuron patterns of response to prototypical stimuli in WT and KO neurons. Neurons are arranged into groups by their traditional “best” stimulus (alternating black and gray bars) and further arranged in rank order by the magnitude of their response to that stimulus. For WT neurons, groups were (from left to right) glycine-best, sucrose-best, NaCl-best, and HCl-best. One WT neuron grouped into the glycine-best pool responded equivalently to glycine and sucrose; another WT neuron grouped with HCl-best cells responded equally to HCl and quinine. For KO neurons, groups were (left to right) NaCl-best, HCl-best, and quinine-best. One of the HCl-best KO cells responded equally to glycine, NaCl, and HCl; another KO neuron grouped with quinine-best neurons responded equivalently to quinine and NaCl.
TABLE 2.
Pearson coefficients of correlation (r) among across-neuron patterns of response shown in Figure 3
| G 1 | S 0.5 | N 0.1 | H 0.01 | |
|---|---|---|---|---|
| WT | ||||
| Q 0.01 | +0.11 | −0.38* | +0.66* | +0.91* |
| H 0.01 | −0.06 | −0.49* | +0.81* | |
| N 0.1 | −0.35* | −0.51* | ||
| S 0.5 | +0.76* | |||
| KO | ||||
| Q 0.01 | +0.72* | +0.16 | +0.36* | +0.63* |
| H 0.01 | +0.68* | +0.08 | +0.49* | |
| N 0.1 | +0.3 | +0.04 | ||
| S 0.5 | +0.17 |
Stimulus concentration (in M) follows stimulus abbreviation (see Table 1).
P < 0.05. WT, wild-type; KO, knockout.
Influence of T1r3 on taste responses in NTS neurons
How T1r3 contributes to the taste response properties of NTS neurons was assessed by comparing the activities of WT and KO cells. We first analyzed all sampled responses to the 20 standard stimuli (Table 1). Because all available data were considered, some comparisons involved an unequal number of neurons, as not all cells could be held for the completion of all stimulus trials. Thus independent groups t-tests were used to compare responses to each standard stimulus between genotypes. The observed t was evaluated using a Bonferroni-corrected α to control for possible type I error across multiple tests. Bonferroni's adjustment reduced α to 0.0025 for a desired family-wise error rate of 0.05 across 20 comparisons. The mean numbers of WT and KO neurons analyzed across all stimuli were 32.4 ± 1.6 and 32.9 ± 1.5, respectively. The t analyses showed that responses to (in M) 0.5 and 1 sucrose, 1 fructose, 1 glucose, 0.5 glycine, 1 proline, 1 sorbitol, and 0.1 acesulfame-K were significantly lower in KO neurons (P < 0.002; Fig. 4A). It is noteworthy that mean KO responses to 1 glycine and 0.01 Na-saccharin were only 55 and 65%, respectively, of the WT response. However, WT and KO responses to 1 glycine (P = 0.01) and 0.01 Na-saccharin (P = 0.03) did not significantly differ under the Bonferroni-corrected α. It is clear from inspection of Fig. 4A that KO NTS neurons responded differentially to certain sweet stimuli such as sugars and glycine, with the former evoking near zero activity and the latter producing a residual response. Such asymmetry is also evident in the different proportions of significant taste responses to these stimuli in KO cells (Fig. 4B). NTS responses to 0.5 l-glutamic acid [monosodium glutamate (MSG)], 0.1 NaCl, 0.1 Na-acetate, 0.1 NaNO3, 0.1 KCl, 0.01 HCl, 0.01 citric acid, 0.01 denatonium benzoate, 0.03 papaverine, and 0.01 quinine did not differ between T1r3 genotypes (P > 0.15).
FIG. 4.

Contribution of T1r3 to nucleus tractus solitarius (NTS) neuronal sensitivity to taste stimuli. A: mean + SE responses to the standard concentrations of taste stimuli in WT and KO neurons. Concentration (M) follows abbreviation (Table 1). B: proportions of significant responses to standard concentrations of sweet stimuli, NaCl, HCl, and quinine in WT and KO neurons. Across all stimuli, bars reflect data from on average 36 ± 1.6 WT and 37 ± 1.3 KO cells.
Using all available data, we went on to calculate the percentage change in the magnitude of responses evoked by sweet stimuli from KO to WT cells, as given by [(wti –koi)/wti] × 100. Here, wti was the average response among WT neurons to the ith stimulus and koi was the mean response to this stimulus among KO cells. This expression may provide some means to roughly estimate the proportion of an NTS taste response that is contributed by T1r3 receptors, albeit this metric is not a direct measure and could be influenced to some degree by normal variability in responding. For each neuron, responses to stimuli repeatedly tested at the same concentration were averaged before computing this ratio. By this calculation, T1r3 contributed in large part to responses to sugars across neurons, with, for example, 93% of the response to (in M) 0.5 or 1 sucrose estimated to be composed of input from T1r3 receptors (Fig. 5). This result is generally expected based on the results of peripheral taste nerve recordings in T1r3 knockout mice, showing low nerve sensitivity to sugars (Damak et al. 2003; Zhao et al. 2003). On the other hand, a reduced contribution of T1r3 was estimated for the NTS response to other types of sweet stimuli. Only 45% of the overall response to 1 M glycine was predicted to depend on T1r3. Similarly, activity to the artificial sweetener 0.1 M acesulfame-K was 48% reliant on T1r3. Activity to 0.01 M Na-saccharin was estimated to be only 35% T1r3 dependent, with 65% of the NTS response to this stimulus arising from a T1r3-independent mechanism. That Na-saccharin potently drives NTS taste neurons in our T1r3 knockout mice differs from the findings of taste nerve recordings made in another mouse line also with genetic deletion of T1r3, where integrated responses to an even higher concentration (0.04 M) of Na-saccharin were shown to be completely absent (Zhao et al. 2003).
FIG. 5.

Percentage change in responding to taste stimuli from KO to WT cells. The bar for “Na+ salts” was calculated using all response data for (in M) 0.1 NaCl, 0.1 Na-acetate, and 0.1 NaNO3; “acids” includes data for 0.01 HCl and 0.01 citric acid; “bitters” includes data for 0.01 quinine, 0.03 papaverine, and 0.01 denatonium.
Although NTS responses to sweet tastants such as sugars depended heavily on T1r3, other types of sweet stimuli produced salient residual activity in NTS neurons recorded from T1r3 KO mice. Although residual responses to sweet stimuli in KO neurons raises the possibility of sweet taste input to NTS mediated independently of T1r3, it would be critical to attach meaning to this residual activity to understand its significance. Tastants such as artificial sweeteners are known to engage cationic and T2r bitter taste receptors (Kuhn et al. 2004; Verhagen et al. 2005), which could be contributing to their observed KO response. If activity to “sweet” stimuli arising independently of T1r3 reflects nonsweet attributes of these tastants, we might expect a relationship to exist between KO responses to sweet and nonsweet stimuli. To explore this, we performed MDS analyses on WT and KO neural responses to the standard stimuli to characterize for each genotype similarities and dissimilarities among across-neuron responses to sweet and nonsweet tastants, with a particular emphasis on understanding how activity patterns to artificial sweeteners and glycine changed in the absence of T1r3. Only neurons with complete data records, where all 20 standard stimuli could be tested, were analyzed and a separate MDS analysis was performed for each genotype. For these analyses, a vector that held the responses of n (24 WT, 19 KO) neurons defined the activity evoked by a tastant. A vector of zeros, representative of no (presumably tasteless) activity, was also included in each analysis. The dimensionality of response vectors for all stimuli was reduced using MDS, which generated a low-dimensional plot that captured relationships among across-neuron responses to tastants. In this plot, similarity between neural responses to stimuli is reflected by their proximity: patterns that are similar to one another are close together in space whereas those dissimilar are situated apart.
MDS showed that the organization of across-neuron responses to taste stimuli in WT neurons was similar to that reported in other studies of rodent NTS (Lemon and Smith 2005; Lemon et al. 2004; McCaughey 2007), with responses to sweet, Na+ salt and aversive (bitter and sour) stimuli occupying unique locations in scaling space (Fig. 6). Indeed, the absence of T1r3 caused a shift in the response patterns evoked by sweet stimuli, as shown in the KO MDS plot in Fig. 6. Although distinct in WT cells, across-neuron responses to sugars and no (tasteless) activity (denoted by X in Fig. 6) were highly similar in KO neurons, as based on their close proximity. This furthers the notion that the appetitive taste of sugars is exclusively mediated by T1r3-containing taste receptors (Zhao et al. 2003).
FIG. 6.

Two-dimensional multidimensional scaling (MDS) solutions showing relationships among across-neuron responses to taste stimuli in 24 WT (top) and 19 KO (bottom) neurons. See Table 1 for abbreviations; “X” represents an across-neuron pattern representative of no activity (i.e., a vector of zeros). Concentration (0.5 or 1 M) is indicated for glycine and sucrose. Dotted lines used to offset some abbreviations indicate the actual position of a stimulus response in 2-dimensional space; these offsets were done simply to reduce clutter in the particular spaces.
Across-neuron responses to artificial sweeteners also changed without T1r3 but in a manner different from that observed for sugars. As based on the positioning of responses by MDS, acesulfame-K evoked across WT neurons activity similar to that of other sweet stimuli (sucrose, glycine, fructose, glucose, proline, and sorbitol; Fig. 6). However, across KO cells, the response to acesulfame-K was clearly and highly similar to those generated by aversive bitter tastants, such as quinine and denatonium (Fig. 6). This could suggest that the NTS response to acesulfame-K measured in the absence of T1r3 does not reflect the appetitive feature of this stimulus but a potentially aversive side taste. Accordingly, acesulfame-K becomes aversive to mice at certain concentrations (Damak et al. 2003), suggesting that it may indeed have an aversive taste component.
For Na-saccharin, positioning by MDS showed responses to this stimulus, Na+ salts, and aversive bitter tastants were more similar in KO neurons than in WT cells (Fig. 6). To further characterize the relationship between NTS responses to Na-saccharin and these stimuli, we computed correlations among their across-unit responses to tastants (all correlations can be found in Supplemental Table S1) for cells included in MDS analyses. In WT neurons, the response to Na-saccharin correlated (P < 0.05) with those evoked by sodium salts, with the best correlation observed against the response to NaNO3 (r = +0.44). However, it is noteworthy that the r2 for this correlation (0.19) estimates that a linear relationship between responses to Na-saccharin and NaNO3 accounts for only 19% of the WT response variance between these stimuli, leaving 81% of this variance unexplained. In contrast, KO responses to Na-saccharin and sodium salts strongly correlated (r > +0.9), with the highest correlation noted between responses to Na-saccharin and NaNO3 (r = +0.95, P < 0.05, r2 = 0.90). A robust, positive relationship between KO activity to Na-saccharin and sodium stimuli might suggest that the sodium component of this stimulus (Verhagen et al. 2005) predominates its response in KO neurons. Moreover, the response to Na-saccharin in KO neurons was, unlike that in WT cells, correlated to varying degrees with activity to aversive taste stimuli (Supplemental Table S1), with the highest correlation noted against denatonium (r = +0.74; r2 = 0.55).
Like artificial sweeteners, the sweet amino acid glycine evoked substantial residual activity in KO neurons relative to other sweet stimuli (Fig. 4). Compared with that for WT cells, the KO response to glycine was positioned by MDS closer to activity to aversive stimuli (Fig. 6). Across the subset of 19 KO cells used in MDS analysis, the response to 1 M glycine correlated (P < 0.05) with activity to HCl (r = +0.58, r2 = 0.34) and quinine (r = +0.65; r2 = 0.42) among nonsweet stimuli. If we considered all 41 KO cells, correlations among across-unit responses to glycine and HCl or quinine (Fig. 3) were slightly larger (Table 2), albeit within 95% confidence (based on Fisher's z transformation of r) of respective correlations computed for these responses in the subset of neurons that could be used in MDS. These relationships would indicate that the KO NTS response to glycine shows some degree of positive correlation with those evoked by aversive, nonsweet taste stimuli.
Influence of T1r3 on the distribution of NTS neurons
To describe average trends in responding among WT and KO neurons and to look for differences in these trends, cells within each strain were grouped by hierarchical cluster analysis of responses to (in M) 0.5 sucrose, 1 glycine, 0.1 NaCl, 0.01 HCl, and 0.01 quinine (Fig. 7A). For WT neurons, inspection of a scree plot of cluster distance against amalgamation steps heuristically suggested four general groupings of cells (Fig. 7B): those that responded most effectively to glycine (WT group G) and to sucrose (WT group S), cells broadly sensitive to glycine, NaCl, HCl, and quinine (WT group B), and cells oriented toward NaCl (WT group N). For KO neurons, a scree plot suggested six groups of cells, although two of these groups each consisted of a sole neuron. One of these cells responded relatively weakly (1 spike/s maximum; cell C1 in Fig. 7A, profile not shown in Fig. 7B). The other neuron responded broadly to NaCl, HCl, and quinine, favoring and showing nearly equivalent sensitivity to HCl and quinine (cell C2; Fig. 7). The other KO groups included cells most responsive to quinine (KO group Q), those broadly sensitive to glycine, NaCl, HCl, and quinine (KO groups H and B), and cells oriented toward NaCl (KO group N).
FIG. 7.

Identifying neuron types among WT and KO cells. A: dendrogram trees showing the outcome of hierarchical cluster analyses applied to delineate trends in tuning orientations among WT and KO neurons. Scree plots used to “cut” tuning clusters from each tree are shown as insets. B: mean ± SE responses to (in M) 1 glycine, 0.5 sucrose, 0.1 NaCl, 0.01 HCl, and 0.01 quinine in WT and KO neural groups identified by cluster analyses in A. The profile C2 shown with the KO groupings represents the activity of a single cell placed into its own group but with a response profile most similar to that of group H.
Hierarchical cluster analysis lumped 34% of WT neurons into groups G and S, cells oriented toward the sweet stimuli glycine and sucrose. However, no such clusters were defined for KO neurons. Thus the development of NTS gustatory neurons that are tuned toward sweet tastants likely depends on input mediated by T1r3 taste receptors. Nearly 10% of KO cells fell into group Q, cells oriented toward quinine, although an analogous cluster was not observed among WT cells. This was not attributable to KO cells being more sensitive to quinine, because genotype did not influence quinine response magnitude (Fig. 4; mean responses to 0.01 M quinine across all neurons: WT = 17.9 ± 3 spikes/s; KO = 17.7 ± 2 spikes/s). Although the absence of a bitter-oriented cluster among WT neurons cannot be entirely freed from sampling error, quinine was included as a search stimulus for taste neurons at similar frequencies in both strains: for ≥24% of WT and 27% of KO neurons. Moreover, McCaughey (2007) also did not observe a bitter-oriented grouping in his recordings of NTS neurons from C57BL/6 mice with the WT T1r3 allele.
Neural clusters broadly tuned across different stimuli (group B) or oriented toward NaCl (group N) were common to both WT and KO neurons (Fig. 7). On average, broadly sensitive group B neurons carried the most salient signal for glycine among KO cell types (Fig. 7B). The response produced by 1 M glycine in KO group B cells did not differ from that elicited by this stimulus in WT group B cells (t8 = −1.09, P = 0.3). What is more, mean taste responses to 0.5 M glycine in WT (19.5 ± 7.4) and KO (18.9 ± 3.2) group B neurons also did not differ (t8 = 0.07, P = 0.9). Because sensitivity to glycine in neural type B was unaffected by genotype, this might suggest that the response to glycine in broadly tuned NTS neurons is contributed mainly by T1r3-independent receptors.
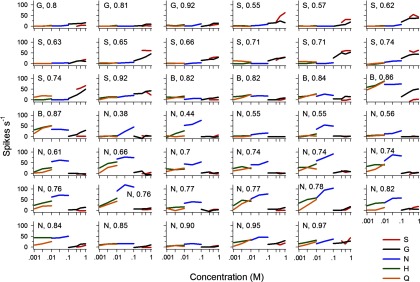
To provide a detailed description of the tuning properties of individual NTS neurons encountered in WT and KO mice, we plotted the complete response profiles for the subset of cells that could be tested with all 20 standard stimuli (Fig. 8). Among KO neurons, there is a striking paucity of activity to sweet stimuli such as sugars. It is also noteworthy that the majority of WT and KO neurons show activity to multiple categories of tastants.
FIG. 8.

Response profiles to the 20 standard stimuli for WT (n = 24) and KO (n = 19) neurons that could be tested with each stimulus. “S1” indicates that the response to 0.5 M sucrose measured from the neuron associated with the profile was significant. Stimuli are numbered along the abscissa (see legend).
DISCUSSION
Here we compared the stimulus-response properties of NTS taste neurons between T1r3 KO and WT mice. We found that taste responses across sweet stimuli were variably lower in KO neurons. KO responses to sugars were markedly lower than those in WT, being just above zero on average (Fig. 4). However, 1 M glycine and artificial sweeteners evoked salient residual responses in KO neurons. The differential sensitivity to sweet stimuli in KO neurons suggests that T1r3 receptors contribute asymmetrically to NTS responses to sweet tastants. T1r3 also influenced the distribution of classically defined neuron types in NTS. Cluster analyses showed that, although broadly tuned and sodium-oriented neurons appeared in both strains at similar frequencies, sweet-oriented neurons, abundant in WT NTS, were not present among KO cells. On the other hand, a quinine-oriented neural group, albeit composed of a small number of cells, emerged exclusively in KO NTS. However, the most striking effect of deletion of T1r3 on the distribution of NTS neurons was a loss of sweet-oriented cells. The normal development of NTS neurons tuned toward sweet tastants must critically depend on input from T1r3-containing taste receptors.
Residual KO responses to 0.01 M Na-saccharin and 1 M glycine did not significantly differ from WT under Bonferroni-corrected statistical comparisons. However, the Bonferroni correction as applied here to control for possible type I (i.e., false positive) error across many comparisons resulted in a rather conservative α and a concomitant increase in the likelihood of committing a type II error (i.e., missing a real difference between two means). This should be considered when interpreting these data. The mean KO response to 1 M glycine, for example, was only ∼50% of control and with a low SE (Fig. 4A). The KO response to 0.5 M glycine was significantly lower than control.
Nonetheless, glycine and artificial sweeteners did produce salient residual activity in KO neurons, and the existence of non-T1r3 taste receptors mediating sweet or appetitive taste would be presaged in part by such responses. However, this residual activity should be interpreted carefully, particularly that for artificial sweeteners. Acesulfame-K, for example, evokes a well-known bitter side taste in humans and seems to be at least partly aversive to mice (Damak et al. 2003). Accordingly, this stimulus interacts with, in addition to T1r3 (Damak et al. 2003), T2r bitter taste receptors (Kuhn et al. 2004), a discovery made using human variants of T2r genes. Although it is unknown if acesulfame-K also binds with rodent T2r's, the K+ component of acesulfame-K may also be contributing to its taste response. Stimuli involving K+ presumably elicit an aversive taste to mice, as based on proximity of KCl to bitter and sour stimuli in the scaling spaces in Fig. 6. It is noteworthy that some K+ stimuli evoke an aversive side taste in humans (van der Klaauw and Smith 1995). Thus there would seem to be potential for an NTS response to acesulfame-K to be composed of input from both sweet and nonsweet, potentially aversive taste reception mechanisms. Here we found that deletion of T1r3 caused the normal sweet-like across-neuron response to this stimulus, as observed in WT cells, to become similar to activity evoked by aversive taste stimuli, such as bitters and acids. This was suggested by placement of across-neuron responses to acesulfame-K and other stimuli in MDS space (Fig. 6) and also by Pearson correlations among response patterns (Supplemental Table S1). Although from these data alone one could only cautiously infer the receptors mediating residual activity, the KO NTS response to acesulfame-K would seem to be related to a potential interaction of this stimulus with nonsweet taste receptors.
A similar trend was noted for KO activity to Na-saccharin. Na-saccharin interacts with T1r3 receptors (Damak et al. 2003; Zhao et al. 2003), Na+ reception mechanisms (Verhagen et al. 2005), and, like acesulfame-K, T2r bitter taste receptors (Kuhn et al. 2004). Elements of these latter interactions are potentially evident in the KO NTS response to Na-saccharin, which, unlike the WT response, showed a very strong correlation with activity to Na+ salts and was also correlated to some degree with activity to aversive stimuli (Supplemental Table S1). This observation might suggest that the KO NTS response to Na-saccharin largely reflects the reported interactions of this stimulus with nonsweet taste receptors. These CNS data on artificial sweeteners further the notion that the neural message for the “sweetness” or appetitive nature of these stimuli is mostly or wholly mediated by T1r3-containing receptors (Damak et al. 2003; Zhao et al. 2003).
Glycine is a sweet-tasting amino acid that likely interacts with T1r3-containing taste receptors, because an absence of T1r3 attenuated a portion of neural sensitivity to this stimulus (Fig. 4A). However, KO neurons showed on average a salient residual response to glycine. Unlike WT activity, KO activity to glycine positively correlated to some degree with responses to the aversive stimuli HCl and quinine. However, assuming these correlations do reflect some unpalatable feature of glycine unmasked by the absence of T1r3, the perceptual weights assigned by the brain to the unpleasant and appetitive features of glycine's taste could be unlike such weightings for artificial sweeteners. Artificial sweeteners are avoided by mice at high concentrations (Damak et al. 2003; Inoue et al. 2007), suggesting that these stimuli indeed carry an aversive sensory component. In contrast, high concentrations of glycine elicit in mice only increases in licking (Dotson and Spector 2004; Inoue et al. 2007), suggesting that glycine is registered as exclusively appetitive and does not possess a readily detectable aversive feature.
Glycine seems to normally elicit a sucrose-like taste in rodents, because conditioned aversions cross-generalize between these stimuli (Danilova et al. 1998; Nowlis et al. 1980). However, the taste receptor mechanisms for glycine and sucrose are reported to possibly differ. Mice show different detection thresholds for sugars and glycine, which could reflect different receptors (Eylam and Spector 2004). Furthermore, allelic variation at Tas1r3 influences murine taste nerve and behavioral sensitivity to several sweet-tasting stimuli including sucrose, but not glycine (Inoue et al. 2004, 2007). It has been postulated that glycine could interact with a region of T1r3 not influenced by known Tas1r3 polymorphisms or T1r3-independent taste receptors (Inoue et al. 2004, 2007). Our findings might support a combination of these ideas. That the absence of T1r3 attenuates a certain portion of neural sensitivity to glycine (Fig. 4A) indicates interaction with T1r3, and the relatively salient residual sensitivity to glycine in KO neurons suggests that T1r3-independent taste receptors also contribute to the transduction of this stimulus. However, the receptors mediating T1r3-independent neural sensitivity to glycine and the significance of this activity cannot be fully delineated by these data alone.
Among KO neurons, group B cells showed the strongest responses to glycine (Fig. 7). These neurons also responded well to salts, acids, and bitter stimuli. Responses to glycine in group B cells did not differ between T1r3 KO and WT mice, suggesting that glycine activity in this cell type arises independently of T1r3—from a non-T1r3 receptor. However, that these cells are broadly tuned does not necessarily mean that glycine's T1r3-independent feature is common to other, nonsweet stimuli: the relation would depend on the mechanism(s) of taste information processing. Temporal coding mechanisms may be used by certain types of broadly sensitive NTS gustatory neurons to disambiguate different taste stimuli (Di Lorenzo and Victor 2003). Because we measured only spike density, it could be interesting to evaluate how spike timing might facilitate discrimination between glycine and quinine, for example, by group B cells. This might provide further insight into the significance of glycine's non-T1r3 response component.
Although a small proportion of KO cells showed some degree of significant activity to sugars (Fig. 4B), taste responses to these stimuli were markedly diminished in KO neurons to, on average, near zero (Fig. 4A). Accordingly, KO across-neuron responses to sugars were positioned close to the pattern for no, presumably tasteless, activity in MDS space (Fig. 6). However, it is noteworthy that sucrose detection thresholds are comparable between T1r3 KO and WT mice (Delay et al. 2006). In light of this, the nominal T1r3-independent gustatory activity to sucrose we observed might be sufficient to allow KO mice to recognize some orosensory feature of this stimulus under certain behavioral paradigms. This is, of course, assuming that sucrose detection performance is not being contributed by potential nontaste cues, such as olfaction (Rhinehart-Doty et al. 1994). The diminished KO neural activity would certainly seem insufficient to drive the orosensory-mediated preference response to sugars. T1r3 KO mice show strong deficits in responding to sucrose in brief-access intake tests (Zhao et al. 2003), which are specifically designed to probe the contribution of orosensory factors to behavior and minimize postingestive influences. Thus the minimal T1r3-independent NTS activity to sucrose likely plays little or no role in appetitive orosensory responding to this stimulus, a behavior likely initiated entirely by T1r receptors (Zhao et al. 2003).
These findings indicate that T1r3-containing receptors are the primary contributors to appetitive taste responses to sugars and artificial sweeteners in NTS neurons. Further studies are needed to more effectively probe the meaning of T1r3-independent NTS activity to glycine. Perhaps measuring behavioral taste preference toward glycine in KO mice may provide further clues as to the perceptual meaning and hedonic valence of NTS responses to glycine observed in the absence of T1r3.
It is not the intent here to propose that the patterns of neural activity analyzed in the MDS and correlation analyses reflect exclusively the neural “codes” underlying the perceptions of taste stimuli in mice. Rather, these responses are viewed as estimates of global, spatial activity in NTS evoked by different types of stimulus input. This global activity likely contains elements of perceptual discriminative neural coding but could also reflect hedonic assignment, intra-nuclear processing, and, albeit mice were anesthetized, potentially also efferent copy for oromotor control. Data such as these require care in interpretation because of the unknown function(s) served by each neuron. What is more, these spike rate data do not consider spike timing, which has been suggested to contribute to NTS taste processing (Di Lorenzo and Victor 2003; Roussin et al. 2008). This study does, however, provide a first account of how T1r3 receptors influence the relative efficacy by which different classes of taste stimuli activate NTS neurons in mice.
Although the focus of this study was on sweet taste processing, neurons were also tested with MSG, a glutamate or “umami” stimulus. The T1r3 receptor subunit also contributes to the transduction of certain umami stimuli (Damak et al. 2003; Zhao et al. 2003), although for this process, T1r3 interacts with an additional T1r subunit not involved in sweet taste transduction (Zhao et al. 2003). However, our data showed no difference in responding to MSG between NTS neurons recorded from WT and T1r3 KO mice (Fig. 4). Our result is actually expected from the findings of Damak et al. (2003), where in the first report on the line of KO mice used presently, it was shown that responses to a range of concentrations of MSG recorded from gustatory nerves did not differ between T1r3 KO mice and their WT counterparts. At first, it could be tempting to interpret these data as evidence for a T1r3-independent taste receptor for umami stimuli. However, neural activity to MSG is undoubtedly contributed by the Na+ component of this stimulus, which complicates interpretation. We tested a few KO neurons with MSG dissolved in a solution of amiloride, an inhibitor of epithelial sodium channels that partly blocks sodium taste transduction (DeSimone et al. 1984), and observed a dramatic reduction in neural sensitivity to MSG within these cells (Supplemental Fig. S3). Clearly, Na+ heavily mediates the control-like response to MSG in KO neurons. It is noteworthy that amiloride does not entirely inhibit (i.e., reducing to zero response) sodium taste transmission in all types of sodium-sensitive NTS cells (Smith et al. 1996; St. John and Smith 2000). Thus amiloride may not be capable of completely dampening the Na+ component of MSG's NTS response.
Input from T1r3-containing taste receptors is critical for the normal development of NTS neurons oriented toward sweet stimuli, because cluster analyses of WT and KO cells showed that groups of these neurons do not emerge in the absence of T1r3 (Fig. 7). It is also possible that there exist other sorts of NTS neurons sensitive to manipulation of T1r3 but undetectable by cluster-averaging techniques. The mean response profiles of neural groups suggested by cluster analysis, like those in Fig. 7B, provide gross descriptions of cell types present in a data set. Such averages can sometimes mask the true tuning properties of individual neurons showing an effect of interest but lost in the average. Therefore it is sometimes useful to also consider neurons individually, as shown in Fig. 8 for WT and KO cells tested with all standard stimuli. It can be seen that individual WT neurons showing responses to sweet stimuli unmatched by KO cells actually compose a heterogeneous group. Take neurons in Fig. 8 showing significant responses to the prototypical sweet tastant 0.5 M sucrose; the response profiles for these cells are indicated by S1. Whereas only one of the KO neurons gives a significant response (3 spikes/s) to this stimulus, 15 WT neurons in Fig. 8 significantly responded to 0.5 M sucrose. Figure 8 shows that WT neurons with relatively robust sensitivity to sucrose vary in their tuning profiles, with some cells oriented toward sweet stimuli and others broadly responsive across sweet, salty, sour, and bitter tastants. WT cells showing responses to sweet stimuli not found among KO neurons could logically be those NTS neurons receiving input from T1r3-containing sweet taste receptors. However, one could only cautiously infer this using these experimental methods, which do not provide a direct test of such connectivity. An ideal experiment for identifying central neurons in receipt of input from T1r3 receptors would involve a manipulation that would allow for T1r3 to be selectively and instantly deactivated/activated on-line in a single animal. In this way, taste responses recorded with and without T1r3 could be taken from the same neuron, affording within-cell control for directly determining whether or not T1r3 receptors contribute to that cell's taste response characteristics. However, such specific manipulation of T1r3 is not, at this writing, possible.
We found a quinine-oriented neural group that arose only among KO cells (Fig. 7). When seeking out KO and WT neurons, we took measures to control for sampling biases that could arise because of search stimulus selection, yet a quinine-oriented neural group was not apparent among WT cells. However, the n of quinine-oriented KO neurons we observed is relatively low, which cautions how far one should interpret this observation. Nevertheless, these data do draw interest to the potential consequences deletion of T1r3 might have on the development of circuitry involved in the processing of nonsweet taste stimuli. In effect, central taste networks in T1r3 KO mice are selectively deprived of a prominent sweet taste input all throughout development. Because the normal ontogeny of circuitry in gustatory NTS depends in part on experience (May and Hill 2006; Sollars et al. 2006), there would seem potential for the absence of T1r3 to alter the developmental course of more than just neural circuits for sweet taste if certain developmental conditions were true: if, for example, the “wiring” between taste receptors and taste neurons is determined in part by the available distribution of receptors. This phenomenon has been observed in vision. In the retina, a knockout mouse model that results in a loss of rods, producing a cone-only retina, causes bipolar cells that would normally connect to rods to form synapses with cones, demonstrating that downstream neurons are not predetermined to talk with only certain receptors (Strettoi et al. 2004). It would be interesting to know if a loss of T1r3-mediated sweet input alters the pattern of gustatory afferent projections to NTS, as is seen with early dietary sodium restriction (May and Hill 2006), and the volume of cells in the rostral pole of this nucleus. Such data might provide a compelling window to the influence of T1r3 on the development of taste circuitry. Although these issues remain to be systematically studied, taste networks in T1r3 KO mice may not simply be the equivalent of those in WT animals sans T1r3-containing taste receptors.
NTS neurons can receive convergent input from multiple oral receptive fields (Travers and Norgren 1991; Travers et al. 1986) and different gustatory epithelia vary in sensitivity to taste stimuli, as shown by nerve recordings (Harada et al. 1997; Nejad 1986; Shingai and Beidler 1985). Thus one could intuit for an experiment like the present that error could contribute to taste response quantification and differences between groups of neurons if there was uncontrolled, variable stimulation of different gustatory epithelia across animals. We used a stimulation technique that bathed much of the mouth with solution, including the tongue and palate as shown by a dye test. The stimulus flow rate and the small size of the mouse oral cavity facilitated this pattern of oral stimulation and each mouse was stimulated in the same manner. If there was uncontrolled variation in stimulation field that influenced differences in responding to sweet stimuli between WT and KO neurons, we might have also found an unexpected difference in responding to nonsweet tastants, because different gustatory epithelia in rodents are differentially sensitive to certain types of these stimuli (Harada et al. 1997; Nejad 1986; Shingai and Beidler 1985). However, this did not happen and WT and KO responses to all nonsweet stimuli were, if anything, strikingly similar (Fig. 4), suggesting that the oral field stimulated here was consistent over preparations.
It is important to consider that although the dye test indicated that tastants stimulated nearly all of the mouth there is a chance that this stimulus presentation technique may not have optimally stimulated all taste buds in posterior tongue papillae trenches, which have been suggested to be difficult to access (Geran and Travers 2006). However, tastants easily bathed gustatory epithelia on the anterior tongue, palate, and nasoincisor ducts, fields all innervated by the VIIth nerve. Thus it is probable that the WT and KO NTS neurons recorded presently received prominent input from gustatory afferents of the VIIth nerve. Neurotomy experiments in rodents have suggested that the VIIth nerve, but not the IXth nerve innervating posterior oral fields, critically mediates taste quality discriminative function (Spector and Grill 1992; Spector et al. 1997; St. John and Spector 1998), whereas the IXth nerve is reported to serve oromotor reflexive responses (Travers et al. 1987). Neurons in receipt of input from nerve VII could be cells involved with taste perceptual computations made by the brain. However, these data are limited to describing only the influence of T1r3 on NTS neural sensitivity and do not provide information on potential correlates of neural function. Delineating the functional properties of sweet-responsive NTS neurons sensitive to manipulation of T1r3 will require future studies aimed at establishing the pattern of afferent feed to these cells, their precise location in NTS, their axonal projections, and also studies that correlate the activities of these neurons in awake mice with behavior.
DISCLOSURES
R. F. Margolskee has a personal financial interest in the form of stock ownership in the Redpoint Bio company, receives consulting fees from Redpoint Bio, and is an inventor on patents and patent applications which have been licensed to Redpoint Bio.
GRANTS
This work was supported in part by National Institute for Deafness and Other Communication Disorders Grants DC-008194 to C. H. Lemon and DC-003155 to R. F. Margolskee.
Supplementary Material
Acknowledgments
We thank Drs. John Boughter and Kenichi Tokita for assistance with histology, Dr. William Taylor for assistance with genotyping the mice, and Drs. Matthew Ennis and Justus Verhagen for valuable comments on an early draft of this manuscript. We also remember Dr. David Smith for his past support of this work.
Present address of C. H. Lemon: Department of Pharmacology and Physiology, St. Louis University School of Medicine, 1402 S. Grand Blvd., St. Louis, MO 63104-1004.
Footnotes
The online version of this article contains supplemental data.
REFERENCES
- Bachmanov 2001.Bachmanov AA, Li X, Reed DR, Ohmen JD, Li S, Chen Z, Tordoff MG, de Jong PJ, Wu C, West DB, Chatterjee A, Ross DA, Beauchamp GK. Positional cloning of the mouse saccharin preference (Sac) locus. Chem Senses 26: 925–933, 2001. [DOI] [PMC free article] [PubMed] [Google Scholar]
- Bachmanov 1996.Bachmanov AA, Tordoff MG, Beauchamp GK. Ethanol consumption and taste preferences in C57BL/6ByJ and 129/J mice. Alcohol Clin Exp Res 20: 201–206, 1996. [DOI] [PMC free article] [PubMed] [Google Scholar]
- Capeless 1995.Capeless CG, Whitney G. The genetic basis of preference for sweet substances among inbred strains of mice: preference ratio phenotypes and the alleles of the Sac and dpa loci. Chem Senses 20: 291–298, 1995. [DOI] [PubMed] [Google Scholar]
- Damak 2003.Damak S, Rong M, Yasumatsu K, Kokrashvili Z, Varadarajan V, Zou S, Jiang P, Ninomiya Y, Margolskee RF. Detection of sweet and umami taste in the absence of taste receptor T1r3. Science 301: 850–853, 2003. [DOI] [PubMed] [Google Scholar]
- Danilova 2003.Danilova V, Hellekant G. Comparison of the responses of the chorda tympani and glossopharyngeal nerves to taste stimuli in C57BL/6J mice. BMC Neurosci 4: 5, 2003. [DOI] [PMC free article] [PubMed] [Google Scholar]
- Danilova 1998.Danilova V, Hellekant G, Tinti JM, Nofre C. Gustatory responses of the hamster Mesocricetus auratus to various compounds considered sweet by humans. J Neurophysiol 80: 2102–2112, 1998. [DOI] [PubMed] [Google Scholar]
- Delay 2006.Delay ER, Hernandez NP, Bromley K, Margolskee RF. Sucrose and monosodium glutamate taste thresholds and discrimination ability of T1R3 knockout mice. Chem Senses 31: 351–357, 2006. [DOI] [PubMed] [Google Scholar]
- DeSimone 1984.DeSimone JA, Heck GL, Mierson S, DeSimone SK. The active ion transport properties of canine lingual epithelia in vitro: implications for gustatory transduction. J Gen Physiol 83: 633–656, 1984. [DOI] [PMC free article] [PubMed] [Google Scholar]
- Di Lorenzo 2000.Di Lorenzo PM, Lemon CH. The neural code for taste in the nucleus of the solitary tract of the rat: effects of adaptation. Brain Res 852: 383–397, 2000. [DOI] [PubMed] [Google Scholar]
- Di Lorenzo 2003.Di Lorenzo PM, Victor JD. Taste response variability and temporal coding in the nucleus of the solitary tract of the rat. J Neurophysiol 90: 1418–1431, 2003. [DOI] [PubMed] [Google Scholar]
- Dotson 2004.Dotson CD, Spector AC. The relative affective potency of glycine, L-serine and sucrose as assessed by a brief-access taste test in inbred strains of mice. Chem Senses 29: 489–498, 2004. [DOI] [PubMed] [Google Scholar]
- Eylam 2004.Eylam S, Spector AC. Stimulus processing of glycine is dissociable from that of sucrose and glucose based on behaviorally measured taste signal detection in Sac ‘taster’ and ‘non-taster’ mice. Chem Senses 29: 639–649, 2004. [DOI] [PubMed] [Google Scholar]
- Fuller 1974.Fuller JL Single-locus control of saccharin preference in mice. J Hered 65: 33–36, 1974. [DOI] [PubMed] [Google Scholar]
- Gannon 1995.Gannon KS, Contreras RJ. Sodium intake linked to amiloride-sensitive gustatory transduction in C57BL/6J and 129/J mice. Physiol Behav 57: 231–239, 1995. [DOI] [PubMed] [Google Scholar]
- Geran 2006.Geran LC, Travers SP. Single neurons in the nucleus of the solitary tract respond selectively to bitter taste stimuli. J Neurophysiol 96: 2513–2527, 2006. [DOI] [PubMed] [Google Scholar]
- Halpern 1985.Halpern BP Time as a factor in gustation: temporal patterns of taste stimulation and response. In: Taste, Olfaction and the Central Nervous System, edited by Pfaff DW. New York: The Rockefeller University Press, 1985, p. 181–209.
- Halpern 1971.Halpern BP, Tapper DN. Taste stimuli: quality coding time. Science 171: 1256–1258, 1971. [DOI] [PubMed] [Google Scholar]
- Harada 1997.Harada S, Yamamoto T, Yamaguchi K, Kasahara Y. Different characteristics of gustatory responses between the greater superficial petrosal and chorda tympani nerves in the rat. Chem Senses 22: 133–140, 1997. [DOI] [PubMed] [Google Scholar]
- Inoue 2007.Inoue M, Glendinning JI, Theodorides ML, Harkness S, Li X, Bosak N, Beauchamp GK, Bachmanov AA. Allelic variation of the Tas1r3 taste receptor gene selectively affects taste responses to sweeteners: evidence from 129.B6-Tas1r3 congenic mice. Physiol Genomics 32: 82–94, 2007. [DOI] [PMC free article] [PubMed] [Google Scholar]
- Inoue 2004.Inoue M, Reed DR, Li X, Tordoff MG, Beauchamp GK, Bachmanov AA. Allelic variation of the Tas1r3 taste receptor gene selectively affects behavioral and neural taste responses to sweeteners in the F2 hybrids between C57BL/6ByJ and 129P3/J mice. J Neurosci 24: 2296–2303, 2004. [DOI] [PMC free article] [PubMed] [Google Scholar]
- Kitagawa 2001.Kitagawa M, Kusakabe Y, Miura H, Ninomiya Y, Hino A. Molecular genetic identification of a candidate receptor gene for sweet taste. Biochem Biophys Res Commun 283: 236–242, 2001. [DOI] [PubMed] [Google Scholar]
- Kuhn 2004.Kuhn C, Bufe B, Winnig M, Hofmann T, Frank O, Behrens M, Lewtschenko T, Slack JP, Ward CD, Meyerhof W. Bitter taste receptors for saccharin and acesulfame K. J Neurosci 24: 10260–10265, 2004. [DOI] [PMC free article] [PubMed] [Google Scholar]
- Lemon 2004.Lemon CH, Brasser SM, Smith DV. Alcohol activates a sucrose-responsive gustatory neural pathway. J Neurophysiol 92: 536–544, 2004. [DOI] [PubMed] [Google Scholar]
- Lemon 2005.Lemon CH, Smith DV. Neural representation of bitter taste in the nucleus of the solitary tract. J Neurophysiol 94: 3719–3729, 2005. [DOI] [PubMed] [Google Scholar]
- Li 2002.Li X, Staszewski L, Xu H, Durick K, Zoller M, Adler E. Human receptors for sweet and umami taste. Proc Natl Acad Sci USA 99: 4692–4696, 2002. [DOI] [PMC free article] [PubMed] [Google Scholar]
- Lush 1989.Lush IE The genetics of tasting in mice. VI. Saccharin, acesulfame, dulcin and sucrose. Genet Res 53: 95–99, 1989. [DOI] [PubMed] [Google Scholar]
- Max 2001.Max M, Shanker YG, Huang L, Rong M, Liu Z, Campagne F, Weinstein H, Damak S, Margolskee RF. Tas1r3, encoding a new candidate taste receptor, is allelic to the sweet responsiveness locus Sac. Nat Genet 28: 58–63, 2001. [DOI] [PubMed] [Google Scholar]
- May 2006.May OL, Hill DL. Gustatory terminal field organization and developmental plasticity in the nucleus of the solitary tract revealed through triple-fluorescence labeling. J Comp Neurol 497: 658–669, 2006. [DOI] [PMC free article] [PubMed] [Google Scholar]
- McCaughey 2007.McCaughey SA Taste-evoked responses to sweeteners in the nucleus of the solitary tract differ between C57BL/6ByJ and 129P3/J mice. J Neurosci 27: 35–45, 2007. [DOI] [PMC free article] [PubMed] [Google Scholar]
- Montmayeur 2001.Montmayeur JP, Liberles SD, Matsunami H, Buck LB. A candidate taste receptor gene near a sweet taste locus. Nat Neurosci 4: 492–498, 2001. [DOI] [PubMed] [Google Scholar]
- Nejad 1986.Nejad MS The neural activities of the greater superficial petrosal nerve of the rat in response to chemical stimulation of the palate. Chem Senses 11: 283–293, 1986. [Google Scholar]
- Nelson 2001.Nelson G, Hoon MA, Chandrashekar J, Zhang Y, Ryba NJP, Zuker CS. Mammalian sweet taste receptors. Cell 106: 381–390, 2001. [DOI] [PubMed] [Google Scholar]
- Nowlis 1980.Nowlis GH, Frank ME, Pfaffmann C. Specificity of acquired aversion to taste qualities in hamsters and rats. J Comp Physiol Psychol 94: 932–942, 1980. [DOI] [PubMed] [Google Scholar]
- Rhinehart-Doty 1994.Rhinehart-Doty JA, Schumm J, Smith JC, Smith GP. A non-taste cue of sucrose in short-term taste tests in rats. Chem Senses 19: 425–431, 1994. [DOI] [PubMed] [Google Scholar]
- Roussin 2008.Roussin AT, Victor JD, Chen JY, Di Lorenzo PM. Variability in responses and temporal coding of tastants of similar quality in the nucleus of the solitary tract of the rat. J Neurophysiol 99: 644–655, 2008. [DOI] [PMC free article] [PubMed] [Google Scholar]
- Sainz 2001.Sainz E, Korley JN, Battey JF, Sullivan SL. Identification of a novel member of the T1R family of putative taste receptors. J Neurochem 77: 896–903, 2001. [DOI] [PubMed] [Google Scholar]
- Scott 1974.Scott TR Behavioral support for a neural taste theory. Physiol Behav 12: 413–417, 1974. [DOI] [PubMed] [Google Scholar]
- Shingai 1985.Shingai T, Beidler LM. Response characteristics of three taste nerves in mice. Brain Res 335: 245–249, 1985. [DOI] [PubMed] [Google Scholar]
- Smith 1996.Smith DV, Liu H, Vogt MB. Responses of gustatory cells in the nucleus of the solitary tract of the hamster after NaCl or amiloride adaptation. J Neurophysiol 76: 47–58, 1996. [DOI] [PubMed] [Google Scholar]
- Smith 1979.Smith DV, Travers JB. A metric for the breadth of tuning of gustatory neurons. Chem Senses Flav 4: 215–229, 1979. [Google Scholar]
- Sollars 2006.Sollars SI, Walker BR, Thaw AK, Hill DL. Age-related decrease of the chorda tympani nerve terminal field in the nucleus of the solitary tract is prevented by dietary sodium restriction during development. Neuroscience 137: 1229–1236, 2006. [DOI] [PMC free article] [PubMed] [Google Scholar]
- Spector 1992.Spector AC, Grill HJ. Salt taste discrimination after bilateral section of the chorda tympani or glossopharyngeal nerves. Am J Physiol 263: R169–R176, 1992. [DOI] [PubMed] [Google Scholar]
- Spector 1997.Spector AC, Markison S, St. John SJ, Garcea M. Sucrose vs. maltose taste discrimination by rats depends on the input of the seventh cranial nerve. Am J Physiol 272: R1210–R1218, 1997. [DOI] [PubMed] [Google Scholar]
- St. John 2000.St. John SJ, Smith DV. Neural representation of salts in the rat solitary nucleus: brain stem correlates of taste discrimination. J Neurophysiol 84: 628–638, 2000. [DOI] [PubMed] [Google Scholar]
- St. John 1998.St. John SJ, Spector AC. Behavioral discrimination between quinine and KCl is dependent on input from the seventh cranial nerve: implications for the functional roles of the gustatory nerves in rats. J Neurosci 18: 4353–4362, 1998. [DOI] [PMC free article] [PubMed] [Google Scholar]
- Strettoi 2004.Strettoi E, Mears AJ, Swaroop A. Recruitment of the rod pathway by cones in the absence of rods. J Neurosci 24: 7576–7582, 2004. [DOI] [PMC free article] [PubMed] [Google Scholar]
- Travers 1987.Travers JB, Grill HJ, Norgren R. The effects of glossopharyngeal and chorda tympani nerve cuts on the ingestion and rejection of sapid stimuli: an electromyographic analysis in the rat. Behav Brain Res 25: 233–246, 1987. [DOI] [PubMed] [Google Scholar]
- Travers 1991.Travers SP, Norgren R. Coding the sweet taste in the nucleus of the solitary tract: differential roles for anterior tongue and nasoincisor duct gustatory receptors in the rat. J Neurophysiol 65: 1372–1380, 1991. [DOI] [PubMed] [Google Scholar]
- Travers 1986.Travers SP, Pfaffmann C, Norgren R. Convergence of lingual and palatal gustatory neural activity in the nucleus of the solitary tract. Brain Res 365: 305–320, 1986. [DOI] [PubMed] [Google Scholar]
- van der Klaauw 1995.van der Klaauw NJ, Smith DV. Taste quality profiles for fifteen organic and inorganic salts. Physiol Behav 58: 295–306, 1995. [DOI] [PubMed] [Google Scholar]
- Verhagen 2005.Verhagen JV, Giza BK, Scott TR. Effect of amiloride on gustatory responses in the ventroposteromedial nucleus of the thalamus in rats. J Neurophysiol 93: 157–166, 2005. [DOI] [PubMed] [Google Scholar]
- Zhao 2003.Zhao GQ, Zhang Y, Hoon MA, Chandrashekar J, Erlenbach I, Ryba NJ, Zuker CS. The receptors for mammalian sweet and umami taste. Cell 115: 255–266, 2003. [DOI] [PubMed] [Google Scholar]
Associated Data
This section collects any data citations, data availability statements, or supplementary materials included in this article.