Abstract
Compared with rigid objects, grasping and lifting compliant objects presents additional uncertainties. For any static grasp, forces at the fingertips depend on factors including the locations of the contact points and the contact forces must be coordinated to maintain equilibrium. For compliant objects, the locations and orientations of the contact surfaces change in a force-dependent manner, thus changing the force requirements. Furthermore, every force adjustment then results in additional changes in object shape. This study characterized force and muscle activation patterns in this situation. Fingertip forces were measured as subjects grasped and lifted a 200-g object using their thumb, index, and ring fingers. A spring was sometimes placed under the index and/or ring finger contact surface. Surface electromyographic activity was recorded from ten hand muscles and one proximal arm muscle. The patterns of grip (normal) force and muscle activity were similar across conditions during the load and lift phases, but their amplitude depended on whether the contact surface was compliant. Specifically, the grip force increased smoothly during the load phase of the task under all conditions. To the contrary, the tangential contact (load) force did not increase monotonically when one or more of the contact surfaces were compliant, resulting in a decoupling of the grip and load forces.
INTRODUCTION
The forces required to grasp and lift a rigid, handheld object depend on a large number of factors, including the type of grasp used and the basic requirements for equilibrium. These requirements are well understood (Flanagan et al. 1999, 2006; Yoshikawa and Nagai 1990, 1991; Zatsiorsky and Latash 2004). To prevent slip, the ratio between the normal force (grip force) and the tangential contact force (load force) must exceed a value that is defined by the frictional properties of the object. When friction is low, higher normal forces are required to prevent the object from slipping and it has been shown that the ratio of the normal force to the load force is controlled in a fairly precise manner (Johansson and Cole 1994; Westling and Johansson 1984). The forces must also be controlled in a manner that is specific to the grip used to hold the object and the object's inertial properties (Rearick and Santello 2002; Zatsiorsky et al. 2005). For a two-digit grasp the grip force vectors should be equal and opposite in direction, whereas a tripod grasp using the thumb and two fingers requires that the three grip force vectors intersect at a common point called the force focus (Baud-Bovy and Soechting 2001; Yoshikawa and Nagai 1991). However, in a tripod grasp, the load force at each of the contact surfaces depends on the precise location of the center of pressure and the tangential torque (the component normal to the contact surface) exerted by the finger (Baud-Bovy and Soechting 2002). Random trial-to-trial variations in these parameters can produce fluctuations in the load force of as much as 10%. Thus the force requirements for grasping rigid objects are not entirely predictable. One solution to this problem is to use feedback. Alternatively, one could take advantage of the inherent compliance of the hand to compensate for unpredictable force fluctuations (Winges et al. 2007).
When grasping and lifting compliant objects, the orientations and locations of the contact surfaces change in a force-dependent manner. These changes require force adjustments to meet equilibrium requirements for the new object shape. Of course, these force adjustments then result in additional shape changes. The challenge becomes even greater when a compliant surface is potentially unstable. Such a case is presented when one attempts to compress a slender spring; if the force is not centered on the spring or its direction is not parallel to the axis of the spring, the spring can buckle. This problem has been studied by Venkadesan et al. (2007) who defined the stability criterion for a spring compression task using the thumb pad. They showed that the task was stable if the end cap did not rotate beyond a specific amount that depended on the spring's properties and on the magnitude of the compressive force. They also showed that subjects used tactile and visual feedback to perform this task, with tactile cues dominating over visual cues, unless they were made unavailable by anesthesia.
Herein we address the question of how grasp forces and the patterns of activation of finger muscles used for grasping rigid objects are altered when the object is compliant. We used an approach similar to that used by Valero-Cuevas et al. (2003) and Venkadesan et al. (2007): either one or two of the contact points were coupled to a rigid object by means of a spring that was compressed and that could cause the contact surface to rotate when the object was grasped. Our first aim was to characterize how the coordination of forces across digits was affected by compliance. For example, did subjects attempt to minimize the deflection of the compliant contact surface(s) during the task? Our second aim was to characterize how the activation patterns of intrinsic and extrinsic hand muscles were altered when subjects grasp compliant objects.
METHODS
Six subjects participated in the study (three male, three female; ages 20–23 yr; 1.60–1.83 m in height; five right-handed and one left-handed). The experimental protocol was approved by the University of Minnesota's Institutional Review Board and all subjects gave informed consent prior to the experiment.
Instrumentation
Subjects grasped a 200-g instrumented manipulandum from above with the right hand, using a tripod grasp, i.e., with the thumb, ring, and index fingers on the transducers. The three contacts points were approximately in a horizontal plane and were constrained to the surfaces of 17-mm-diameter force-torque transducers (ATI Nano 17 US-6-2). The contact surfaces were covered with No. 60 sandpaper and the contact surface of the thumb sensor was parallel to the frontal plane of the subject. The contacts for the ring and index fingers were each fixed to the object in series with a spring (stainless steel, free length: 25.0 mm, diameter: 8.0 mm, number of coils: 8, wire diameter: 0.8 mm). One end of the spring was connected directly to the transducer, whereas the other end was connected to the manipulandum through a short guide tube (10 mm) to limit the vertical displacement of the contact surface due to the weight of the transducer, while allowing a greater compression distance than a shorter spring.
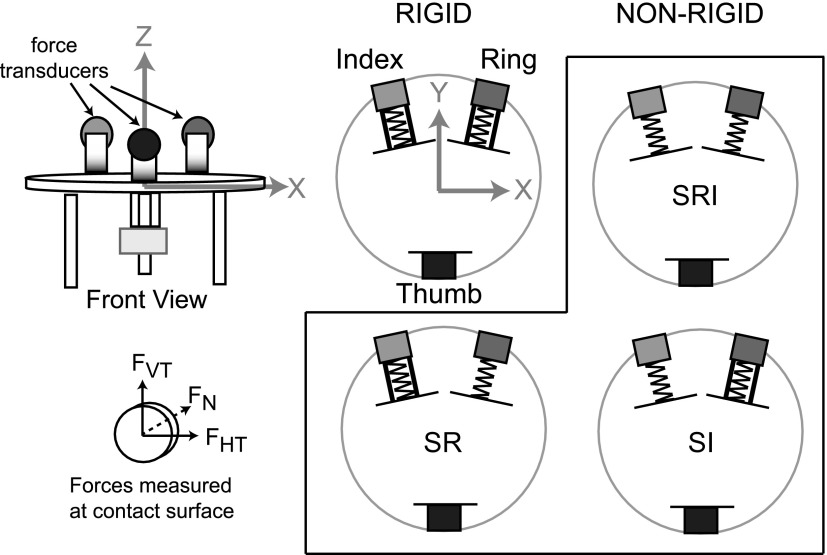
As illustrated in Fig. 1, subjects performed a lift and hold task for one rigid condition (RIG) and three nonrigid conditions where the spring was allowed to deform at either the ring contact (S-R), index contact (S-I), or at both ring and index finger contacts (S-RI). In nonspring conditions, bracing (depicted by black bars, Fig. 1) was used to maintain a rigid relation between the object and transducer (i.e., to prevent the spring from deforming). In the fully rigid condition, the distance between the thumb contact surface and the center of the finger contacts was 8.4 cm in the Y-dimension (forward). The distance between the centers of the finger contact surfaces was 4.8 cm in the X-dimension (left–right). Forces and torques from the transducers were sampled at 1 kHz and the six-dimensional position and orientation of the object were sampled at 60 Hz using a Polhemus Fastrak system. Force and orientation data were low-pass filtered prior to analysis (fourth-order Butterworth, 10-Hz cutoff frequency). Thus the filter settings attenuated frequencies >10 Hz. Based on a power spectral analysis of the unfiltered data, >99.3 and 99.5% of the power of force and position data, respectively, were at frequencies <10 Hz.
FIG. 1.
Manipulandum. Front view shows the configuration of the force transducers on the manipulandum with arrows pointing in the positive X and Z dimensions. Top view shows the rigid and 3 nonrigid configurations along with the positive X and Y dimensions.
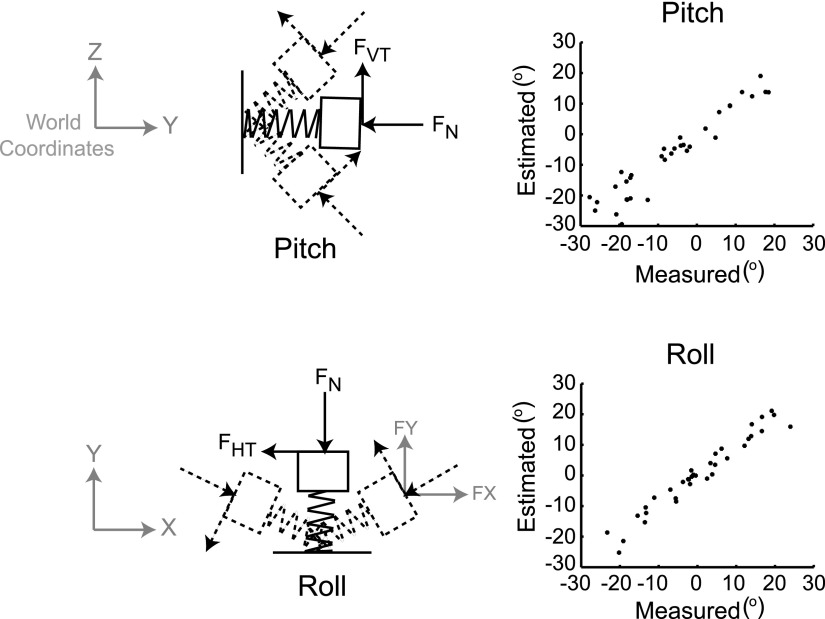
In a separate experiment, the springs were calibrated to estimate the contact surface deflection due to forces and torques during the lift and hold task (Fig. 2). During the calibration experiment only, the Polhemus sensor was fixed to the contact surface of the force transducer, enabling us to record both force and orientation data at the contact surface. In 36 trials, force was applied in various magnitudes and directions to the ring and index contacts (with springs in series).
FIG. 2.
Spring calibration. Panels in the left column show possible pitch and roll rotations of the transducer surface and the changes in the orientation of the forces measured at the transducer due to these rotations. The right column shows the results of the calibration, with the estimated pitch and roll angles plotted against the actual measured angles.
Stepwise multiple regression analysis, using the Matlab 7.0 function “stepwisefit” with entry and exit values set to P < 0.05, was used to fit forces and torques onto orientation data, including only those parameters whose contribution was significant. Multicollinearity between the forces and torques was also examined. The results provided an estimate of the stiffness for each spring and linear equations that provided estimates of the changes in contact surface orientations that result from applied force. Stiffness values were 0.91 and 0.89 N/mm for the ring and index springs, respectively. Regression coefficients for determining the deflection in pitch and roll (in degrees, relative to the orientation in the rigid condition, shown as the solid outline in Fig. 2) were the same for both contacts
 |
(1) |
 |
(2) |
where FVT and FHT are vertical and horizontal tangential forces (in N), respectively, and TH and TV (N/mm) are torques measured about the horizontal (HT; Fig. 2) and vertical (VT) axis, respectively, measured at the transducer surface. [These torques result when the force is applied off-center on the contact surface (Baud-Bovy and Soechting 2001; Winges et al. 2008).] R2 values for pitch and roll were 0.92 and 0.95, respectively and indicated that our equations could approximate surface deflections due to forces used to lift and hold the object. The yaw rotations were not calibrated since they were very small. The mean yaw rotation was 1.19 ± 0.70° for the ring and 1.87 ± 1.76° for the index transducers. In Fig. 2 (right column), the estimated rotations computed using Eqs. 1 and 2 are plotted against the measured pitch and roll rotations. The root-mean-square error of the fit was 4.03° for pitch and 2.51° for roll. For the forces in world coordinates, this translates into a 2 to 3% uncertainty in the Y-component of the contact forces. The uncertainty in estimating the X- and Z-components of the forces is larger (≤20%) because the amplitudes of those forces were smaller compared with that of the Y-component. In the analysis of the main experimental results, Eqs. 1 and 2 were used to convert the measured forces from local transducer coordinates into world coordinates (see following text).
Surface electromyograms (EMGs) were recorded using small (2-mm-diameter conductive surface) bipolar Ag/AgCl surface electrodes (Discount Disposables, St. Albans, VT) placed 10 mm apart (see Fig. 2 of Winges et al. 2007). These electrodes were permanently soldered to custom-made, electrically shielded wire leads and connected to standard laboratory amplifiers (Model 1700 Differential AC Amplifier, A-M Systems). A ground electrode was placed on the subject's contralateral, nonmoving wrist. EMG was amplified (×1,000), band-pass filtered (60–500 Hz), and then sampled at 1,000 Hz.
EMG activity was recorded from one proximal arm muscle: biceps (BIC), and three portions of extrinsic finger muscles: a central portion of extensor digitorum (ED) and two portions of flexor digitorum superficialis, one closer to the index finger (FD) and the other closer to the ring finger (FD2). We also recorded from four intrinsic finger muscles: first dorsal interosseus (FDI), index and ring lumbricals (LUMi, LUMr, respectively), and abductor digiti minimi (ADM); as well as two intrinsic thumb muscles: abductor pollicis brevis (APB) and flexor pollicis brevis (FPB). LUMi lies above adductor pollicis, but the fibers of this thumb muscle run orthogonal to the axis of the bipolar LUMi electrodes; LUMr is beneath a relatively thick layer of tissue but is not close to other muscles.
Cross talk between the APB and FPB electrodes was previously estimated to be <16% of the recorded signal using the same electrodes and the same electrode placement (Klein Breteler et al. 2007), implying relatively selective recording. Anatomical considerations and pilot studies suggest comparable selectivity in the other recording channels (see Fig. 2 of Klein Breteler et al. 2007), although single motor units within a given muscle, head, or compartment are known to be differentially recruited according to task parameters (Hermann and Flanders 1998; Weiss and Flanders 2004). In the present experiments there was not a large variability in hand posture since it was constrained by task demands (contact and grasp of the manipulandum at three contact surfaces). Prior to the onset of each experiment, we informally tested electrode sensitivity by having subjects perform appropriate maneuvers to contract selected muscles. For two subjects, instead of recording from BIC and ADM, EMG activity was recorded from two wrist adductors, extensor carpi ulnaris (ECU) and flexor carpi ulnaris (FCU), which also produce wrist extension and flexion, respectively.
Experimental procedures
In response to a tone, subjects were asked to grasp the manipulandum with their right hand using a tripod grasp, lift it (typically about 3 to 7 cm), and hold it for about 4 s. Then, in response to a second tone, they replaced it on the table. Subjects were instructed to minimize the amount of rotation of the manipulandum (i.e., to keep the object level) during the lift and hold. To familiarize subjects with the movements, prior to the start of the experiment, practice (three to five trials) was given for the rigid condition. Subjects completed a total of 60 rigid (RIG) trials and 60 nonrigid trials, where the spring was either at the ring contact (S-R), index contact (S-I), or both ring and index contacts (S-RI). Subjects performed the trials in the following order (#trials/condition): 20/RIG, 20/S-R, 10/RIG, 20/S-I, 10/RIG, 20/S-RI, and 20/RIG.
Data analysis
For each trial the load, lift, and hold phases were identified. The beginning of the load phase was defined as the time at which at least one digit exceeded and maintained a normal force >0.01 N. The load phase ended and the lift phase began when vertical velocity was ≥10% of the peak; the lift phase ended when the vertical velocity was ≤10% of the peak vertical velocity for that trial. The hold phase began at the end of the lift phase and ended when vertical velocity was ≥10% of the peak velocity during the replacement movement.
Forces measured at each contact were converted into world coordinates, as defined in Fig. 1, with arrows indicating the direction of positive sign for each dimension. Forces measured at the thumb contact did not require conversion into world coordinates since the contact surface was in the X–Z plane and perpendicular to the Y-direction; therefore at the thumb contact only, FHT = FX, FVT = FZ, and FN = FY. When the ring and index contacts were rigid, their surfaces were also in the vertical plane so FVT = FZ. However, they were oriented at ±12° from the X-direction, which required a conversion since a small portion of FN was actually in the X-direction and a small portion of FHT was in the Y-direction. When the ring and/or index contact(s) were compliant, the surface orientation was approximated using the spring calibration equations (see earlier text) to resolve the force measured at the surface into components in world coordinates (Fig. 2, left column). After conversion of forces into world coordinates, horizontal force vectors were computed as the resultant of the forces in the X- and Y-dimensions and were assumed to originate from the center of pressure (computed from the torque measures; see Eqs. 1 and 2; Winges et al. 2008) at the respective digit. For comparisons across subjects, orientation, force, and EMG data were time normalized to 100 points for each phase, resulting in 300 total points per trial.
Statistical analysis was completed using SPSS 16.0 GP. ANOVAs (with Bonferroni post hoc correction for multiple comparisons) were used to determine the effect of compliance condition (independent variables) on movement, position, and force (dependent variables). Data for each dependant variable were tested for normality and homogeneity of variance. The appropriate transformations were made to maintain the assumption of normality for the ANOVA and the Games–Howell post hoc test (which does not assume equal variance across groups) was used if the variance was heterogeneous across groups. Regression analysis was used to examine trends in the data that resulted from experience, i.e., increase or decrease by trial number. A significance level of 0.05, corrected for multiple comparisons when appropriate, was used for all analyses. All values are mean ± SD unless otherwise noted.
The EMG signal for each muscle was rectified and then low-pass filtered (finite impulse response [FIR] filter; 20-Hz cutoff; zero phase distortion; d'Avella et al. 2006) prior to analysis. EMG waveforms for each trial were normalized to the maximum amplitude observed for that muscle during the entire experiment.
RESULTS
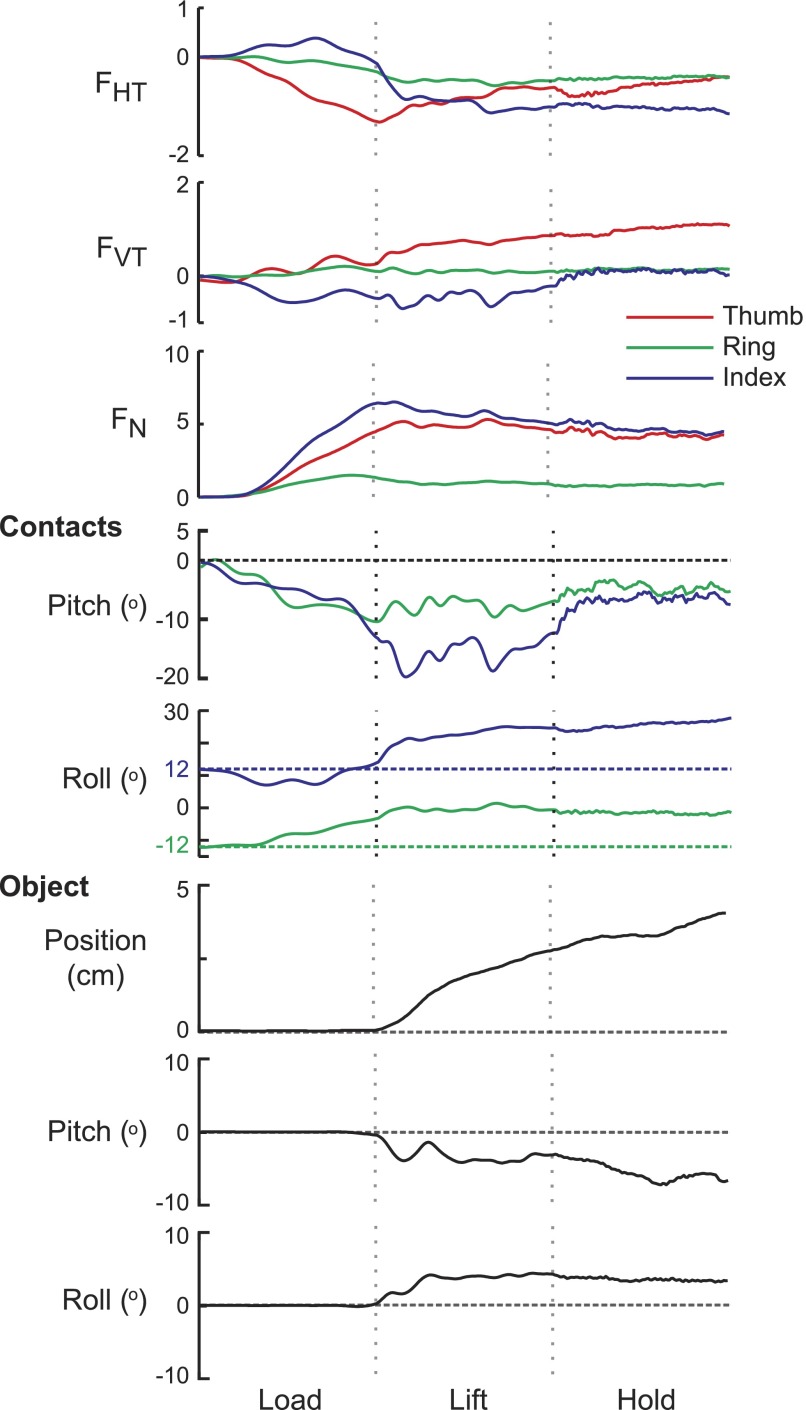
All subjects performed the lift smoothly and held the object without dropping it for all conditions (see Fig. 3 for a representative trial). The object was very close to level throughout the lift and hold phases, with average peak rotations in pitch and roll within ±6° of level. The peak rotation typically occurred shortly after the start of the lift and then leveled off during the lift. Mean pitch and roll rotations were −0.06 ± 1.56 and 1.14 ± 1.35, respectively, across all subjects and conditions.
FIG. 3.
Local forces, position, and rotation. Time normalized data from one subject are shown for each digit, for one trial in the spring at both ring and index finger contacts (S-RI) condition. Horizontal and vertical tangential as well as normal forces (FHT, FVT, and FN, respectively) measured at the thumb, ring, and index contacts are shown. Dashed lines indicate the start of the lift and hold phases. Contact surface deflections in pitch and roll are also shown. Horizontal dashed lines indicate angle when contacts are rigid. Object position in the vertical plane and pitch and roll object rotation is shown in the bottom panels.
The average durations for the load, lift, and hold phases were 454 ± 272, 883 ± 274, and 4271 ± 503 ms, respectively. ANOVA revealed significant differences for condition across all subjects for the load and lift phases. In the load phase, the nonrigid conditions (mean ± SD: 489 ± 187, 490 ± 211, 625 ± 334 ms, respectively for S-R, S-I, S-RI) had longer durations than the RIG condition (371 ± 125 ms; P < 0.001). The load phase was also about 25% longer when both finger contacts were compliant (S-RI) compared with the instances where only one contact was compliant (S-R: P = 0.018; S-I: P = 0.052). The duration of the lift phase for S-RI (1,085 ± 144 ms) was longer (P < 0.001) than that for the other three conditions (840 ± 129, 908 ± 204, and 815 ± 163 ms, respectively for S-R, S-I, and RIG) and it was also slightly longer for S-I than that for the RIG condition (P = 0.005).
Force patterns
Figure 3 shows the time-normalized forces measured at the transducer from a single trial in the double-spring (S-RI) condition from one subject for each digit. The thumb and index finger had the largest normal forces (FN) with very similar patterns, whereas FN-Ring was close to zero. For the trial in Fig. 3 the index provided the majority of the normal force to oppose the thumb. This behavior was typical of many (but not all) trials when both the ring and index contacts were not rigid. Subjects also tended to use a force pattern in which the thumb opposed the index finger when only the contact surface at the ring finger was compliant (S-R). For the S-RI condition, although the compliance of the springs at the ring and index contacts was the same, subjects tended to favor the index contact over using both finger contacts equally to oppose the force at the thumb. Thus for the trial in Fig. 3, the compression of the spring at the index contact and therefore the change in position of the contact surface was larger for the index than the ring contact.
Since the contacts were also free to rotate in pitch and roll, the horizontal and vertical tangential forces (FHT and FVT, respectively; Fig. 3) also resulted in displacement of the contact surfaces. Contact surface orientation was most variable during the load phase, for both pitch and roll (average SD 6.33 and 10.48°, respectively), slightly less variable during the lift phase (3.87 and 6.02°, respectively), and least variable during the hold phase (1.29 and 1.88°, respectively). Notice that the vertical tangential force measured at the thumb (FVT-Thumb) was positive, whereas FVT-Index was negative throughout the load and lift phases, and FVT-Ring was around zero throughout the entire trial. Even though the lift movement was completed fairly smoothly, the pattern of forces (in transducer coordinates) was complex, due to the displacement of the contact surfaces. To simplify our interpretation of the forces used to perform the task, we converted the contact forces into world coordinates, which took into account the orientation of the contact surfaces (see methods). From this point forward any reference to forces is to the forces converted into world coordinates.
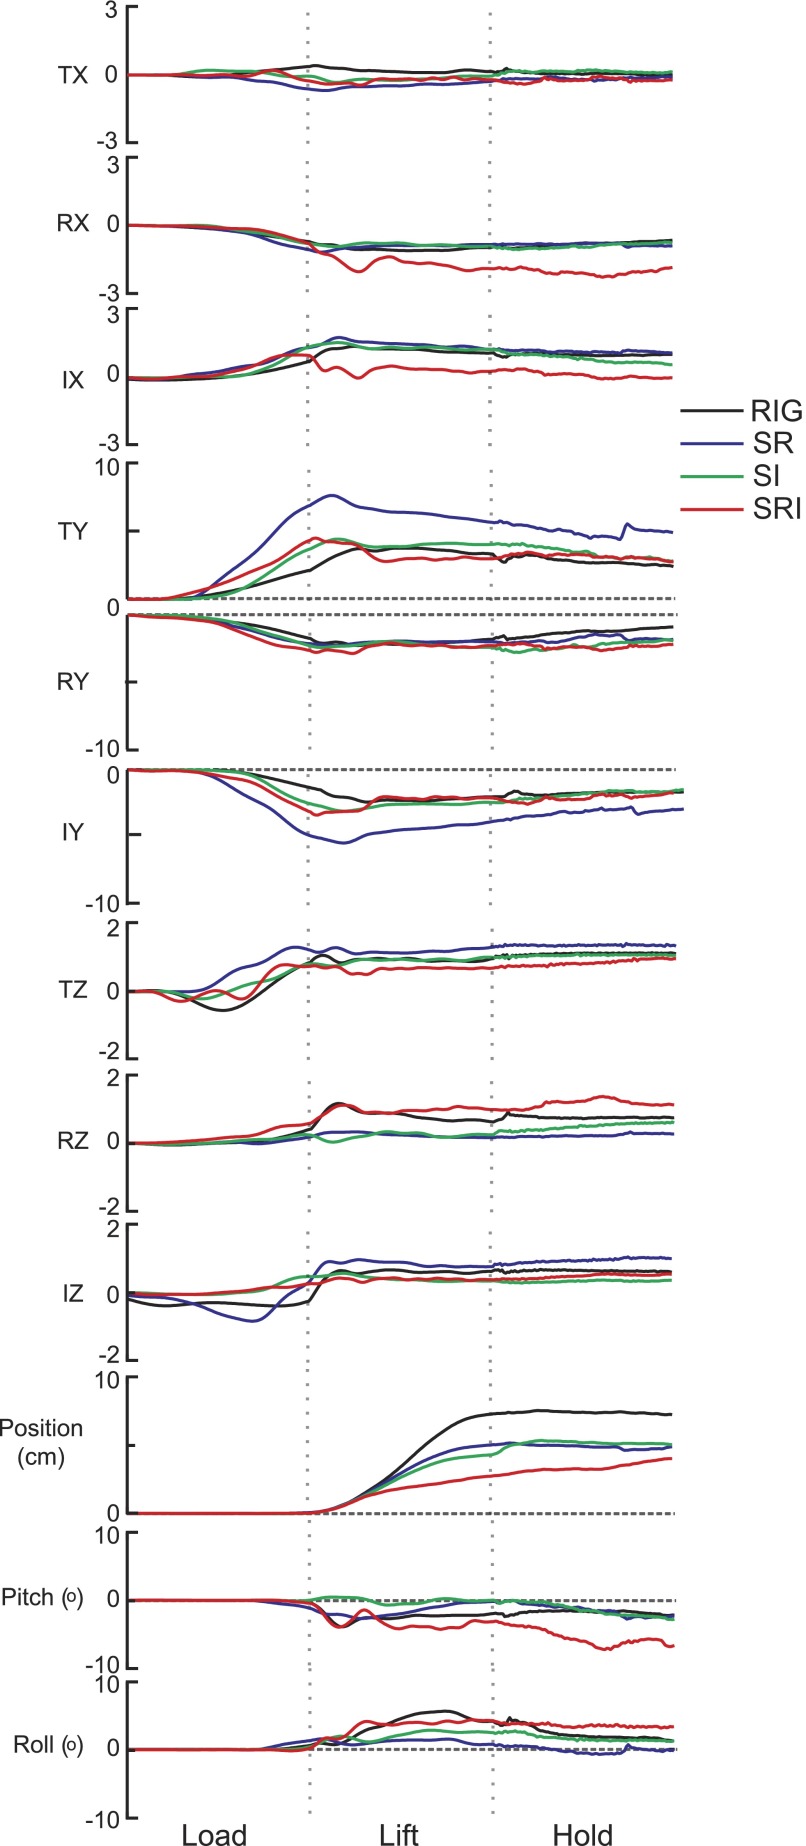
Figure 4 shows object position and forces (in world coordinates) from one exemplar trial from each condition. In these examples, the object was lifted smoothly as long as at least one of the contact surfaces at the ring or index finger was rigid (S-R, S-I), similar to the behavior observed when subjects lift a rigid object. A somewhat different pattern was observed when both contact surfaces were compliant (S-RI). The initial change in vertical position was similar to that in the other conditions, but the vertical motion then slowed down. (Recall that in these plots time has been normalized and that, overall, the duration of the lift phase for S-RI was about 25% longer than it was for the other three conditions.) The height to which the object was lifted was also less in the S-RI condition.
FIG. 4.
Force in world coordinates, vertical object position, and rotation. Time normalized data from one subject are shown for one trial from each condition. Forces (N) in the X, Y, and Z (vertical) dimensions are shown for each digit. Dashed lines indicate the start of the lift and hold phases. Object position in the vertical plane and pitch and roll rotations are shown in the bottom panels.
The general pattern of forces was similar across subjects. Notice that vertical forces (FZ) varied during the load phase and increased to some positive magnitude around lift onset and remained at that magnitude for the rest of the trial. During the hold, FZ at the thumb and index was smallest when the index contact was compliant (S-I, S-RI), whereas the opposite was true at the ring (P < 0.001). The magnitude of these significant differences ranged from 0.12 to 0.61 N. Since the object weight did not change across conditions, these differences most likely arose because the center of gravity of the manipulandum was no longer at the center of the three contact surfaces and because of the orientation of the object since it was not held perfectly horizontal.
Forces in the X-dimension were typically small and around zero for the thumb (TX), whereas the ring (RX) and index (IX) forces were slightly larger and had opposite signs, implying that the horizontal finger forces were directed primarily perpendicularly to the contact surfaces, which were nominally angled at 12° relative to the X-axis. During the hold, small differences across conditions in the mean FX were found and ranged in magnitude from 0.22 to 0.50 N across subjects (P < 0.001). At the thumb, the mean FX was always negative (leftward) but was closest to zero when only the index contact was compliant (S-I) and was most negative when the ring contact was compliant (S-R, S-RI; P < 0.001). The mean FX at the ring was also always negative with the RIG condition being closer to zero than when the index contact was compliant (S-I, S-RI; P < 0.001). FX at the index was always positive but was smallest when the index contact was compliant (S-I, S-RI; P < 0.001).
Forces in the Y-dimension, which represent most of the opposition force between the thumb and fingers used to grip the object, were the largest. These forces generally peaked around the time of lift onset and either maintained a similar magnitude or decreased slightly throughout the rest of the trial. The steady-state amplitude of TY and IY was comparable in all but the S-R condition (as discussed in the following text). Y-dimension forces at the ring finger (RY) were smaller and had an amplitude that was similar across conditions. Although the amplitude of RY was typically smaller than both TY and IY it did vary to some extent across trials and across subjects. Analysis across all subjects revealed that the steady-state force exerted by the ring finger (RY) was largest when only the index contact was compliant (P < 0.001). Conversely, the thumb and the index finger both produced significantly larger forces in the Y-direction when the ring contact was compliant (P < 0.001 for both comparisons), implying that the object was lifted using primarily the thumb and index fingers.
To define how the force amplitudes varied across trials, we first computed the average of the time normalized force data over all trials for each subject, and then did a regression between their average forces and the force data from each trial. The regression equation was
 |
(3) |
where F̂ is the mean force, Fi is the force in individual trials, and β is the weighting coefficient for trial i. A constant term was not included in the regression equation so that the weights (βs) could be directly compared across trials. The resulting weighting coefficients (β) and forces were averaged across subjects and examined for differences across conditions and changes across time within each condition. The panels in Fig. 5 A show the mean force across all conditions and subjects and the mean weighting of each trial across subjects (bar plot). We will subsequently take up the time course of the forces in detail (see Figs. 9 and 10). Considering the weightings, ANOVA revealed significant differences across conditions such that S-R had larger weightings than RIG, S-I, and S-RI (P < 0.001). Regression analysis within each condition revealed a small, significant trend of decreasing amplitude of the weights across trials for S-R only (β = −0.012, R2 = 0.034, P = 0.043).
FIG. 5.
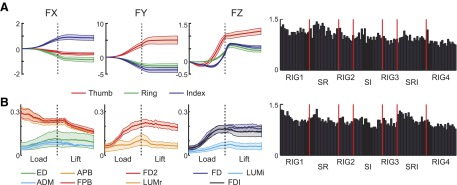
Mean force and electromyographic (EMG) patterns. The mean ± SE force (A) and EMG (B) patterns computed across all subjects are shown in the first 3 columns. The weighting for each trial (computed by regressing individual trial data onto the mean) is shown in the 4th column with vertical red lines separating blocks of trials.
FIG. 9.
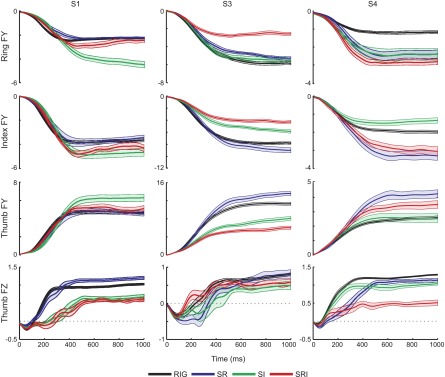
Grip and thumb load force patterns. The mean ± SE of FY at each contact and FZ at the thumb, aligned at thumb contact (t = 0), are shown for each condition from 3 subjects (columns).
FIG. 10.
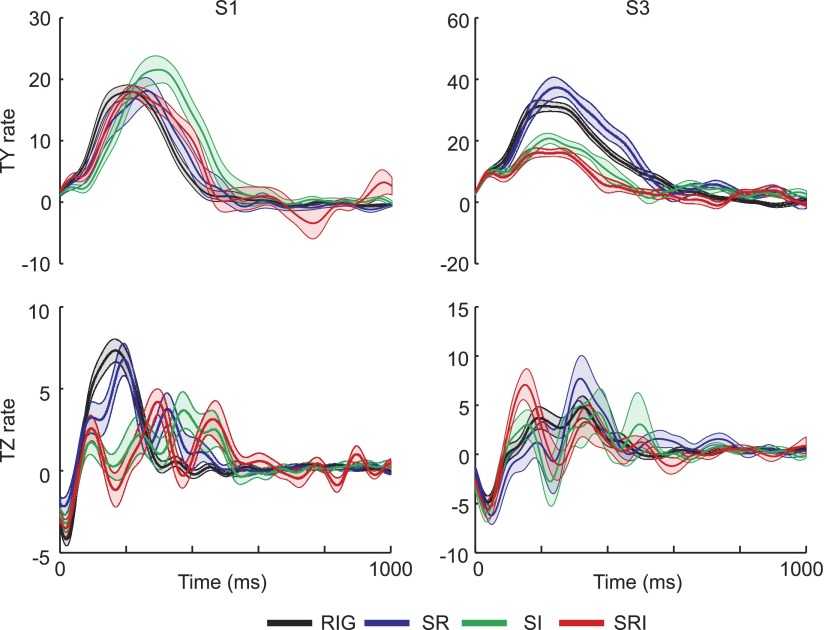
Rate of thumb grip and load force. The mean ± SE of the first derivative of the thumb grip and load force (FY and FZ, respectively), aligned to thumb contact, is shown for each condition from 2 subjects.
Patterns of muscle activation
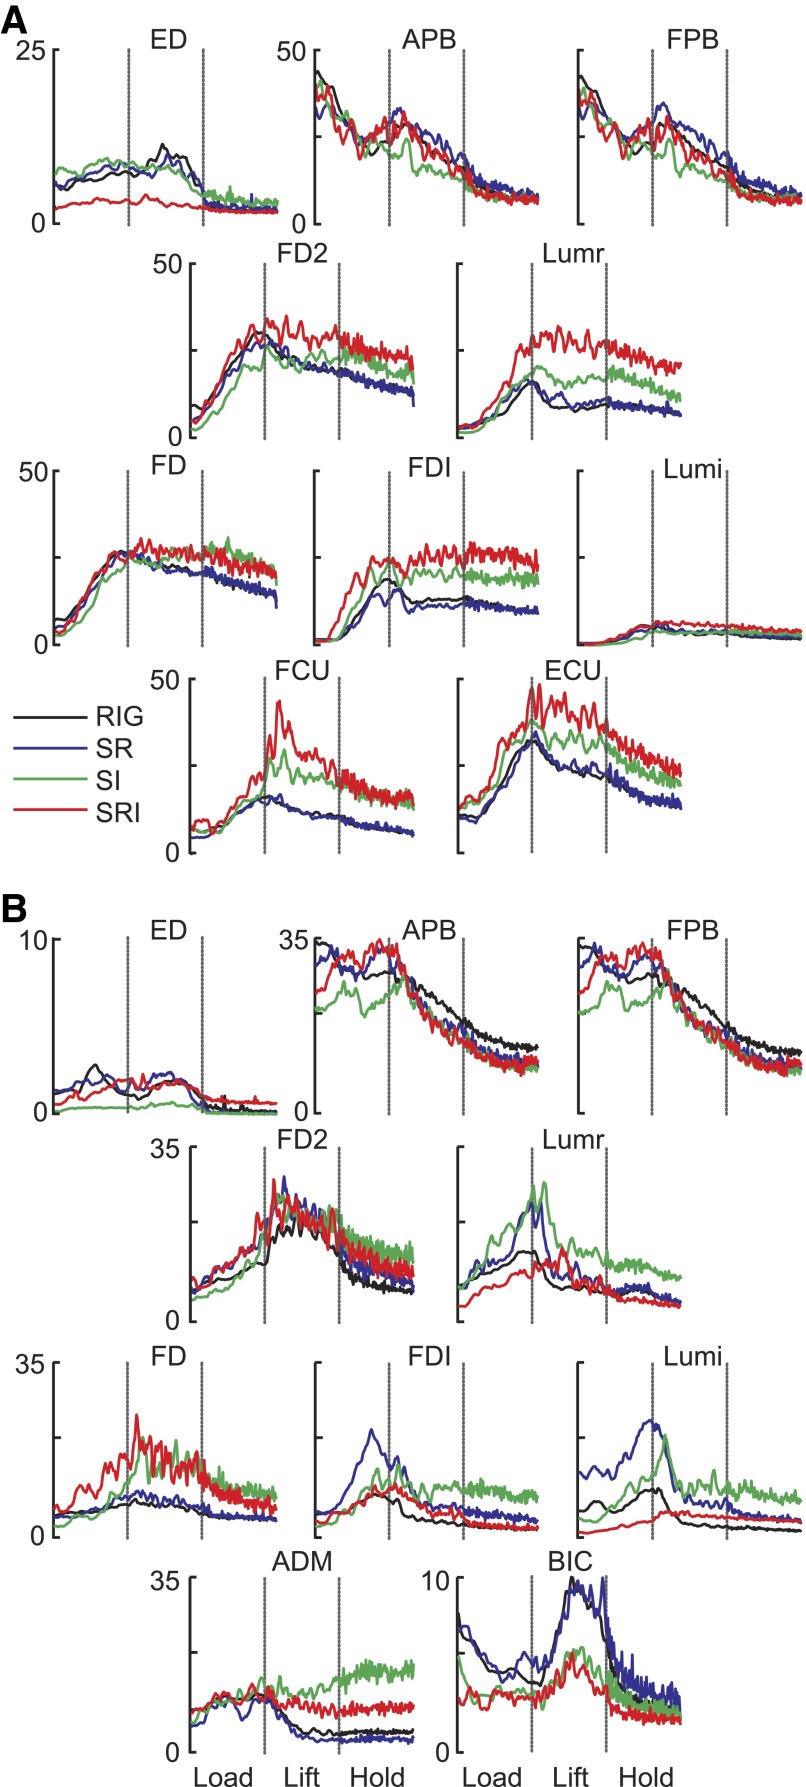
The general pattern of hand muscle activity was also similar across conditions with most muscles increasing activity during the load phase, peaking around lift onset and decreasing or maintaining a similar level of activation through the rest of the lift and hold (Figs. 5B and 6). Figure 6 shows results from two subjects, whereas averaged data from all subjects are shown in Fig. 5B. Wrist muscle activity (FCU, ECU, bottom traces in Fig. 6A) recorded from two subjects followed the same trend as the finger muscles and their cocontraction could result in a stiffening at the wrist in flexion–extension during the lift. Both ED (top panels in Fig. 6, A and B) and BIC (Fig. 6B, bottom) had a burst of activity around 50% of the lift phase. The burst in ED activity could have provided a resistance to wrist flexion during the lift, whereas the BIC activity is consistent with flexion at the elbow during the lift movement.
FIG. 6.
EMG. Amplitude- and time-normalized average EMG traces are shown for all conditions for 2 subjects. Each muscle is shown separately. The vertical dashed lines indicate the start of the lift and the start of the hold phase. EMG data are clustered by digit and each color represents a different condition. These 2 subjects were chosen to demonstrate all of the muscles recorded from, since flexor carpi ulnaris (FCU) and extensor carpi ulnaris (ECU) were recorded in 2 subjects, whereas biceps (BIC) and abductor digiti minimi (ADM) were recorded in the other 4 subjects.
The pattern of thumb muscle (APB, FPB) activity during the load phase was very different from that of the other hand muscles, in that they had relatively high levels of activation at the start of this phase. Johansson and Westling (1988) found a similar pattern in APB for a thumb–index grip, which they interpreted as being “related to an active spacing of the thumb and index finger” to grasp and lift the object. Although the fingers can be relaxed prior to gripping the object, the tripod grasp requires that the thumb be in a more abducted and flexed posture compared with its natural relaxed position. Thus the initial portion of the pattern for APB and FPB could reflect the activity required to maintain the thumb in the grip-ready posture. As the thumb gripped the object, the thumb muscle activity generally decreased. Around the start of the lift, thumb muscle activity slightly increased and then gradually decreased throughout the rest of the lift and hold.
Finger muscles associated with the ring or index finger all had relatively consistent patterns, regardless of condition. Although amplitudes differed across subjects, the general pattern included an increase during the load phase to a peak around the time of the lift, followed by at least a small decrease in amplitude during the hold phase. Examining the mean EMG patterns across all conditions and subjects (Fig. 5B), an ANOVA revealed that EMG amplitude for S-R and S-RI tended to be larger than that for RIG and S-I (P < 0.001). Trend analysis using linear regression across all trials revealed a weak trend for decreasing weights with increasing trial number (β = −0.01, R2 = 0.069, P < 0.001). Trend analysis within each condition also revealed trends for decreasing weighting with increasing trial number (RIG: β = −0.008, R2 = 0.047, P < 0.001; S-R: β = −0.014, R2 = 0.150, P < 0.001; S-I: β = −0.010, R2 = 0.082, P = 0.002; S-RI: β = −0.019, R2 = 0.158, P < 0.001).
Force direction and contact surface orientation
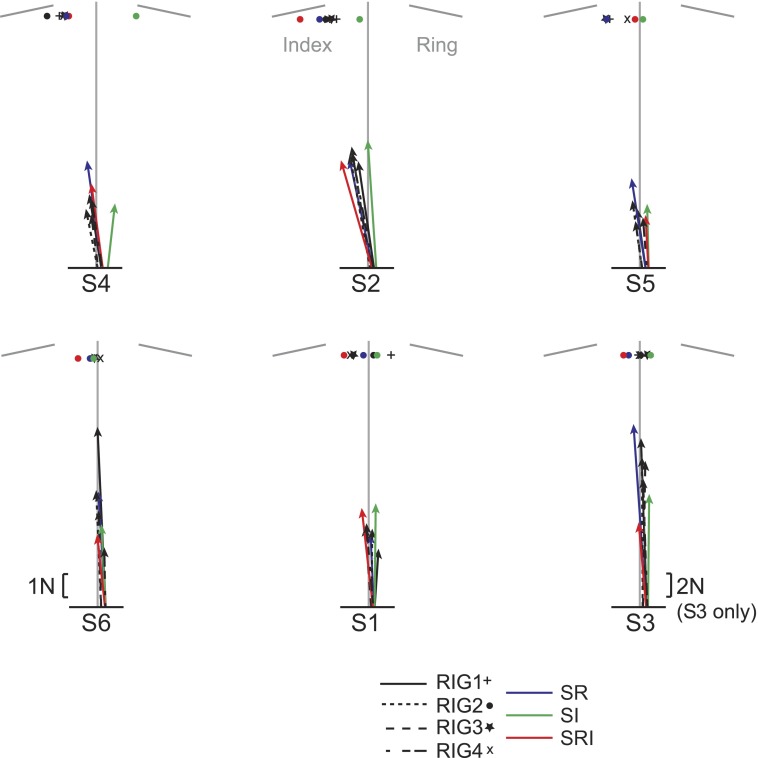
Figure 7 shows the average thumb force vector during the hold phase for each condition for each subject, the length of the vector being proportional to the force amplitude. Subjects in the top row tended to direct the thumb force toward the index finger except when the contact at the index finger was compliant (S-I), with an average direction of 8.86 ± 2.79° (−0.42 ± 5.36° for S-I). To the contrary, the subjects in the bottom row tended to direct the thumb force between the two fingers with an average direction of 2.14 ± 2.58°.
FIG. 7.
Thumb force direction during the hold. The mean thumb force direction for each condition during the hold is shown for each subject. The vertical gray line indicates the center between the ring and index contacts during the rigid condition. The symbols show where the force direction was pointing.
Analysis across all subjects revealed that the thumb force in the S-R and S-RI conditions tended to be directed more toward the index finger than it was in the first block of rigid trials (P < 0.001). The thumb force direction in the S-I condition was different from that in all other conditions (P < 0.001), directed more between the two fingers rather than toward the index finger, whereas for all other conditions the thumb force tended to be directed toward the index finger. Overall, these results suggest that the lift was controlled preferentially by an opposition of the thumb force and the index finger force except when only the index finger contact surface was compliant, i.e., S-I condition.
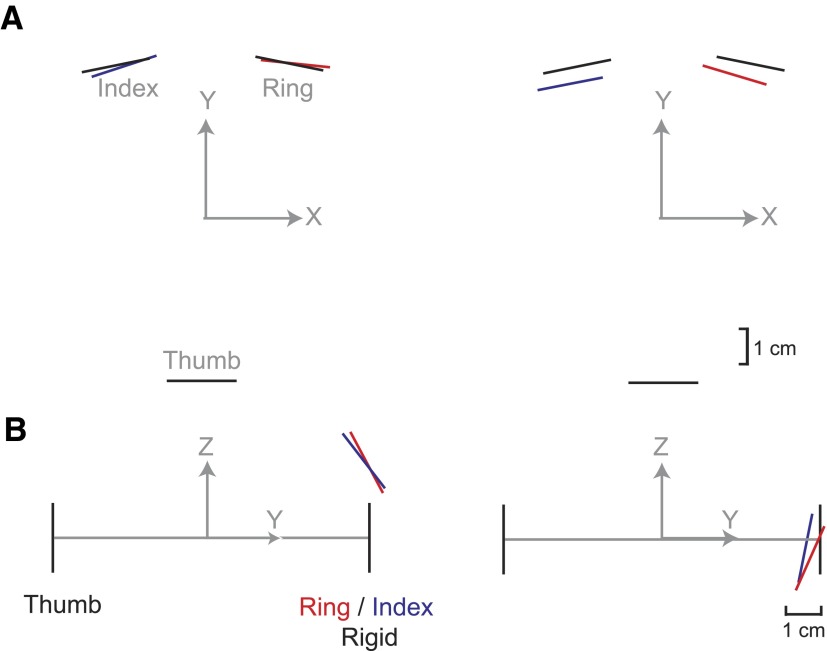
For the nonrigid conditions, the location and orientation of the compliant contact surfaces changed. Using data from the hold phase of the S-RI condition, Fig. 8 shows the mean of the estimated contact surface orientations for two subjects (left and right columns) who had used different strategies. Figure 8A shows contact surface position in the horizontal plane (as viewed from above), resulting from spring compression and roll rotation; Fig. 8B shows contact surface position in a side view, illustrating the effect of spring compression and pitch rotation. The undeflected contact surface locations are shown by the black lines. Differences in the amount of displacement in the Y-dimension reflect the subjects' strategies for performing the task in the S-RI condition: the subject on the left tended to grip the object with less force than the subject on the right resulting in a smaller displacement of the contact surface compared with the rigid position. However, when subjects produced less force, there was a greater vertical displacement of the contact surface and a greater pitch rotation (because of the deflection of the spring resulting from the object's weight) than when subjects used a more forceful grip (as can be seen by comparing the left and right columns in Fig. 8). Two subjects used the strategy shown on the left, whereas two subjects used the strategy shown on the right. The other two used a strategy that fell between the two extremes shown in Fig. 8.
FIG. 8.
Mean surface deflection for compliant contacts. Mean surface deflections are shown for 2 subjects (compare columns) for the rigid and S-RI condition. Solid black lines denote the contact surface positions during the rigid condition, whereas the red and blue lines indicate the positions of the ring and index contacts, respectively during the S-RI condition. Gray arrows denote the world coordinate system with respect to the contacts. A: the view from above the object, showing the deflection due to compression of the spring and roll rotation. B: a side view showing the deflection due to pitch rotation as well as spring compression.
Mean contact surface deflections for each condition are shown for each subject in Table 1. The mean contact surface deflection across subjects in pitch at the ring contact was 3.00 ± 16.83° for S-R and 0.30 ± 23.39° for S-RI. At the index contact mean deflections in pitch were 15.30 ± 18.72° for S-I and 11.28 ± 19.95° for S-RI. Surface deflections in roll tended to be smaller for both the ring contact (−0.17 ± 5.10 and −1.97 ± 9.94° for S-R and S-RI, respectively) and index contact (0.94 ± 6.16 and −0.65 ± 10.52° for S-I and S-RI, respectively). An analysis of the trends across trials did not provide strong evidence that subjects learned to minimize changes in the orientation of the contact surfaces during the course of 20 trials. There were trends for deflections in pitch at the index contact for S-I in four subjects. For two subjects deflection magnitude decreased with trial number (slope β = −1.02, R2 = 0.55, P < 0.001; β = −0.41, R2 = 0.20; P = 0.048), but the opposite was true for the other two subjects (β = −2.58, R2 = 0.43, P = 0.002; β = 0.65, R2 = 0.67, P < 0.001). For S-R only one subject had a significant trend in deflection at the ring contact (β = −0.56, R2 = 0.26, P = 0.023), although it was mostly because the sign of the pitch deflection changed from positive to negative. For the S-RI condition, only the ring contact had any trends: in pitch two subjects' deflection magnitude decreased slightly with trial number (β = 1.18, R2 = 0.22, P = 0.039; β = −0.73, R2 = 0.21, P = 0.040) and a trend occurred in roll for one subject that was due to a sign change (β = 0.82, R2 = 0.25, P = 0.024). Half of the significant trends (4/8) reflected at least a small decrease in the magnitude of deflection, whereas the other half were due to sign changes or had increased deflection magnitudes with trial. ANOVA revealed significantly larger pitch deflections at the ring contact for the S-RI condition than for S-R (P = 0.004). Significantly larger roll deflections at the index and ring contacts occurred when both contacts were compliant (S-RI) compared with conditions when only one contact was compliant (S-R, S-I; P < 0.001).
TABLE 1.
Mean roll and pitch surface deflections during the hold phase
| Subject | Roll |
Pitch | ||||||
|---|---|---|---|---|---|---|---|---|
| SR |
SI | SRI | SR | SI | SRI | |||
| Ring | Index | Ring | Index | Ring | Index | Ring | Index | |
| S1 | −0.77 | 3.07 | −4.60 | 1.19 | −0.71 | 9.35 | −13.36 | 1.74 |
| S2 | −0.35 | 0.63 | −5.76 | −5.55 | 7.35 | 13.93 | −1.45 | 6.74 |
| S3 | −6.71 | −1.91 | −6.50 | 0.11 | −24.75 | −13.47 | −24.00 | −11.35 |
| S4 | −0.97 | 0.97 | −6.87 | −8.55 | −1.32 | 21.11 | −17.32 | 6.14 |
| S5 | 0.44 | 7.95 | 6.90 | 8.08 | 11.66 | 32.85 | 28.06 | 37.65 |
| S6 | 2.35 | −5.08 | −0.41 | −0.80 | 25.80 | 28.01 | 29.88 | 26.77 |
The mean deflection (degrees) of the ring and index contact surfaces during the hold phase is shown for each subject when one (SR, SI) or two (SRI) contacts are compliant.
Temporal patterns of contact forces
The main changes in force occurred during the load phase and in the early portion of the lift. Since there were differences in the duration of these phases across conditions (see earlier text), for further analysis forces were aligned to the onset of thumb contact for each trial before averaging, without normalizing the data in time (as was done in Figs. 4 and 5). Figure 9 shows the mean ± SE of the grip force (FY) at each digit and the thumb load force (FZ), for three different subjects, for 1 s after thumb contact. Whereas the steady-state amplitude could vary across conditions, the time course of the grip force in all three digits was very similar across the rigid and all of the nonrigid conditions. This can also be appreciated in the top panels of Fig. 10, which show the rate of change in the thumb grip force. In agreement with previous observations (Johansson and Westling 1984), grip force increased smoothly and monotonically, with a single peak (200–400 ms after contact) in the rate of change in this force component. Furthermore, the rate at which grip force increased was similar, irrespective of whether the object was compliant (Fig. 10). This observation was true for all subjects.
Although the grip forces increased smoothly for all conditions, this was not true of the load force. For purposes of illustration, we show only the load force at the thumb, since this contact surface was always rigid. As expected, in each subject the thumb load force increased smoothly for the rigid condition (Figs. 9, bottom row and 10, black trace), in parallel with the increase in grip force. In contrast, the load force for the nonrigid conditions, especially the S-RI condition, did not increase smoothly. For two of the subjects in Fig. 9 (S1 and S3), the load force traces show clear oscillations. These are also evident in the traces of the rate of change in load force in Fig. 10. Even when the load force increased relatively smoothly, as it did for the S-R condition for S4 (Fig. 9, right), the increase in load force could be delayed with respect to the increase in grip force. Two of the other three subjects showed this decoupling between grip force and load force to a lesser extent, with this decoupled pattern appearing in about 20% of the trials. Only in one subject did the increase in load force parallel the increase in grip force.
Regression analysis was used to determine how well the grip and load forces were coupled during the initial load phase. The median R2 values for the first and last blocks of rigid trials (RIG1 and RIG4, respectively) and each of the nonrigid conditions are shown in Table 2. For all but S2, the distribution of R2 values from the regression was significantly different and skewed toward lower values for S-RI compared with RIG4. A similar decrease in the extent to which grip and load force covaried was also sometimes found for the other two compliant conditions (e.g., S-R for S4; see also Fig. 9).
TABLE 2.
Median R2 values
| Subject | RIG1 | RIG4 | SR | SI | SRI |
|---|---|---|---|---|---|
| S1 | 0.99 | 0.99 | 0.98 | 0.83†* | 0.61†* |
| S2 | 0.93 | 0.95 | 0.97† | 0.93 | 0.94 |
| S3 | 0.32 | 0.90 | 0.44* | 0.17* | 0.61* |
| S4 | 0.94 | 0.98 | 0.91* | 0.94 | 0.56†* |
| S5 | 0.96 | 0.96 | 0.94 | 0.98* | 0.96* |
| S6 | 0.38 | 0.90 | 0.91† | 0.81 | 0.64* |
Median R2 values are shown for each subject from regression of FZ onto FY during the load phase. Kolmogorov–Smirnov test was used to compare the R2 distributions between rigid and nonrigid conditions. Significantly different
(P < 0.05) from RIG1 or
RIG4.
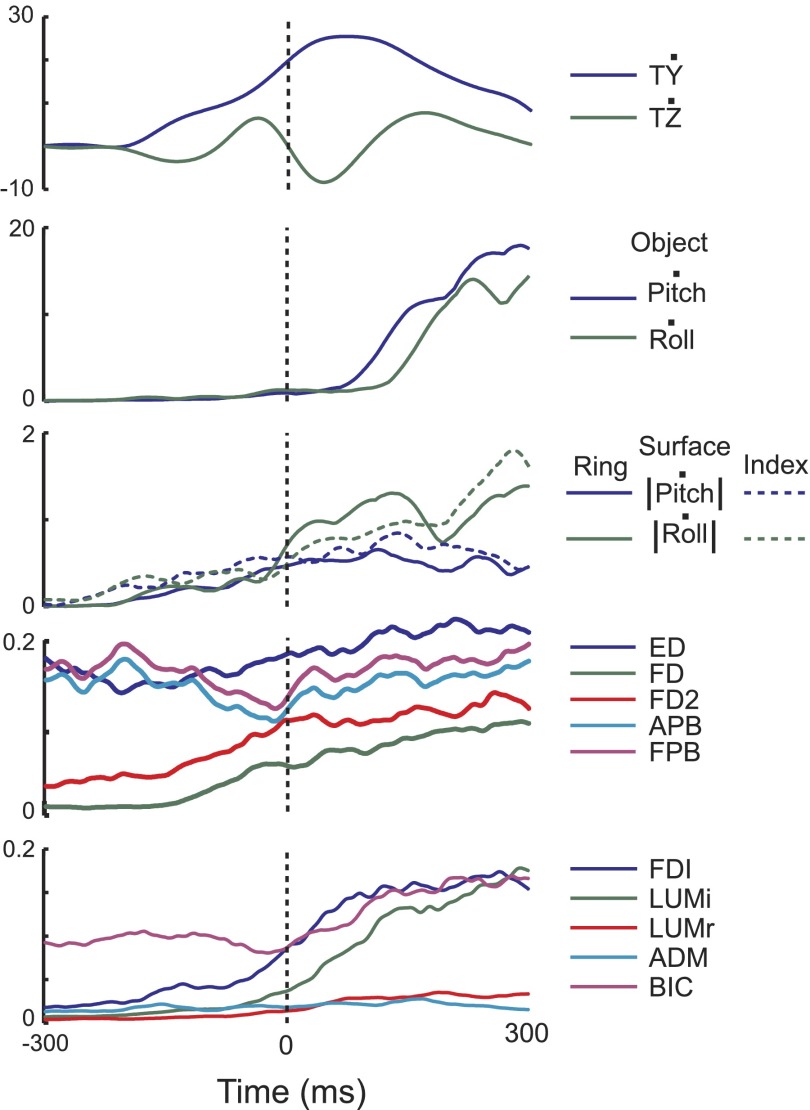
A subsequent analysis was performed to determine whether the fluctuations in load force were reactions triggered by sensory events, such as a change in object orientation or surface deflection, and whether these reactions might be reflected in the EMG activity. To this end, we aligned the data on the first zero crossing in thumb load force rate, after it had already begun to increase. Figure 11 shows the results from one subject, where the vertical line indicates the zero crossing with 300 ms of averaged data from all nonrigid conditions before and after that point. Changes in the orientation of the object were very small around time 0, although the contact surface deflection at the ring and index fingers was increasing around this time. This was especially true for the rate of change in the orientation of the contact of the ring finger in roll. In the example shown in Fig. 11, just prior to the zero crossing, the thumb EMG activity shows a decrease (APB, FPB), as does the proximal arm muscle (BIC), consistent with the decrease in load force. However, this was not consistent across subjects. Thus although it was difficult to find clear evidence in all subjects, the results in Fig. 11 are consistent with the hypothesis that the decoupling of the load and grip forces resulted from reactions to sensory events triggered by the changing deflection of one of the contact surfaces.
FIG. 11.
Force, orientation, and EMG patterns around TZ rate zero crossing. Averaged data from all nonrigid conditions from one subject aligned to the first zero crossing in TZ rate (vertical dashed line). Data from 300 ms before and after the zero crossing are shown.
DISCUSSION
Strategies for grasping compliant objects
When subjects grasped a compliant object, the temporal pattern of the grip force did not change, even though the duration of the load and lift phases was prolonged. When corrected for differences in the duration of the load and lift phase, the general pattern of muscle activity was also similar for rigid and compliant objects. Compared with the ring finger, the index finger was used preferentially to oppose the force generated by the thumb, except when only the index finger contact surface was compliant (the S-I condition). This observation may reflect the fact that forces generated by the index finger can be controlled more precisely in the sense that this digit exhibits a greater amount of individuation (Schieber and Santello 2004; Zatsiorsky et al. 2000). Some subjects gripped the object harder when it was compliant, whereas others used less force (Figs. 7 and 8). The latter strategy resulted in greater vertical displacement of the compliant contact surface (due to the gravitational load) and a greater pitch rotation. We found no evidence that subjects attempted to correct or to decrease the deflection of the contact surface (Fig. 3). Note that such corrections were not required explicitly by the task and the results suggest that subjects used these initial conditions to effectively lift and hold the object. Despite the large deflections at compliant contact surfaces, the orientation of the object was effectively stabilized.
Grip force–load force coupling
As noted earlier, the time course of the grip forces exerted at each of the three digits was unaltered when one or more of the contact surfaces were compliant (Figs. 9 and 10). To the contrary, the load force could increase more slowly and, not infrequently, it exhibited oscillations in its time course (Figs. 9 and 10). Accordingly, the tight coupling between the grip force and the load force that is normally observed when subjects grasp a rigid object was diminished (Table 2). This decoupling occurred most consistently when both ring and index contacts were compliant (S-RI). These observations have implications concerning the control strategy that subjects implement when grasping compliant objects.
When subjects initially contacted the object, they pressed down on it, producing a negative load force. This is consistent with previous observations (Flanagan et al. 1999; Reilmann et al. 2001). However, thereafter grip and load forces increase in unison during the load and early lift phase for two-digit (Burstedt et al. 1997; Edin et al. 1992; Jenmalm et al. 1998) and multidigit (Flanagan et al. 1999; Reilmann et al. 2001) grasps of rigid objects. This tight coupling between grip and load force is maintained if the object is subject to vertical accelerations, resulting in changes in the inertial load (Johansson and Westling 1984). This is true if the grasped object is oscillated intentionally by means of arm movements (Flanagan et al. 1993) and also when the changes in load force result from whole body movements such as during locomotion (Gysin et al. 2003). Only if the load force changes unpredictably does one find that changes in the grip force lag the changes in the load force (Cole and Abbs 1988; Gysin et al. 2008; Johansson and Westling 1984).
Based on these observations, it has been suggested that the grip force is normally generated in an anticipatory fashion using a feedforward estimate of the load force (Kawato 1999). If there are unanticipated changes in the load force, this feedforward control is supplemented by feedback from cutaneous afferents (Johansson and Westling 1984). Importantly, in this scheme, the grip force is subservient to the load force. Our results suggest that there is also a second mode of control in which the grip force is generated in a stereotypical fashion and the load force is modified based on the task demands.
The load force increased more slowly when the object was compliant and, consequently, the duration of the load phase increased. Furthermore, not infrequently, the load force no longer increased smoothly, tending to exhibit oscillations. It is possible that these transient decreases in load force rate were triggered by sensory events, that is, changes in the rate of deflection of the contact surfaces (Fig. 11). We speculate that these adjustments may be associated with a strategy for probing the compliance of the contacts to determine the precise forces to be used during the lift and hold phases. Furthermore, the decoupling between the load force and the grip force continued to persist even after the subject had several trials' worth of experience grasping the object with the compliant contact(s).
Somatosensory information
Somatosensory information is important for adjustment of motor commands to maintain a stable grasp while manipulating objects. Gordon et al. (1991) demonstrated that even in the presence of visual bias, somatosensory information can override visual information to adjust forces to be appropriate for an object's weight during the transition from loading to lifting for a thumb–index task. Additionally, earlier studies demonstrated that fast-adapting type I and slow-adapting type I units, which are particularly dense at the fingertips, respond strongly to skin deformation and displacement during early loading when forces are low, i.e., <1 N (Westling and Johansson 1987). Force adjustment responses that occur within 100 ms after the initial touch and are due to surface structure have also been observed during two-digit grasp tasks (Edin et al. 1992; Johansson and Westling 1984, 1987). However, these adjustments do not occur when afferent input is unavailable (Edin et al. 1992). Thus somatosensory input appears to provide information about the contact structure prior to initiation of muscle commands for the lift.
All three contacts in our tripod grasp were covered with coarse sandpaper, which minimized the potential for slips. However, somatosensory information about the compliant or rigid characteristics of the contact surface and its movement due to small forces and off-center positioning of the finger may have been used for planning the lift and hold. We identified load force adjustments at the rigid thumb contact that appeared to be related to the deflection of the compliant contact surfaces at the ring and/or index finger contact(s). Although the extent of these adjustments differed across subjects, the result was a decoupling of the grip and load force during the load phase that is not typical for grasping rigid objects.
Differences in the duration of the load phase also provide some evidence for the use of somatosensory information that fits with the result of the studies discussed earlier. Specifically, the load phase was >100 ms longer for the compliant conditions compared with the rigid condition. Additionally, when both finger contacts were compliant, the difference was >200 ms. Reilmann et al. (2001) also found that longer contact times were used when the contact surfaces in a five-digit grasp were rayon versus sandpaper. Therefore the longer load phase durations could reflect the use of somatosensory information to determine what motor commands should be issued for the lift, based on the compliance and orientation of the contact surfaces.
The probing strategy observed in the load force is consistent with this supposition. During the load phase for compliant conditions, subjects increased their grip force smoothly while the load forces were more variable, which may be associated with acquiring information about the contact structure. This initial force could represent a probe to sense initial conditions (i.e., contact location and deflection).
GRANTS
This work was supported by National Institute of Neurological Disorders and Stroke Grants NS-27484 and NS-50256. M. Flanders was partially supported by Intergovernmental Personnel Act Grant IOS-0735534 from the National Science Foundation.
REFERENCES
- Baud-Bovy and Soechting 2001.Baud-Bovy G, Soechting JF. Two virtual fingers in the control of the tripod grasp. J Neurophysiol 86: 604–615, 2001. [DOI] [PubMed] [Google Scholar]
- Baud-Bovy and Soechting 2002.Baud-Bovy G, Soechting JF. Factors influencing variability in load forces in a tripod grasp. Exp Brain Res 143: 57–66, 2002. [DOI] [PubMed] [Google Scholar]
- Burstedt et al. 1997.Burstedt MK, Edin BB, Johansson RS. Coordination of fingertip forces during human manipulation can emerge from independent neural networks controlling each engaged digit. Exp Brain Res 117: 67–79, 1997. [DOI] [PubMed] [Google Scholar]
- Cole and Abbs 1988.Cole KJ, Abbs JH. Grip force adjustments evoked by load force perturbations of a grasped object. J Neurophysiol 60: 1513–1522, 1988. [DOI] [PubMed] [Google Scholar]
- d'Avella et al. 2006.d'Avella A, Portone A, Fernandez L, Lacquaniti F. Control of fast reaching movements by muscle synergy combinations. J Neurosci 26: 7791–7810, 2006. [DOI] [PMC free article] [PubMed] [Google Scholar]
- Edin et al. 1992.Edin BB, Westling G, Johansson RS. Independent control of human finger-tip forces at individual digits during precision lifting. J Physiol 450: 547–564, 1992. [DOI] [PMC free article] [PubMed] [Google Scholar]
- Flanagan et al. 2006.Flanagan JR, Bowman MC, Johansson RS. Control strategies in object manipulation tasks. Curr Opin Neurobiol 16: 650–659, 2006. [DOI] [PubMed] [Google Scholar]
- Flanagan et al. 1999.Flanagan JR, Burstedt MK, Johansson RS. Control of fingertip forces in multidigit manipulation. J Neurophysiol 81: 1706–1717, 1999. [DOI] [PubMed] [Google Scholar]
- Flanagan et al. 1993.Flanagan JR, Tresilian J, Wing AM. Coupling of grip force and load force during arm movements with grasped objects. Neurosci Lett 152: 53–56, 1993. [DOI] [PubMed] [Google Scholar]
- Gordon et al. 1991.Gordon AM, Forssberg H, Johansson RS, Westling G. Visual size cues in the programming of manipulative forces during precision grip. Exp Brain Res 83: 477–482, 1991. [DOI] [PubMed] [Google Scholar]
- Gysin et al. 2003.Gysin P, Kaminski TR, Gordon AM. Coordination of fingertip forces in object transport during locomotion. Exp Brain Res 149: 371–379, 2003. [DOI] [PubMed] [Google Scholar]
- Gysin et al. 2008.Gysin P, Kaminski TR, Hass CJ, Grobet CE, Gordon AM. Effects of gait variations on grip force coordination during object transport. J Neurophysiol 100: 2477–2485, 2008. [DOI] [PubMed] [Google Scholar]
- Herrmann and Flanders 1998.Herrmann U, Flanders M. Directional tuning of single motor units. J Neurosci 18: 8402–8416, 1998. [DOI] [PMC free article] [PubMed] [Google Scholar]
- Jenmalm et al. 1998.Jenmalm P, Goodwin AW, Johansson RS. Control of grasp stability when humans lift objects with different surface curvatures. J Neurophysiol 79: 1643–1652, 1998. [DOI] [PubMed] [Google Scholar]
- Johansson and Cole 1994.Johansson RS, Cole KJ. Grasp stability during manipulative actions. Can J Physiol Pharmacol 72: 511–524, 1994. [DOI] [PubMed] [Google Scholar]
- Johansson and Westling 1984.Johansson RS, Westling G. Roles of glabrous skin receptors and sensorimotor memory in automatic control of precision grip when lifting rougher or more slippery objects. Exp Brain Res 56: 550–564, 1984. [DOI] [PubMed] [Google Scholar]
- Johansson and Westling 1987.Johansson RS, Westling G. Signals in tactile afferents from the fingers eliciting adaptive motor responses during precision grip. Exp Brain Res 66: 141–154, 1987. [DOI] [PubMed] [Google Scholar]
- Johansson and Westling 1988.Johansson RS, Westling G. Coordinated isometric muscle commands adequately and erroneously programmed for the weight during lifting task with precision grip. Exp Brain Res 71: 59–71, 1988. [DOI] [PubMed] [Google Scholar]
- Kawato 1999.Kawato M Internal models for motor control and trajectory planning. Curr Opin Neurobiol 9: 718–727, 1999. [DOI] [PubMed] [Google Scholar]
- Klein Breteler et al. 2007.Klein Breteler MD, Simura KJ, Flanders M. Timing of muscle activation in a hand movement sequence. Cereb Cortex 17: 803–815, 2007. [DOI] [PubMed] [Google Scholar]
- Rearick and Santello 2002.Rearick MP, Santello M. Force synergies for multifingered grasping: effect of predictability in object center of mass and handedness. Exp Brain Res 144: 38–49, 2002. [DOI] [PubMed] [Google Scholar]
- Reilmann et al. 2001.Reilmann R, Gordon AM, Henningsen H. Initiation and development of fingertip forces during whole-hand grasping. Exp Brain Res 140: 443–452, 2001. [DOI] [PubMed] [Google Scholar]
- Schieber and Santello 2004.Schieber MH, Santello M. Hand function: peripheral and central constraints on performance. J Appl Physiol 96: 2293–2300, 2004. [DOI] [PubMed] [Google Scholar]
- Valero-Cuevas et al. 2003.Valero-Cuevas FJ, Smaby N, Venkadesan M, Peterson M, Wright T. The strength-dexterity test as a measure of dynamic pinch performance. J Biomech 36: 265–270, 2003. [DOI] [PubMed] [Google Scholar]
- Venkadesan et al. 2007.Venkadesan M, Guckenheimer J, Valero-Cuevas FJ. Manipulating the edge of instability. J Biomech 40: 1653–1661, 2007. [DOI] [PMC free article] [PubMed] [Google Scholar]
- Weiss and Flanders 2004.Weiss EJ, Flanders M. Muscular and postural synergies of the human hand. J Neurophysiol 92: 523–535, 2004. [DOI] [PubMed] [Google Scholar]
- Westling and Johansson 1984.Westling G, Johansson RS. Factors influencing the force control during precision grip. Exp Brain Res 53: 277–284, 1984. [DOI] [PubMed] [Google Scholar]
- Westling and Johansson 1987.Westling G, Johansson RS. Responses in glabrous skin mechanoreceptors during precision grip in humans. Exp Brain Res 66: 128–140, 1987. [DOI] [PubMed] [Google Scholar]
- Winges et al. 2008.Winges SA, Eonta SE, Soechting JF, Flanders M. Multi-digit control of contact forces during rotation of a handheld object. J Neurophysiol 99: 1846–1856, 2008. [DOI] [PubMed] [Google Scholar]
- Winges et al. 2007.Winges SA, Soechting JF, Flanders M. Multidigit control of contact forces during transport of handheld objects. J Neurophysiol 98: 851–860, 2007. [DOI] [PubMed] [Google Scholar]
- Yoshikawa and Nagai 1990.Yoshikawa T, Nagai K. Analysis of multi-fingered grasping and manipulation. In: Dexterous Robot Hands, edited by Venkataraman S, Iberall T. Berlin: Springer-Verlag, 1990, p. 187–208.
- Yoshikawa and Nagai 1991.Yoshikawa T, Nagai K. Manipulating and grasping forces in manipulation by multifingered robot hands. IEEE Trans Robot Autom 7: 67–77, 1991. [Google Scholar]
- Zatsiorsky et al. 2005.Zatsiorsky VM, Gao F, Latash ML. Motor control goes beyond physics: differential effects of gravity and inertia on finger forces during manipulation of handheld objects. Exp Brain Res 162: 300–308, 2005. [DOI] [PMC free article] [PubMed] [Google Scholar]
- Zatsiorsky and Latash 2004.Zatsiorsky VM, Latash ML. Prehension synergies. Exerc Sport Sci Rev 32: 75–80, 2004. [DOI] [PMC free article] [PubMed] [Google Scholar]
- Zatsiorsky et al. 2000.Zatsiorsky VM, Li ZM, Latash ML. Enslaving effects in multi-finger force production. Exp Brain Res 131: 187–195, 2000. [DOI] [PubMed] [Google Scholar]


