

Abstract
The mammalian CNS relies on a constant supply of external glucose for its undisturbed operation. However, neurons can readily switch to using fatty acids and ketones as alternative fuels. Here, we show that oleic acid (OA) excites pro-opiomelanocortin (POMC) neurons by inhibition of ATP-activated potassium (KATP) channels. The involvement of KATP channels is further supported by experiments in SUR1 KO animals. Inhibition of β-oxidation using carnitine palmitoyltransferase-1 inhibitors blocks OA-induced depolarization. The depolarizing effect of OA is specific because it is not mimicked by octanoic acid. Furthermore, OA does not regulate the excitability of agouti-related peptide neurons. High-fat feeding alters POMC neuron excitability, but not its response to OA. Thus β-oxidation in POMC neurons may mediate the appetite-suppressing (anorexigenic) effects of OA.
INTRODUCTION
The hypothalamus is the primary locus for integration of signals that influence energy balance. Among the hypothalamic nuclei, the arcuate nucleus (ARC) of the hypothalamus is considered to play a key integrative role between the initial afferent signals from the periphery and CNS responses (Flier 2004; Schwartz and Porte Jr 2005; Schwartz et al. 2000). Anorexigenic pro-opiomelanocortin (POMC) neurons of the ARC respond to circulating signals—such as glucose, leptin, insulin, ghrelin, and peptide YY (Acuna-Goycolea and van den Pol 2005; Cowley et al. 2001; Schwartz and Porte Jr 2005; Schwartz et al. 2000; Spanswick et al. 1997, 2000; Wang et al. 2004)—and contribute to the regulation of energy expenditure by releasing the anorexigenic melanocyte-stimulating hormones (α-MSH and γ-MSH), products of POMC that activate centrally expressed melanocortin-3 (MC3R) and melanocortin-4 receptors (MC4Rs) (Mountjoy and Wong 1997).
Fatty acid metabolism within the hypothalamus functions as a sensor of nutrient availability (for review, see Lam et al. 2005b). Long chain fatty acids (LCFAs), including oleic acid (OA, C18:1), act as nutrient abundance signals in the hypothalamus (Lam et al. 2005b; Lopez et al. 2005). Administration of LCFAs into the hypothalamus decreases agouti-related peptide (AgRP) and neuropeptide Y (NPY) mRNA expression and inhibits food intake as well as endogenous glucose production in the rat (Morgan et al. 2004; Obici et al. 2002). Similarly, central inhibition of carnitine palmitoyltransferase-1 (CPT1a), required for entry of LCFAs into mitochondria for fatty acid β-oxidation, decreases energy intake and glucose production (Obici et al. 2003; Pocai et al. 2006). Of particular interest in this regard is that 3 days of overfeeding abolishes the metabolic and anorexigenic effects of the central administration of LCFAs in rodents (Morgan et al. 2004). Thus such a defect in nutrient sensing may contribute to the susceptibility to obesity and insulin resistance in response to voluntary overfeeding.
In addition, malonyl-coenzyme A (malonyl-CoA) in the CNS plays an essential role in the control of food intake and energy expenditure (for review, see Wolfgang and Lane 2006). Inhibitors of fatty acid synthase (FAS) have been reported to reduce food intake by inducing a buildup of malonyl-CoA (Loftus et al. 2000). Lowering hypothalamic malonyl-CoA concentration by virally mediated overexpression of malonyl-CoA decarboxylase within the hypothalamus leads to increased food intake and weight gain (He et al. 2006; Hu et al. 2005). Furthermore, the brain-specific CPT1c that is a target of malonyl-CoA is expressed in the arcuate nucleus (Dai et al. 2007) and CPT1c KO mice have lower body weight and food intake (Wolfgang et al. 2006). In contrast, overexpression of CPT1c in the hypothalamus prevents excessive body weight gain when fed a high-fat diet (HFD) (Dai et al. 2007).
In this study, we delineated the cellular mechanisms by which oleic acid regulates the excitability of POMC neurons and the control of endogenous glucose production. The regulation of KATP channels in melanocortinergic neurons by acute and long-term treatment with nutrients may contribute to the control of ingestive behavior and substrate utilization.
METHODS
Slice preparation
All mouse care and experimental procedures were approved by the Institutional Animal Care Research Advisory Committee of the Albert Einstein College of medicine. We used POMC-CRE Z/eGFP and AgRP-CRE Z/eGFP mice, wherein the POMC-CRE and AgRP-CRE transgenes cause cell-specific recombination to induce expression of eGFP from the β-actin promoter (Figs. 1A and 5C; Balthasar et al. 2004; van de Wall et al. 2008). Transverse brain slices were prepared from FVB male and female mice at postnatal age 21–28 days. Animals were anesthetized with a mixture of ketamine and xylazine. After decapitation, the brain was transferred into a sucrose-based solution, bubbled with 95% O2-5% CO2, and maintained at about 3°C. This solution contained (in mM): sucrose 248, KCl 2, MgCl2 1, KH2PO4 1.25, NaHCO3 26, sodium pyruvate 1, and glucose 10. Transverse coronal brain slices (200 μm) were prepared using a vibratome. Slices were equilibrated with an oxygenated artificial cerebrospinal fluid (aCSF) for >1 h at 32°C prior to transfer to the recording chamber. The slices were continuously superfused with aCSF at a rate of 2 ml/min containing (in mM): NaCl 113, KCl 3, NaH2PO4 1, NaHCO3 26, CaCl2 2.5, MgCl2 1, and glucose 5 or 2.5 in 95% O2-5% CO2 at 30 ± 2°C. Osmolarity was adjusted with sucrose.
FIG. 1.

Pro-opiomelanocortin (POMC) neurons express adenosine 5′-triphosphate (ATP)–activated potassium (KATP) channels. A: identification of POMC neurons in acute brain slice. Example of infrared–differential interference contrast (IR-DIC) image, green fluorescent protein (GFP) expression, and fluorescent dye (Alexa 568)–injected neuron. B: electrophysiological profile of POMC neuron. Responses of a POMC neuron to depolarizing/ hyperpolarizing current pulses recorded at the resting membrane potential (Vm) in current-clamp mode. The neuron shown, like most POMC neurons, has moderate spike accommodation in response to direct depolarization. Vm = −43 mV. C: whole cell current-clamp recording of POMC neurons in acute brain slice. On access in whole cell mode (1 mM [ATP]internal), the resting potential was −50 mV. Within <1 min, Vm slowly hyperpolarized, reaching a maximum Vm of −71 mV after about 5 min. During this period, excitability dramatically declined. Bottom: POMC neuron activity on an expanded timescale. D: representative recording sample of the effect of the KATP channel blocker. Treatment with glibenclamide (20 nM) induced action potential (AP) discharge of POMC neuron (top). Bottom: neuronal activity on an expanded timescale. Vm = −47 mV. E: sample recording of Vm of POMC neurons in the presence of 5 mM [ATP]internal. Vm was stable at −45 mV without any further membrane hyperpolarization and POMC neurons show spontaneous APs. Bottom: neuronal activity on an expanded timescale. F1 and F2: current–voltage (I–V) relationship of the tolbutamide-sensitive run-up current (Irun-up). F1 shows the whole cell membrane currents in response to ramping the Vm from −156 to −66 mV (ramp 90 mV/2 s) following Irun-up and after subsequent application of the KATP channel blocker tolbutamide (200 μM). Tolbutamide completely inhibited Irun-up. F2 represents the I–V relationship of the tolbutamide-sensitive current.
FIG. 5.

The depolarizing effect of OA is specific. A: sample recording of membrane potential of POMC neuron before, during, and after application of octanoic acid (C8; 50 μM). In contrast to the effect of OA (C18:1), octanoic acid (OC) did not depolarize POMC neurons in the same experimental conditions. Vm = −47 mV. B: population data for membrane potential with OC at 50 and 100 μM (OC: 50 μM: control: −61.6 ± 2 mV vs. plus OC: −61.5 ± 2 mV; n = 11; 100 μM: control: −61 ± 2.5 vs. −61.6 ± 2 mV; n = 14). C: identification of agouti-related peptide (AgRP) neurons in acute brain slice. Example of IR-DIC image and GFP expression. D: sample recording of membrane potential of AgRP neuron before, during, and after application of OA (50 μM). OA was without effect in the presence of CAPS. Vm = −48 mV. The vehicle control for OA perfusion was 0.1% EtOH.
Electrophysiological recordings
Brain slices were placed on the stage of an upright, infrared–differential interference contrast (IR-DIC) microscope (Olympus BX50WI) mounted on a Gibraltar X-Y table (Burleigh). Green fluorescent protein (GFP)–positive neurons were visualized with a ×40 water-immersion objective using epifluorescence imaging and patched under IR-DIC optics. Membrane currents and potentials were recorded with an Axopatch 200B patch-clamp amplifier or a Multiclamp 700B in whole cell configuration. Electrophysiological signals were low-pass filtered at 2–5 kHz, stored on a PC, and analyzed off-line with pCLAMP 10 software (Molecular Devices, Sunnyvale, CA). In whole cell voltage-clamp mode, series resistance was not compensated. The access resistance of POMC cells was typically 10–15 MΩ and the cell capacitance was typically 10–18 pF. Because current amplitude did not exceed 300 pA, an access resistance of 15 MΩ resulted in a voltage error of <4.5 mV. Access resistance was checked repeatedly during the experiments and recordings showing an increase of >20% were rejected. Whole cell patch-clamp recordings were made from >300 POMC-eGFP neurons in mouse brain slice preparations in 5 mM glucose, except as noted (Fig. 1, A and B).
The spike rate of POMC neurons was also recorded using cell-attached patch-clamp technique in voltage-clamp mode (Perkins 2006). The recording pipette was voltage-clamped at 0 mV. For amphotericin-based perforated-patch recording, the amphotericin B stock solution (30 mg/ml) was prepared in dimethylsulfoxide just before the recording session. The pipette was first filled at the tip with an internal solution containing (in mM): KCl 150 and HEPES 10 (pH 7.3) and subsequently back-filled with the same solution containing amphotericin B (150 μg/ml). Cell-attached and perforated recordings were also performed in the presence of glutamate, γ-aminobutyric acid type A (GABAA), and glycine receptor blockers. Patch electrodes were pulled from thin-walled glass capillaries (WPI) using a temperature-controlled vertical puller (HEKA PIP5). Pipette resistance ranged from 2.5 to 4 MΩ.
The liquid junction potential between the electrode solution and the bath solution was compensated using the pipette offset control and the liquid junction potential between the cytosol and the pipette solution was calculated using the Henderson equation (Barry and Lynch 1991). The calculated liquid junction potential was about +16 mV. The reversal potential (Erev) of the run-up current (Irun-up) was measured by ramping the membrane potential (Vm) from −156 to −66 mV for 2 s in voltage-clamp configuration. Membrane currents were also evoked between −146 and −66 mV (10-mV step for 500 ms) from a holding potential of −86 mV. The net Irun-up was obtained by subtracting the baseline current from the Irun-up.
6-Cyano-7-nitroquinoxaline-2,3-dione (CNQX, 10 μM), d-amino-phosphonovaleric acid (d-AP-5, 50 μM), picrotoxin (100 μM), and strychnine (1 μM) (Sigma–Aldrich) were continuously present in aCSF except as noted. The internal solution contained (in mM): K-acetate, 115; KCl, 10; MgCl2, 2; EGTA, 10; HEPES, 10; Na2ATP, 1 or 5; and Na2GTP, 0.5. For cell-attached recordings, the internal solution contained (in mM): NaCl, 140; KCl, 3.5; CaCl2, 2.5; MgCl2, 1; HEPES, 10; and glucose, 2.5. Throughout our electrophysiological experiments, we used a free form of OA without a carrier. Oleic acid and octanoic acid (Sigma–Aldrich) were prepared in 100% ethyl alcohol (EtOH) as 1,000× concentrated stock solution and dissolved at a final concentration in extracellular solution just before the recording session. After a stable baseline was established after several minutes of recordings, fatty acids were applied by bath perfusion for 5 min at a rate of 2 ml/min.
To examine whether the responses to OA are regulated by dietary history, two groups of animals were fed a standard diet (with 60% calories provided by carbohydrates, 20% by protein, and 5% by fat) or HFD (with 20% calories by carbohydrate, 20% by protein, and 60% by fat; D12492; Research Diets, New Brunswick, NJ) for 2 wk starting from postnatal age 14 days. We kept mice pups together with their dams until week 3 after birth. The pups were weaned onto HFD and provided HFD until sacrifice (a minimum of 14 days).
Statistics
Statistical analyses were performed on all POMC neurons examined using the paired t-test and one-way ANOVA followed by a Bonferroni post hoc procedure for between-group comparison in some experiments in which there were more than two variables. The mean values were reported from the entire population tested (Origin 7.0; OriginLab, Northampton, MA). Current–voltage (I–V) plots were compared by Student's t-test. Data were considered significantly different when the P value was <0.05. All statistical results are given as means ± SE.
RESULTS
POMC neurons express KATP channels
To examine the potential electrophysiological impact of fatty acid signaling in POMC neurons per se, we first examined the electrical characteristics of GFP-tagged POMC neurons in current-clamp configuration. We used 1 mM [ATP]internal throughout our experiments, except as noted, because prior study showed that the resting concentration of cytosolic ATP in hypothalamic neurons was about 1 mM when monitored using genetically targeted luciferases (Ainscow et al. 2002). Immediately after breaking through to the whole cell recording configuration under these conditions, POMC neurons showed spontaneous discharge of action potentials (APs) when no current was delivered through the recording pipette (Fig. 1C). The average resting membrane potential of POMC neurons was −47 ± 1 mV (n = 21 neurons). As cell dialysis proceeded, about 70% of the neurons examined slowly hyperpolarized over a period of 5–10 min, reaching a maximum resting membrane potential of −66 ± 2 mV (n = 21 neurons).
Because prior studies have demonstrated the expression of KATP channels in POMC neurons (Dunn-Meynell et al. 1998; Ibrahim et al. 2003; Plum et al. 2006), we investigated whether the membrane hyperpolarization was associated with activation of KATP channels in POMC neurons. Treatment with the KATP channel blocker glibenclamide (20 nM) reversed the membrane hyperpolarization and elicited APs (Fig. 1D; n = 6 neurons). Because the gating of KATP channels is mainly regulated by the ratio of ATP/ADP in the cell (Ashcroft and Gribble 1998), we thus raised [ATP]internal from 1 to 5 mM, given that a previous study showed that relatively high levels of ATP (>5 mM) inhibited KATP channels composed of SUR1 and Kir 6.2 subunits (Allen and Brown 2004). We found that raising [ATP]internal induced no initial membrane hyperpolarization (Fig. 1E) and shifted the mean resting membrane potential from −65 ± 1.5 to −47 ± 1 mV (1 mM ATP; n = 22 neurons; 5 mM ATP; n = 10 neurons).
To further characterize the nature of the membrane hyperpolarization, we measured the Erev by changing the membrane potential from −156 to −66 mV for 2 s in voltage-clamp configuration. Figure 1F represents a typical example of the whole cell membrane current in response to ramping the membrane potential following full current run-up (Irun-up) and subsequent application of the KATP channel blocker tolbutamide (200 μM). Irun-up was observed in about 60% of the neurons examined (n = 22 of 38 neurons). The I–V relationship revealed that the tolbutamide-sensitive current between −156 and −66 mV exhibited no outward rectification and that the reversal potential of the tolbutamide-sensitive current in 3 mM [K+]external was −92.3 ± 3.8 mV, a value close to the calculated K+ equilibrium potential (n = 4; Fig. 1F2). Our data are consistent with prior studies showing the expression of KATP channel, composed of the SUR1 (ABCC8) and Kir6.2 (KCNJ11) in POMC neurons (Dunn-Meynell et al. 1998; Ibrahim et al. 2003; Plum et al. 2006).
Oleic acid directly excites POMC neurons and regulates endogenous glucose production
We then examined the direct action of OA on POMC neurons by measuring membrane potential in current-clamp mode. Treatment with oleic acid (OA, 50 μM) depolarized and increased the firing rate of POMC neurons in about 60% of the neurons tested (control: −63 ± 3 mV; plus OA: −57 ± 4; n = 8 neurons; P = 0.016), consistent with a recent report showing OA-induced excitation in a subpopulation of the neurons in the arcuate nucleus (Wang et al. 2006). The onset of OA action varied from 2 to 10 min. The enhanced electrical activity was not reversible following washout (>30 min).
We next eliminated presynaptic influences by adding a cocktail of glutamate, GABAA, and glycine receptor blockers and determined whether OA directly altered the intrinsic electrical properties of POMC neurons. Under these experimental conditions, OA (50 μM) depolarized and induced AP discharge in around 40% of the neurons tested (Fig. 2, A and B; resting potential [Vm]: control: −65 ± 1 mV, plus OA: −61 ± 1 mV; n = 32 neurons; P = 0.01). The depolarization of POMC neurons was OA concentration dependent (Fig. 2C).
FIG. 2.

Oleic acid (OA) induces an increase in POMC neuron excitability. A and B: OA-induced excitation of POMC neurons. A shows an example of the whole cell membrane potential before, during, and after treatment with OA after having blocked synaptic transmission. OA depolarized and induced AP discharge of POMC neurons in the presence of CNQX, d-AP-5, picrotoxin, and strychnine (CAPS). Vm = −52 mV. B: pooled data of membrane potential with or without OA (open bars: without CAPS; filled bars: with CAPS). C: OA causes a concentration-dependent depolarization of POMC cells. Depolarization by OA was determined at 1, 5, 20, and 50 μM in 5, 9, 11, and 32 cells, respectively. D and E, top: sample membrane currents in response to voltage steps (from −146 to −66 mV; 10-mV step for 500 ms), with and without OA, at a holding potential of −86 mV (top). Bottom: the I–V curve shows the OA-sensitive component of current over this range of membrane potentials. E: the I–V curve shows that OA significantly reduced the amplitude of the Irun-up over this range of membrane potentials (n = 5; from −146 to −66 mV: P = 0.027, 0.026, 0.024, 0.044, 0.026, 0.004, 0.17, 0.16, 0.015). The vehicle control for OA perfusion was 0.1% ethyl alcohol (EtOH). F: representative whole cell recording sample of the electrophysiological effects of OA in the presence of guanosine-5′-O-2-thiodiphosphate (GDP-β-S, 2 mM). Under these experimental conditions, POMC neurons responded to OA. Vm = −47 mV.
Direct modulation of POMC neuron excitability was supported further by experiments in which we examined OA action on membrane currents evoked by voltage steps in voltage-clamp configuration (also see Supplemental Fig).1 Figure 2D shows membrane currents evoked between −146 and −66 mV (10-mV increase in voltage step) from a holding potential of −86 mV following current run-up and subsequent application of OA. Oleic acid significantly decreased the amplitude of the run-up current (Irun-up) over this range of membrane potentials (mean inhibition: 27 ± 5% at −130 mV; n = 5; Fig. 2E).
Depolarizing effect of OA occurs independently of G-protein signaling
An orphan G-protein–coupled receptor, GPR40, has been shown to be activated by both medium- and long-chain fatty acids and its activation regulates insulin secretion in pancreatic cells (Briscoe et al. 2003; Itoh and Hinuma 2005; Itoh et al. 2003). Because hypothalamic neurons express GPR40, we examined whether the depolarizing effect of OA is due to GPR40 activation (Briscoe et al. 2003). We intracellularly applied guanosine-5′-O-2-thiodiphosphate (GDP-β-S, 1 and 2 mM; n = 4 and 8 neurons, respectively) into the cell because inclusion of a nonhydrolyzable form of GDP through patch pipette prevents G-protein–mediated modulation of ion channels. Under such experimental conditions, POMC neurons still responded to OA with a depolarization (control: −60 ± 3 mV, plus OA: −55 ± 3; n = 12 neurons; P = 0.04; Fig. 2F), consistent with the fact that this depolarization occurs independently of G-protein signaling.
Oleic acid inhibits KATP channels
Based on the expression of KATP channels in POMC neurons and the inhibition of Irun-up following treatment with OA, we sought to determine whether OA inhibits KATP channels, thus increasing the excitability of POMC neurons. We tested a KATP channel opener (i.e., diazoxide) rather than KATP channel blockers on the response of POMC neurons to OA because both OA and glibenclamide depolarized POMC neurons in our preparations. As shown in Fig. 3, diazoxide (200 μM) either reversed or completely blocked OA-induced depolarization (n = 7 neurons), indicating that OA depolarizes POMC neurons by closure of KATP channels. To further determine the contribution of KATP channels, we investigated whether high levels of internal ATP restrain the excitatory effect of OA. Under the experimental conditions in which [ATP] is 5 mM, OA (50 μM) no longer depolarized POMC neurons (Fig. 3, C and D; control: −50 ± 2 mV; OA: −49 ± 2 mV; n = 8).
FIG. 3.

Oleic acid inhibits KATP channels in POMC neurons. A and B: an example of the membrane potential before, during, and after treatment with OA and OA + diazoxide. Application of diazoxide (200 μM) reversed the depolarizing effect of OA (A). Vm = −48 mV. B: pre-exposure to diazoxide induced no depolarization following application of OA. Vm = −45 mV. C and D: OA no longer induced an increase in the firing rate of POMC neurons in the presence of 5 mM [ATP]internal (top). Bottom: neuronal activity on an expanded timescale. Vm = −47 mV. D: pooled data of the firing rate of POMC neurons before and after treatment with OA at 1 and 5 mM [ATP]internal. OA did not significantly change the mean firing rate of POMC neurons at 5 mM [ATP]internal (1 mM ATP: control: 0 Hz; OA: 2.1 ± 0.5 Hz; n = 9; 5 mM ATP: control: 3.1 ± 1 Hz; OA: 2.5 ± 0.7 Hz; n = 6 neurons: P = 0.34). E: AP discharge of POMC neuron in sulfonylurea receptor 1 subunit knockout (SUR1 KO) animals. POMC neurons did not show initial membrane hyperpolarization (Vm = −49 mV; left). OA did not excite POMC neurons in SUR1 KO animals. Right: sample recording on an expanded timescale. F: schematic diagram of proposed OA metabolism in POMC neurons (CPT1: carnitine palmitoyltransferase-1). Long chain fatty acids (LCFAs) require CPT1 for mitochondrial β-oxidation. G and H: β-oxidation of OA excites POMC neurons. G: example recording of membrane potential before, during, and after treatment with malonyl-CoA (MA; 20 μM) and MA + OA. MA alone did not change the membrane potential, but completely inhibited the depolarizing effect of OA. Vm = −46 mV. Likewise, prior exposure to ST1326 (ST; 100 nM) blocked OA action (H). Vm = −55 mV. I: pooled data of membrane potential with CPT1 inhibitor alone and CPT1 inhibitor + OA (MA: −63 ± 3 mV vs. MA + OA: −65 ± 3 mV; n = 8; P = 0.27; ST: −58 ± 3 mV vs. ST + OA: −60 ± 4 mV; n = 7; P = 0.06). The vehicle control for OA perfusion was 0.1% EtOH.
The contribution of KATP channels was supported further by experiments using sulfonylurea receptor 1 (SUR1) subunit knockout (KO) mice (Seghers et al. 2000). SUR1 is a regulatory subunit in KATP channels and endows the channel with sensitivity to drugs such as sulfonylureas and KATP channel openers. We combined the SUR1 KO allele with the POMC-eGFP transgenes to identify POMC neurons in SUR1 knockouts and then determined whether OA-induced depolarization is due to inhibition of KATP channel. Such experiments revealed that POMC neurons in SUR1 KO animals showed spontaneous AP discharge without membrane hyperpolarization over the recording period (Fig. 3E; Vm = 47 ± 2 mV; n = 7). Importantly, treatment with OA (50 μM) no longer depolarized nor increased the firing rate of POMC neurons (Fig. 3E; mean change in membrane potential: 0.6 ± 1 mV; n = 6; firing rate: control: 9.2 ± 3 Hz; OA: 10.8 ± 4 Hz; n = 6), consistent with the involvement of KATP channels in OA-induced depolarization of POMC neurons.
Prior studies have demonstrated that LCFA and LCFA-CoA open, rather than close, KATP channels (Gribble et al. 1998; Larsson et al. 1996). Thus we directly introduced oleoyl-CoA (20 nM to 1 μM) into POMC neurons via patch pipette, anticipating a membrane hyperpolarization in POMC neurons. Contrary to our expectation, none of the cells tested was hyperpolarized by injection of oleoyl-CoA (n = 12). Instead, such manipulations shifted the resting membrane potential from −47 ± 1 to −40 ± 2 mV (n = 12 neurons; P = 0.0006; data not shown). These results are consistent with the fact that intracellular LCFA-CoA per se does not directly activate KATP channels in POMC neurons.
β-Oxidation of OA regulates POMC neuron excitability
Mitochondrial metabolism of LCFAs leads to an increase in [ATP] in the cell (Fig. 3F). Elevated intracellular [ATP] following β-oxidation in the cell would result in closure of KATP channels and consequent membrane depolarization. We thus evaluated this possibility by inhibition of CPT1. We used both an endogenous inhibitor of CPT1 (i.e., malonyl-CoA, 20 μM; for review, see Dowell et al. 2005) and an exogenous synthetic inhibitor of CPT1a (i.e., ST1326, 100 nM; Obici et al. 2003; Pocai et al. 2006). Pre-treatment with malonyl-CoA (20 μM) alone did not change membrane potential of POMC neurons (Fig. 3G). Following treatment with malonyl-CoA for 5 min, OA no longer excited POMC neurons (Fig. 3, G and I; 20 μM: malonyl-CoA: −63 ± 3 mV; malonyl-CoA + OA: −65 ± 3 mV; n = 8). Likewise, pre-exposure to the CPT1a inhibitor ST1326 (100 nM) completely blocked OA-induced depolarization without any changes in membrane potential of POMC neurons (Fig. 3, H and I; ST1326: −58 ± 3 mV; ST1326 + OA: −60 ± 4 mV; n = 7 neurons).
Oleic acid excites intact POMC neurons
We further examined the effect of OA under more physiological conditions, in which the intracellular environment remains intact by performing cell-attached recordings. Figure 4 shows cell-firing activity in cell-attached voltage-clamp mode (Perkins 2006). Under these experimental conditions, OA significantly increased the spike rate of POMC neurons as observed in whole cell recordings (control: 1.4 ± 0.3 Hz, OA: 1.7 ± 0.4 Hz; n = 13 neurons; P = 0.01; Fig. 4A). Interestingly, we found that the percentage of the POMC neurons that respond to OA is similar to that observed in whole cell patch-clamp recordings (i.e., cell-attached vs. whole cell: 44 vs. 38%). We next investigated the effect of the CPT1 inhibitor on OA-induced depolarization. Treatment with malonyl-Co-A alone reduced, but not significantly, the spike rate of POMC neurons from 1.3 ± 0.3 to 0.9 ± 0.3 Hz (n = 13; Fig. 4B). Following treatment with malonyl-CoA, addition of OA no longer changed the firing rate of POMC neurons (MA alone: 0.9 ± 0.3 Hz vs. MA + OA: 0.8 ± 0.3 Hz; n = 13; P = 0.39; Fig. 4B).
FIG. 4.

Oleic acid excites intact POMC neurons. A1 and A2: cell-attached voltage-clamp recording from POMC neurons with and without OA. Recording pipette is voltage-clamped at 0 mV. OA (50 μM) increased the spike rate of intact POMC neurons (A1). A2: histogram recorded from the neuron shown in A1 shows the time course of spikes before, during, and after application of OA. B1 and B2: sample recording of spikes before, during, and after addition of malonyl-CoA (MA) and MA + OA. Malonyl-CoA (20 μM) alone decreased the spike rate of POMC neurons. In the presence of MA, OA no longer excited POMC neurons (B1). B2 represents the time course of spike frequency recorded from the neuron shown in B1 before, during, and after application of MA alone and MA + OA. C1 and C2: representative cell-attached recording sample of the electrophysiological effects of glucose and OA. Lowering [glucose] from 5 to 2.5 mM decreased the spike rate of POMC neurons in about 60% of the neurons examined (n = 8). Under these experimental conditions, OA increased the frequency of spikes. C2: histogram shows the time course of the frequency of spikes recorded from the neuron shown in C1. D1 and D2: perforated patch-clamp recording sample from POMC neurons with and without OA. Likewise, OA increased the firing rate of POMC neurons. Vm = −49 mV. E1 and E2: representative perforated patch recording sample of APs before, during, and after addition of malonyl-CoA (MA) and MA + OA. OA no longer increased the firing rate following treatment with MA. Vm = −57 mV. The vehicle control for OA perfusion was 0.1% EtOH.
We then lowered the glucose concentration from 5 to 2.5 mM and then tested the effect of OA. Under these conditions, we found that, as described in prior work (Claret et al. 2007; Ibrahim et al. 2003; Parton et al. 2007; van den Top et al. 2007), roughly 60% of the POMC neurons examined are glucose-excited neurons. Lowering the glucose concentration from 5 to 2.5 mM decreased the spike rate of POMC neurons (5 mM: 2.4 ± 0.4 Hz; 2.5 mM: 1.1 ± 0.3 Hz; n = 16 neurons; P = 0.04; Fig. 4C). In the presence of 2.5 mM glucose, OA (50 μM) significantly increased the firing rate (from 1.1 ± 0.3 to 1.53 ± 0.3 Hz; n = 16 neurons; P = 0.04; Fig. 4C). However, it seems that the depolarizing effect of OA is independent of the nature of glucose effect on POMC neurons because OA increased the spike rate of the POMC neurons that are insensitive to glucose as well. Interestingly, the percentage of the POMC neurons responding to OA is higher in 2.5 than that in 5 mM glucose (i.e., 44 vs. 64%).
We also performed perforated-patch recordings to further support that intact POMC neurons are modulated by OA. Oleic acid (50 μM) increased the frequency of AP discharge from 1.4 ± 0.4 to 1.8 ± 0.5 Hz (n = 11 neurons; P = 0.02) and depolarized the membrane potential from −44 ± 3 to −39 ± 2 mV (n = 11 neurons; P = 0.001). The increased frequency was completely abolished by treatment with malonyl-CoA (20 μM; MA: 1.7 ± 0.4 Hz; MA + OA: 1.5 ± 0.4 Hz; n = 9 neurons). Additionally, we noted that malonyl-CoA alone decreased, but not significantly, the frequency of AP discharge (control: 2.6 ± 0.3 Hz; MA: 1.7 ± 0.4 Hz; n = 9 neurons). All the data we collected from cell-attached and perforated-patch recordings thus confirm our data obtained from whole cell recordings and support our hypothesis that elevated ATP concentration produced from OA through mitochondrial β-oxidation inactivates KATP channels, causing membrane depolarization.
Oleic acid action is both cell and substrate specific
To examine whether the depolarizing effect of OA was mimicked by any substrate of oxidation, we tested the effect of a short-chain fatty acid (i.e., octanoic acid: C8). We found that treatment with octanoic acid (50 μM) had no effect on the electrical activity of POMC neurons under the same experimental conditions (i.e., in the presence of a cocktail of glutamate, GABAA, and glycine receptor blockers and 1 mM [ATP]internal: Fig. 5, A and B; Vm: before: −62 ± 4 mV; after: −63 ± 4 mV; n = 11 neurons). The same concentration (i.e., 50 μM) of octanoic acid may provide very different numbers of calories to the POMC neurons. Given that the calories themselves may be an important part of the regulation of nutrient-related neurons, we also tested the effect of a high concentration (i.e., 100 μM) of octanoic acid. Raising octanoic acid concentrations from 50 to 100 μM induced no depolarization in the POMC neurons examined (Fig. 5B; before: −61 ± 2.5 mV; after: −61.6 ± 2 mV; n = 14), consistent with the fact that the depolarizing effect of OA is specific and that CPT1-mediated β-oxidation of OA, but not CPT1-independent β-oxidation of octanoic acid, regulates KATP channels in POMC neurons.
We also investigated whether the OA-induced depolarizing effect is cell specific using transgenic mice that express GFP only in agouti-related peptide (AgRP) neurons in the arcuate nucleus (Xu et al. 2005) (Fig. 5, C and D). We found that, in contrast to the direct effect of OA on POMC neurons, the excitability of AgRP neurons was not altered by treatment with OA (50 μM) under the same experimental conditions (i.e., in the presence of a cocktail of glutamate, GABAA, and glycine receptor blockers and 1 mM [ATP]internal; Fig. 5D; control: Vm = −59.3 ± 5, plus OA: Vm = −58.5 ± 5; n = 8 neurons; P = 0.32).
High-fat feeding alters excitability of POMC neurons
We examined whether the POMC neuronal response to OA is regulated by dietary history. Two groups of mice were fed a standard diet or HFD (with 20% calories provided by carbohydrate, 20% by protein, 60% by fat) for 2 wk. Following 2 wk on the assigned diet regimen, we tested acute electrophysiological responses to OA. Initial experiments revealed that OA induced membrane depolarization in both groups ([ATP]internal: 1 mM; Fig. 6A). The responses to OA thus appear to be the same in both groups.
FIG. 6.

The excitability of POMC neurons is regulated by the levels of nutrients. A: whole cell current-clamp recording of POMC neurons from animals fed a regular chow or a high-fat diet (HFD) in 1 mM [ATP]internal. POMC neurons from 2 groups showed membrane hyperpolarization on access in whole cell mode in 1 mM [ATP]internal. The responses to OA were the same in both groups. Vm = −52 and −50 mV, respectively. B: whole cell current-clamp recording of POMC neurons from animals fed regular chow or HFD in 5 mM [ATP]internal. POMC neurons in a regular diet group showed spontaneous APs (left) without any hyperpolarization. Bottom: POMC neuron activity on the expanded timescale. Vm = −46 mV. Right: under the same experimental conditions, POMC neurons from animals fed HFD showed membrane hyperpolarization. After roughly 5 min in whole cell configuration, no AP discharge was observed. Bottom: POMC neuron activity on the expanded timescale. Vm = −47 mV. C: representative recording sample of the electrophysiological effect of OA in 5 mM [ATP]internal. Treatment with OA (50 μM) was without effect. Vm = −48 mV (left). In contrast, OA depolarized POMC neurons and induced AP discharge (right). Bottom: POMC neuron response to OA on the expanded timescale. Vm = −47 mV. D: population data for the resting membrane potential of POMC neurons from animals fed a regular diet (RD) or HFD in 5 mM [ATP]internal. No difference was observed in the resting membrane potential over a period of 5 min in the RD group, whereas Vm significantly hyperpolarized in POMC neurons from animals fed HFD. E: population data for membrane potential of POMC neurons following treatment with OA in 5 mM [ATP]internal. OA depolarized POMC neurons in the HFD group, but not in the RD group. F: pooled data of the firing rate of POMC neurons following treatment with OA in 5 mM [ATP]internal (RD: control: 3.1 ± 1 Hz, OA: 2.5 ± 0.7 Hz; n = 6; P = 0.34; HFD: control: 0 Hz, HFD: 2.5 ± 1.6 Hz; n = 5 neurons). The vehicle control for OA perfusion was 0.1% EtOH.
However, we found altered excitability of POMC neurons from animals fed HFD under experimental conditions where [ATP]internal was high (i.e., 5 mM). POMC neurons from animals fed a regular diet showed spontaneous discharge of APs over a period of whole cell recording in 5 mM [ATP]internal (Fig. 6B; n = 10 neurons). In contrast, POMC neurons from the HFD group showed membrane hyperpolarization on access in whole cell configuration in 40% of the neurons examined in the presence of 5 mM [ATP]internal (Fig. 6B; n = 19 neurons tested). The mean resting membrane potential was shifted from −48 ± 1 to −55 ± 2 mV (P = 0.003) over a period of 5–10 min (Fig. 6D). Such hyperpolarization at 5 mM [ATP]internal was never observed in neurons from animals fed regular chow. Furthermore, OA (50 μM) depolarized and induced AP discharge of POMC neurons in hypothalamic slices from mice fed HFD (Fig. 6, C–F; control: −61 ± 2 mV, plus OA: −55 ± 2 mV; n = 9 neurons; P = 0.01), whereas POMC neurons from animals fed the regular diet did not increase their rate of AP discharge with OA exposure at the same concentration of ATP (Fig. 6, C–F).
Insulin antagonizes the depolarizing effect of oleic acid
The observed membrane hyperpolarization in the presence of high levels of internal ATP following HFD feeding may be due, at least in part, to altered ATP sensitivity of KATP channel in POMC neurons. In fact, high-fat feeding increases levels of plasma insulin (Morgan et al. 2004; Wang et al. 2001). Interestingly, prior study has shown that insulin, but not leptin, regulates KATP channels in POMC neurons by decreasing their sensitivity to ATP via phosphatidylinositol-3,4,5-triphospate (PIP3) (Plum et al. 2006). Based on these previous studies, our initial experiments tested whether insulin prevents OA-induced depolarization by activation of KATP channels in POMC neurons. Because POMC neurons were silent at 1 mM [ATP]internal (Fig. 1C), we monitored the firing rate of POMC neurons at relatively high levels of internal ATP (see Figs. 3C and 6B) and examined the effect of insulin (100 nM). Figure 7A shows a typical example of insulin action on the firing rate of POMC neurons at 5 mM [ATP]internal. We found that insulin (100 nM) significantly decreased the firing rate of POMC neurons from 4.3 ± 0.5 to 3.1 ± 0.5 Hz (Fig. 7A; n = 9 neurons). We next examined whether insulin antagonizes OA action because insulin hyperpolarized rather than depolarized POMC neurons in our preparations. We found that pre-exposure to insulin (100 nM) completely blocked OA-induced depolarization (Fig. 7B). POMC neurons did not respond to OA following treatment with insulin (Vm: insulin alone: −67 ± 1 mV vs. insulin + OA: −67 ± 1 mV; n = 8).
FIG. 7.
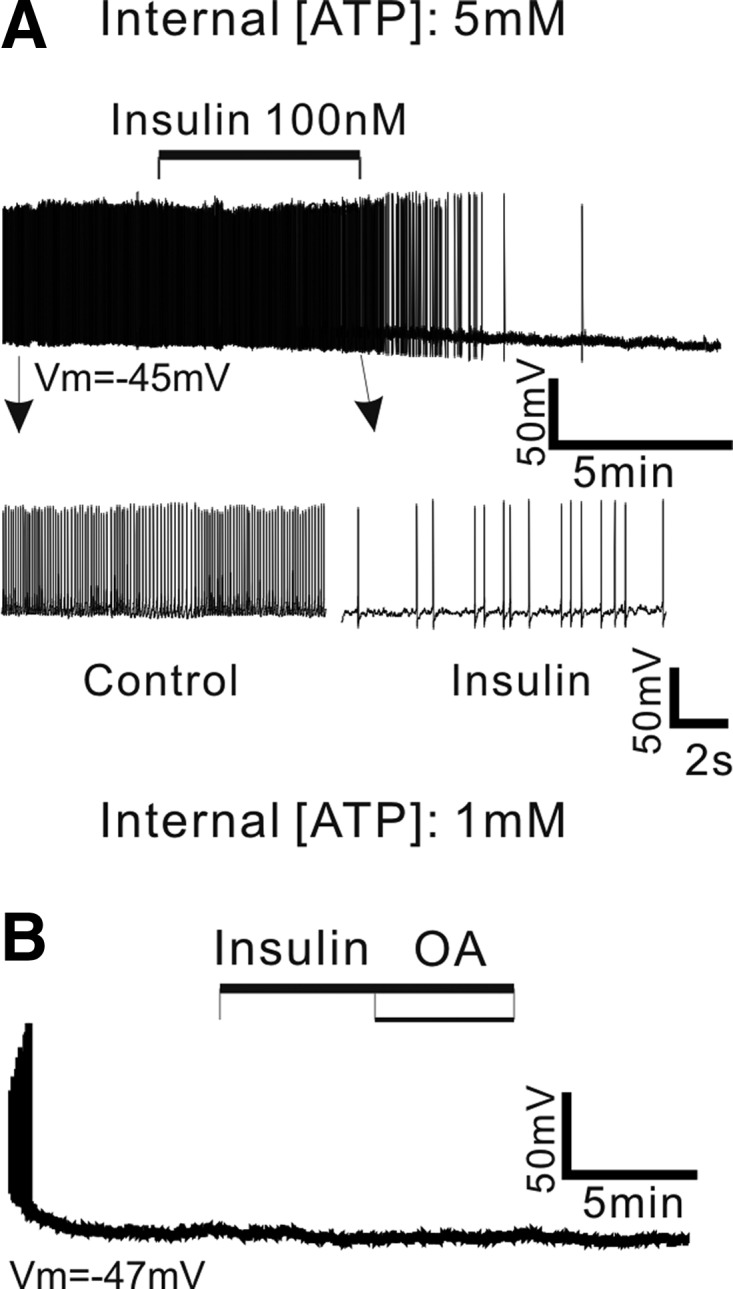
Insulin blocks the depolarizing effect of OA. A: sample recording of membrane potential of POMC neuron before, during, and after application of insulin (100 nM) in the presence of 5 mM [ATP]internal. Treatment with insulin decreased the firing rate of POMC neurons (top). Bottom: POMC neuronal activity on an expanded timescale. Vm = −45 mV. B: representative recording sample of the effect of insulin on OA-induced depolarization. Prior exposure to insulin (100 nM) completely abolished OA action. Vm = −47 mV. The vehicle control for OA perfusion was 0.1% EtOH.
DISCUSSION
Our present work provides direct electrophysiological evidence for cellular mechanisms underlying the anorexigenic effect of oleic acid in several sets of experimental results. First, we demonstrate that OA directly regulates the electrical activity of POMC neurons, enhancing the anorexigenic tone exerted by the melanocortinergic system. Second, we outline the cellular mechanisms underlying the depolarizing effect of OA. Elevated ATP concentration produced from OA through mitochondrial β-oxidation inactivates KATP channels, causing membrane depolarization (see Fig. 8). Studies of identified POMC neurons in SUR1 knockouts support the contribution of KATP channels. Third, we demonstrate that the effect of OA is not mimicked by a short-chain fatty acid. Thus although ATP production via β-oxidation of long-chain fatty acids is necessary for POMC neuronal modulation, other factors including CPT1 also appear to be necessary. Finally, we demonstrate that high-fat feeding alters POMC neuron excitability.
FIG. 8.

Schematic diagram of proposed OA action in POMC neurons. On entry into POMC neurons, OA is rapidly esterified to oleoyl-CoA. The transfer of oleoyl-CoA to the mitochondria requires CPT1 that is located on the outer mitochondrial membrane. This may be controlled by malonyl-CoA, which is largely derived from glycolysis (the formation of malonyl-CoA from acetyl-CoA is catalyzed by acetyl-CoA carboxylase [ACC]). Prior work has indeed demonstrated that glucose metabolism by the CNS increases the level of malonyl-CoA in the hypothalamus (Wolfgang et al. 2007). Elevated β-oxidation raises [ATP] in the cell and subsequently inhibits KATP channels. Inhibition of KATP channels increases POMC neuron excitability. High-fat feeding and associated hyperinsulinemia may lower ATP sensitivity of KATP channels in POMC neurons, causing altered excitability of POMC neurons. The regulation of KATP channels in POMC neurons by nutrient-related signaling molecules is essential for controlling food intake as well as endogenous glucose production.
Recently, Wolfgang et al. (2006) reported that the brain-specific CPT1c KO mice exhibited decreased food intake and body weight, consistent with the involvement of CPT1 in maintaining energy homeostasis. However, it has been shown that CPT1c did not appear to participate directly in fatty acid oxidation (Wolfgang et al. 2008), although CPT1c is an outer mitochondrial integral membrane protein (Dai et al. 2007) and binds malonyl-CoAs like CPT1a (liver isoform) and CPT1b (muscle isoform) (Wolfgang and Lane 2006). Based on these findings, it has been proposed that CPT1c may play a regulatory rather than a direct metabolic role in the CNS (Wolfgang et al. 2008). If this is the case in POMC neurons, the most likely explanation is that CPT1c may be implicated in the control of neuronal activity when oleic acid, but not octanoic acid, is present because the transfer of short-chain fatty acids to mitochondria is independent of CPT1. Interestingly, OA did not alter AgRP neuronal activity, although NPY/AgRP neurons also express KATP channels (Gyte et al. 2007). Although CPT1c is highly expressed in regions of the hypothalamus critical for the regulation of energy balance including the paraventricular nucleus, ventromedial hypothalamus, and the arcuate nucleus (Dai et al. 2007), only a subset of neurons in these nuclei expresses CPT1c and the phenotype of CPT1c-expressing neurons remains to be determined. It is possible that the AgRP neurons did not respond to OA because of the lack of CPT1c. Thus decreased AgRP and NPY mRNA expression by OA (Morgan et al. 2004) appears to be due, at least in part, to indirect effects of OA via OA-sensitive hypothalamic neuronal circuit or to neuronal activity–independent mechanisms.
KATP channels sense the fluctuation of [ATP]internal and can be used to measure the submembrane ATP concentration (Gribble et al. 2000). The gating of KATP channels is mainly regulated by the ratio of ATP/ADP in the cell (Ashcroft and Gribble 1998). The observed inhibition of KATP channel can be interpreted by an increase in [ATP]internal following treatment with OA. We should note that CPT1c does not catalyze acyl transfer from fatty acyl-CoA to carnitine. If POMC neurons express only CPT1c, but not other isoforms of CPT1 (i.e., CPT1a and CPT1b), we do not expect such inhibition of KATP channels. However, the anorexigenic and metabolic effects of OA were abolished by genetic and biochemical inhibition of CPT1a (Obici et al. 2003; Pocai et al. 2006). In addition, the endogenous CTP1 inhibitor malonyl-CoA alone decreased the excitability of POMC neurons in cell-attached configuration, consistent with the idea that there is de novo synthesis of LCFAs in the hypothalamus and that hypothalamic neurons may use fatty acids as an alternative fuel. It should be noted that CPT1c KO mice fed HFD are more susceptible to obesity, suggesting that CPT1c is protective against the effects of HFD on weight gain (Wolfgang et al. 2006). In line with these data, OA was still effective following high-fat feeding in our preparations. In contrast, short-term overfeeding abolishes hypothalamic lipid sensing (Morgan et al. 2004; Pocai et al. 2006). Thus we speculate that, depending on the availability of nutrients, CPT1a and/or CPT1c may control feeding-related neuronal activity. A defect in hypothalamic nutrient sensing by POMC neurons may contribute to the susceptibility to obesity and insulin resistance in response to voluntary overfeeding and excess adipose tissue expression.
Low levels of OA either depolarized or hyperpolarized the arcuate neurons, but only in about 10% of neurons examined (Wang et al. 2006). However, we observed OA action only at concentrations >5 μM and around 40% of neurons examined responded to OA with a membrane depolarization. This discrepancy may be explained, at least in part, by different experimental conditions including external glucose and OA concentrations used. Indeed, Wang et al. (2006) reported that OA regulates the arcuate neurons in a glucose-dependent manner. Importantly, glucose metabolism by the CNS increases the level of malonyl-CoA in the hypothalamus (Wolfgang et al. 2007). In this scenario, the balance between carbohydrates and LCFA concentrations may determine POMC neuronal activity. This may be supported by our findings that the percentage of the POMC neurons responding to OA is higher in 2.5 than that in 5 mM glucose (i.e., 64 vs. 44%). It thus appears that the effect of OA may depend, in part, on the availability of external glucose and that CPT1 in POMC neurons is essential for integrating carbohydrate and lipid signaling. Another difference is the absence of the inhibitory effect of OA. Because OA decreased food intake (Obici et al. 2002), we expected that OA had an inhibitory action on orexigenic AgRP neurons, but this was not the case in our preparations. It is well known that the arcuate neurons are heterogeneous and express diverse neuropeptides and neurotransmitters (Crown et al. 2007). Future studies are needed to determine which types of neurons are modulated and the cellular mechanisms underlying inhibitory versus excitatory actions of OA.
The inhibition of KATP channels by OA in POMC neurons may result in decreased food intake as well as reduced glucose production. Recent work has reported that in POMC cell-restricted PTEN (phosphatidylinositol-3,4,5-triphospate [PIP3] phosphatase) KO mice, POMC neurons showed a marked hyperpolarization associated with increased KATP channel activity, leading to hyperphagia (Plum et al. 2006). Moreover, a recent work of Parton et al. (2007) reported that the POMC neurons expressing mutant Kir6.2 that prevent ATP-mediated closure of KATP channels did not respond to raising the glucose concentration and that this genetic manipulation impaired the whole body response to a systemic glucose load. These prior data thus suggest that KATP channels are critical regulators of POMC neuronal activity and the regulation of food intake.
In our present work, the properties of KATP channels in POMC neurons appear to be altered following high-fat feeding because high levels of internal ATP were not able to inactivate KATP channels, causing membrane hyperpolarization. It has been shown that phosphatidylinositol phosphates control ATP inhibition of KATP channels by attenuating ATP sensitivity (Baukrowitz et al. 1998; Shyng and Nichols 1998). One of the major downstream pathways following activation of the insulin receptor involves the phosphorylation of PIP2 to PIP3 through the activation of PI3K (Backer et al. 1992). Importantly, enhanced PIP3 signaling in POMC neurons activates KATP channels (Plum et al. 2006). Thus one of the most likely explanations is that high-fat feeding and associated hyperinsulinemia reduce ATP sensitivity of KATP channels in POMC neurons. Alternatively, cytoskeletal remodeling may be an important contributor to the cellular signaling mechanisms of high-fat feeding. In fact, insulin's effect on KATP activity in isolated arcuate neurons was inhibited by the PI3K inhibitor as well as by the marine sponge toxin jasplakinolide, which binds to F-actin, resulting in its stabilization and prevention of depolymerization to its monomer G-actin (Mirshamsi et al. 2004). In this scenario, we expect that chronic hyperinsulinemia during high-fat feeding would remodel the cytoskeletal structure, rendering KATP channels less sensitive to ATP. Interestingly, a short-term high-fat diet increased the in vivo activity of CPT1 by a decrease in the levels of malonyl-CoA and the turnover of LCFA-CoAs in the mediobasal hypothalamus (Pocai et al. 2006). As a result, tonically increased levels of ATP via β-oxidation of LCFAs in POMC neurons may also alter the property of KATP channels.
In summary, our present data support the idea that the mitochondrial β-oxidation of oleic acid is a critical step for the regulation of the excitability of POMC neurons. The regulation of KATP channels in POMC neurons by both acute and long-term treatment with nutrients and nutrient-related hormones may contribute to the control of food intake and to maintenance of weight balance.
GRANTS
This work was supported by Skirball Institute for Nutrient Sensing and National Institute of Diabetes and Digestive and Kidney Diseases (NIDDK) Grant DK-057621 to S. Chua and NIDDK/Albert Einstein College of Medicine/Diabetes Research and Training Center Grant P60 DK-020541, an award from the New York Obesity Research Center, and a junior faculty award from the American Diabetes Association to Y.-H. Jo.
Supplementary Material
Acknowledgments
We thank Drs. Lorna Role, Remy Schlichter, Gary Schwartz, and David Talmage for critical comments on the previous version of the manuscript; Dr. Joseph Bryan (Pacific Northwest Research Institute, Seattle, WA) for providing SUR1 KO mice; and S.-M. Liu, B. Liu, and X. Liu for technical support.
Footnotes
The online version of this article contains supplemental data.
REFERENCES
- Acuna-Goycolea and van den Pol 2005.Acuna-Goycolea C, van den Pol AN. Peptide YY(3-36) inhibits both anorexigenic proopiomelanocortin and orexigenic neuropeptide Y neurons: implications for hypothalamic regulation of energy homeostasis. J Neurosci 25: 10510–10519, 2005. [DOI] [PMC free article] [PubMed] [Google Scholar]
- Ainscow et al. 2002.Ainscow EK, Mirshamsi S, Tang T, Ashford ML, Rutter GA. Dynamic imaging of free cytosolic ATP concentration during fuel sensing by rat hypothalamic neurones: evidence for ATP-independent control of ATP-sensitive K(+) channels. J Physiol 544: 429–445, 2002. [DOI] [PMC free article] [PubMed] [Google Scholar]
- Allen and Brown 2004.Allen TG, Brown DA. Modulation of the excitability of cholinergic basal forebrain neurones by KATP channels. J Physiol 554: 353–370, 2004. [DOI] [PMC free article] [PubMed] [Google Scholar]
- Ashcroft and Gribble 1998.Ashcroft FM, Gribble FM. Correlating structure and function in ATP-sensitive K+ channels. Trends Neurosci 21: 288–294, 1998. [DOI] [PubMed] [Google Scholar]
- Backer et al. 1992.Backer JM, Myers MG Jr, Shoelson SE, Chin DJ, Sun X-J, Miralpeix M, Hu P, Margolis B, Skolnik EY, Schlessinger J, White MF. Phosphatidylinositol 3′-kinase is activated by association with IRS-1 during insulin stimulation. EMBO J 11: 3469–3479, 1992. [DOI] [PMC free article] [PubMed] [Google Scholar]
- Balthasar et al. 2004.Balthasar N, Coppari R, McMinn J, Liu SM, Lee CE, Tang V, Kenny CD, McGovern RA, Chua SC Jr, Elmquist JK, Lowell BB. Leptin receptor signaling in POMC neurons is required for normal body weight homeostasis. Neuron 42: 983–991, 2004. [DOI] [PubMed] [Google Scholar]
- Barry and Lynch 1991.Barry PH, Lynch JW. Liquid junction potentials and small cell effects in patch-clamp analysis. J Membr Biol 121: 101–117, 1991. [DOI] [PubMed] [Google Scholar]
- Baukrowitz et al. 1998.Baukrowitz T, Schulte U, Oliver D, Herlitze S, Krauter T, Tucker SJ, Ruppersberg JP, Fakler B. PIP2 and PIP as determinants for ATP inhibition of KATP channels. Science 282: 1141–1144, 1998. [DOI] [PubMed] [Google Scholar]
- Briscoe et al. 2003.Briscoe CP, Tadayyon M, Andrews JL, Benson WG, Chambers JK, Eilert MM, Ellis C, Elshourbagy NA, Goetz AS, Minnick DT, Murdock PR, Sauls HR Jr, Shabon U, Spinage LD, Strum JC, Szekeres PG, Tan KB, Way JM, Ignar DM, Wilson S, Muir AI. The orphan G protein-coupled receptor GPR40 is activated by medium and long chain fatty acids. J Biol Chem 278: 11303–11311, 2003. [DOI] [PubMed] [Google Scholar]
- Claret et al. 2007.Claret M, Smith MA, Batterham RL, Selman C, Choudhury AI, Fryer LG, Clements M, Al-Qassab H, Heffron H, Xu AW, Speakman JR, Barsh GS, Viollet B, Vaulont S, Ashford ML, Carling D, Withers DJ. AMPK is essential for energy homeostasis regulation and glucose sensing by POMC and AgRP neurons. J Clin Invest 117: 2325–2336, 2007. [DOI] [PMC free article] [PubMed] [Google Scholar]
- Cowley et al. 2001.Cowley MA, Smart JL, Rubinstein M, Cerdan MG, Diano S, Horvath TL, Cone RD, Low MJ. Leptin activates anorexigenic POMC neurons through a neural network in the arcuate nucleus. Nature 411: 480–484, 2001. [DOI] [PubMed] [Google Scholar]
- Crown et al. 2007.Crown A, Clifton DK, Steiner RA. Neuropeptide signaling in the integration of metabolism and reproduction. Neuroendocrinology 86: 175–182, 2007. [DOI] [PubMed] [Google Scholar]
- Dai et al. 2007.Dai Y, Wolfgang MJ, Cha SH, Lane MD. Localization and effect of ectopic expression of CPT1c in CNS feeding centers. Biochem Biophys Res Commun 359: 469–474, 2007. [DOI] [PubMed] [Google Scholar]
- Dowell et al. 2005.Dowell P, Hu Z, Lane MD. Monitoring energy balance: metabolites of fatty acid synthesis as hypothalamic sensors. Annu Rev Biochem 74: 515–534, 2005. [DOI] [PubMed] [Google Scholar]
- Dunn-Meynell et al. 1998.Dunn-Meynell AA, Rawson NE, Levin BE. Distribution and phenotype of neurons containing the ATP-sensitive K+ channel in rat brain. Brain Res 814: 41–54, 1998. [DOI] [PubMed] [Google Scholar]
- Fan et al. 1997.Fan W, Boston BA, Kesterson RA, Hruby VJ, Cone RD. Role of melanocortinergic neurons in feeding and the agouti obesity syndrome. Nature 385: 165–168, 1997. [DOI] [PubMed] [Google Scholar]
- Flier 2004.Flier JS Obesity wars: molecular progress confronts an expanding epidemic. Cell 116: 337–350, 2004. [DOI] [PubMed] [Google Scholar]
- Gribble et al. 2000.Gribble FM, Loussouarn G, Tucker SJ, Zhao C, Nichols CG, Ashcroft FM. A novel method for measurement of submembrane ATP concentration. J Biol Chem 275: 30046–30049, 2000. [DOI] [PubMed] [Google Scholar]
- Gribble et al. 1998.Gribble FM, Proks P, Corkey BE, Ashcroft FM. Mechanism of cloned ATP-sensitive potassium channel activation by oleoyl-CoA. J Biol Chem 273: 26383–26387, 1998. [DOI] [PubMed] [Google Scholar]
- Gutierrez-Juarez et al. 2006.Gutierrez-Juarez R, Pocai A, Mulas C, Ono H, Bhanot S, Monia BP, Rossetti L. Critical role of stearoyl-CoA desaturase-1 (SCD1) in the onset of diet-induced hepatic insulin resistance. J Clin Invest 116: 1686–1695, 2006. [DOI] [PMC free article] [PubMed] [Google Scholar]
- Gyte et al. 2007.Gyte A, Pritchard LE, Jones HB, Brennand JC, White A. Reduced expression of the KATP channel subunit, Kir6.2, is associated with decreased expression of neuropeptide Y and agouti-related protein in the hypothalami of Zucker diabetic fatty rats. J Neuroendocrinol 19: 941–951, 2007. [DOI] [PubMed] [Google Scholar]
- He et al. 2006.He W, Lam TK, Obici S, Rossetti L. Molecular disruption of hypothalamic nutrient sensing induces obesity. Nat Neurosci 9: 227–233, 2006. [DOI] [PubMed] [Google Scholar]
- Hu et al. 2005.Hu Z, Dai Y, Prentki M, Chohnan S, Lane MD. A role for hypothalamic malonyl-CoA in the control of food intake. J Biol Chem 280: 39681–39683, 2005. [DOI] [PubMed] [Google Scholar]
- Ibrahim et al. 2003.Ibrahim N, Bosch MA, Smart JL, Qiu J, Rubinstein M, Ronnekleiv OK, Low MJ, Kelly MJ. Hypothalamic proopiomelanocortin neurons are glucose responsive and express K(ATP) channels. Endocrinology 144: 1331–1340, 2003. [DOI] [PubMed] [Google Scholar]
- Itoh and Hinuma 2005.Itoh Y, Hinuma S. GPR40, a free fatty acid receptor on pancreatic beta cells, regulates insulin secretion. Hepatol Res 33: 171–173, 2005. [DOI] [PubMed] [Google Scholar]
- Itoh et al. 2003.Itoh Y, Kawamata Y, Harada M, Kobayashi M, Fujii R, Fukusumi S, Ogi K, Hosoya M, Tanaka Y, Uejima H, Tanaka H, Maruyama M, Satoh R, Okubo S, Kizawa H, Komatsu H, Matsumura F, Noguchi Y, Shinohara T, Hinuma S, Fujisawa Y, Fujino M. Free fatty acids regulate insulin secretion from pancreatic beta cells through GPR40. Nature 422: 173–176, 2003. [DOI] [PubMed] [Google Scholar]
- Lam et al. 2005a.Lam TK, Pocai A, Gutierrez-Juarez R, Obici S, Bryan J, Aguilar-Bryan L, Schwartz GJ, Rossetti L. Hypothalamic sensing of circulating fatty acids is required for glucose homeostasis. Nat Med 11: 320–327, 2005a. [DOI] [PubMed] [Google Scholar]
- Lam et al. 2005b.Lam TK, Schwartz GJ, Rossetti L. Hypothalamic sensing of fatty acids. Nat Neurosci 8: 579–584, 2005b. [DOI] [PubMed] [Google Scholar]
- Larsson et al. 1996.Larsson O, Deeney JT, Branstrom R, Berggren PO, Corkey BE. Activation of the ATP-sensitive K+ channel by long chain acyl-CoA. A role in modulation of pancreatic beta-cell glucose sensitivity. J Biol Chem 271: 10623–10626, 1996. [DOI] [PubMed] [Google Scholar]
- Loftus et al. 2000.Loftus TM, Jaworsky DE, Frehywot GL, Townsend CA, Ronnett GV, Lane MD, Kuhajda FP. Reduced food intake and body weight in mice treated with fatty acid synthase inhibitors. Science 288: 2379–2381, 2000. [DOI] [PubMed] [Google Scholar]
- Lopez et al. 2005.Lopez M, Tovar S, Vazquez MJ, Nogueiras R, Senaris R, Dieguez C. Sensing the fat: fatty acid metabolism in the hypothalamus and the melanocortin system. Peptides 26: 1753–1758, 2005. [DOI] [PubMed] [Google Scholar]
- Lu et al. 1994.Lu D, Willard D, Patel IR, Kadwell S, Overton L, Kost T, Luther M, Chen W, Woychik RP, Wilkison WO, Cone RD. Agouti protein is an antagonist of the melanocyte-stimulating-hormone receptor. Nature 371: 799–802, 1994. [DOI] [PubMed] [Google Scholar]
- Mirshamsi et al. 2004.Mirshamsi S, Laidlaw HA, Ning K, Anderson E, Burgess LA, Gray A, Sutherland C, Ashford ML. Leptin and insulin stimulation of signalling pathways in arcuate nucleus neurones: PI3K dependent actin reorganization and KATP channel activation. BMC Neurosci 5: 54, 2004. [DOI] [PMC free article] [PubMed] [Google Scholar]
- Morgan et al. 2004.Morgan K, Obici S, Rossetti L. Hypothalamic responses to long-chain fatty acids are nutritionally regulated. J Biol Chem 279: 31139–31148, 2004. [DOI] [PubMed] [Google Scholar]
- Mountjoy and Wong 1997.Mountjoy KG, Wong J. Obesity, diabetes and functions for proopiomelanocortin-derived peptides. Mol Cell Endocrinol 128: 171–177, 1997. [DOI] [PubMed] [Google Scholar]
- Muse et al. 2004.Muse ED, Obici S, Bhanot S, Monia BP, McKay RA, Rajala MW, Scherer PE, Rossetti L. Role of resistin in diet-induced hepatic insulin resistance. J Clin Invest 114: 232–239, 2004. [DOI] [PMC free article] [PubMed] [Google Scholar]
- Obici et al. 2003.Obici S, Feng Z, Arduini A, Conti R, Rossetti L. Inhibition of hypothalamic carnitine palmitoyltransferase-1 decreases food intake and glucose production. Nat Med 9: 756–761, 2003. [DOI] [PubMed] [Google Scholar]
- Obici et al. 2002.Obici S, Feng Z, Morgan K, Stein D, Karkanias G, Rossetti L. Central administration of oleic acid inhibits glucose production and food intake. Diabetes 51: 271–275, 2002. [DOI] [PubMed] [Google Scholar]
- Parton et al. 2007.Parton LE, Ye CP, Coppari R, Enriori PJ, Choi B, Zhang CY, Xu C, Vianna CR, Balthasar N, Lee CE, Elmquist JK, Cowley MA, Lowell BB. Glucose sensing by POMC neurons regulates glucose homeostasis and is impaired in obesity. Nature 449: 228–232, 2007. [DOI] [PubMed] [Google Scholar]
- Perkins 2006.Perkins KL Cell-attached voltage-clamp and current-clamp recording and stimulation techniques in brain slices. J Neurosci Methods 154: 1–18, 2006. [DOI] [PMC free article] [PubMed] [Google Scholar]
- Plum et al. 2006.Plum L, Ma X, Hampel B, Balthasar N, Coppari R, Munzberg H, Shanabrough M, Burdakov D, Rother E, Janoschek R, Alber J, Belgardt BF, Koch L, Seibler J, Schwenk F, Fekete C, Suzuki A, Mak TW, Krone W, Horvath TL, Ashcroft FM, Bruning JC. Enhanced PIP3 signaling in POMC neurons causes KATP channel activation and leads to diet-sensitive obesity. J Clin Invest 116: 1886–1901, 2006. [DOI] [PMC free article] [PubMed] [Google Scholar]
- Pocai et al. 2006.Pocai A, Lam TK, Obici S, Gutierrez-Juarez R, Muse ED, Arduini A, Rossetti L. Restoration of hypothalamic lipid sensing normalizes energy and glucose homeostasis in overfed rats. J Clin Invest 116: 1081–1091, 2006. [DOI] [PMC free article] [PubMed] [Google Scholar]
- Rossetti et al. 1997.Rossetti L, Stenbit AE, Chen W, Hu M, Barzilai N, Katz EB, Charron MJ. Peripheral but not hepatic insulin resistance in mice with one disrupted allele of the glucose transporter type 4 (GLUT4) gene. J Clin Invest 100: 1831–1839, 1997. [DOI] [PMC free article] [PubMed] [Google Scholar]
- Schwartz and Porte 2005.Schwartz MW, Porte D Jr. Diabetes, obesity, and the brain. Science 307: 375–379, 2005. [DOI] [PubMed] [Google Scholar]
- Schwartz et al. 2000.Schwartz MW, Woods SC, Porte D Jr, Seeley RJ, Baskin DG. Central nervous system control of food intake. Nature 404: 661–671, 2000. [DOI] [PubMed] [Google Scholar]
- Seghers et al. 2000.Seghers V, Nakazaki M, DeMayo F, Aguilar-Bryan L, Bryan J. Sur1 knockout mice. A model for K(ATP) channel-independent regulation of insulin secretion. J Biol Chem 275: 9270–9277, 2000. [DOI] [PubMed] [Google Scholar]
- Shyng and Nichols 1998.Shyng SL, Nichols CG. Membrane phospholipid control of nucleotide sensitivity of KATP channels. Science 282: 1138–1141, 1998. [DOI] [PubMed] [Google Scholar]
- Spanswick et al. 1997.Spanswick D, Smith MA, Groppi VE, Logan SD, Ashford ML. Leptin inhibits hypothalamic neurons by activation of ATP-sensitive potassium channels. Nature 390: 521–525, 1997. [DOI] [PubMed] [Google Scholar]
- Spanswick et al. 2000.Spanswick D, Smith MA, Mirshamsi S, Routh VH, Ashford ML. Insulin activates ATP-sensitive K+ channels in hypothalamic neurons of lean, but not obese rats. Nat Neurosci 3: 757–758, 2000. [DOI] [PubMed] [Google Scholar]
- van den Top et al. 2007.van den Top M, Lyons DJ, Lee K, Coderre E, Renaud LP, Spanswick D. Pharmacological and molecular characterization of ATP-sensitive K(+) conductances in CART and NPY/AgRP expressing neurons of the hypothalamic arcuate nucleus. Neuroscience 144: 815–824, 2007. [DOI] [PubMed] [Google Scholar]
- van de Wall et al. 2008.van de Wall E, Leshan R, Xu AW, Balthasar N, Coppari R, Liu SM, Jo YH, MacKenzie RG, Allison DB, Dun NJ, Elmquist J, Lowell BB, Barsh GS, de Luca C, Myers MG Jr, Schwartz GJ, Chua SC Jr. Collective and individual functions of leptin receptor modulated neurons controlling metabolism and ingestion. Endocrinology 149: 1773–1785, 2008. [DOI] [PMC free article] [PubMed] [Google Scholar]
- Wang et al. 2001.Wang J, Obici S, Morgan K, Barzilai N, Feng Z, Rossetti L. Overfeeding rapidly induces leptin and insulin resistance. Diabetes 50: 2786–2791, 2001. [DOI] [PubMed] [Google Scholar]
- Wang et al. 2006.Wang R, Cruciani-Guglielmacci C, Migrenne S, Magnan C, Cotero VE, Routh VH. Effects of oleic acid on distinct populations of neurons in the hypothalamic arcuate nucleus are dependent on extracellular glucose levels. J Neurophysiol 95: 1491–1498, 2006. [DOI] [PubMed] [Google Scholar]
- Wang et al. 2004.Wang R, Liu X, Hentges ST, Dunn-Meynell AA, Levin BE, Wang W, Routh VH. The regulation of glucose-excited neurons in the hypothalamic arcuate nucleus by glucose and feeding-relevant peptides. Diabetes 53: 1959–1965, 2004. [DOI] [PubMed] [Google Scholar]
- Wolfgang et al. 2008.Wolfgang MJ, Cha SH, Millington DS, Cline G, Shulman GI, Suwa A, Asaumi M, Kurama T, Shimokawa T, Lane MD. Brain-specific carnitine palmitoyl-transferase-1c: role in CNS fatty acid metabolism, food intake, and body weight. J Neurochem 105: 1550–1559, 2008. [DOI] [PMC free article] [PubMed] [Google Scholar]
- Wolfgang et al. 2007.Wolfgang MJ, Cha SH, Sidhaye A, Chohnan S, Cline G, Shulman GI, Lane MD. Regulation of hypothalamic malonyl-CoA by central glucose and leptin. Proc Natl Acad Sci USA 104: 19285–19290, 2007. [DOI] [PMC free article] [PubMed] [Google Scholar]
- Wolfgang et al. 2006.Wolfgang MJ, Kurama T, Dai Y, Suwa A, Asaumi M, Matsumoto S, Cha SH, Shimokawa T, Lane MD. The brain-specific carnitine palmitoyltransferase-1c regulates energy homeostasis. Proc Natl Acad Sci USA 103: 7282–7287, 2006. [DOI] [PMC free article] [PubMed] [Google Scholar]
- Wolfgang and Lane 2006.Wolfgang MJ, Lane MD. The role of hypothalamic malonyl-CoA in energy homeostasis. J Biol Chem 281: 37265–37269, 2006. [DOI] [PubMed] [Google Scholar]
- Xu et al. 2005.Xu AW, Kaelin CB, Takeda K, Akira S, Schwartz MW, Barsh GS. PI3K integrates the action of insulin and leptin on hypothalamic neurons. J Clin Invest 115: 951–958, 2005. [DOI] [PMC free article] [PubMed] [Google Scholar]
Associated Data
This section collects any data citations, data availability statements, or supplementary materials included in this article.