Abstract
Different sizes of viable-but-nonculturable cell subpopulations of a lactic acid bacterium strain were induced by adding increasing amounts of SO2. The experimental data obtained here were fitted to a segregated kinetic model developed previously. This procedure allowed us to determine in quantitative terms the contribution of this physiological state to malolactic fermentation.
The persistence of stressed, damaged, or viable-but-nonculturable (VBNC) cells during microbial fermentation underlines the requirement of alternative methods for detecting and characterizing these emergent states not otherwise detectable by traditional culture-based methods (13). Flow cytometry (FC) has evolved as an outstanding tool in bioprocesses due to its usefulness in cell physiology monitoring (5, 12). The persistence of nonculturable cells during microbial fermentation has been attributed to changes in water activity, acidity, redox potential, nutrient availability, and starvation (14, 17, 18, 24, 25) or to the use of preserved starter cultures (20). Additionally, the quantification of catalytic activity is critical to bioprocess optimization, as it measures the individual contributions of different cell subpopulations to the global process (2, 13). Despite the loss of culturability under standard conditions, it is strongly suspected that VBNC cells remain alive, maintain the transport system and biosynthesis, and are able to metabolize substrates (16, 26). Gene expression has also been demonstrated previously (9, 23). However, although the physiology, biochemistry, and genetics of the VBNC state have been studied over the years, its functionality and biological implication are still issues under intense debate (1, 21, 22).
In this work, cider malolactic fermentation (MLF) was selected as a model system to clarify the role played by VBNC cells in bioprocesses. MLF was carried out under different SO2 concentrations (0, 30, and 60 ppm total) for inducing VBNC states. The fermentation medium was sterile apple must or “green” cider (obtained just after alcoholic fermentation and containing 5.6% [vol/vol] ethanol), obtained as previously described (11). Sodium bisulfite was used for SO2 treatments. MLF was carried out in duplicate at 22°C statically in 250-ml bottles. An indigenous strain of Lactobacillus hilgardii was inoculated at an optical density at 600 nm of ∼0.1 to start MLF. Flasks were shaken just before sampling in order to homogenize the biomass content. Samples were taken aseptically at time intervals until malic acid was consumed (≤0.5 g liter−1), and cells were collected and processed for further analysis as described previously (20). Supernatants were filtered (0.45 μm pore size) and frozen (−20°C) until chemical analysis. The amount of malic acid was determined by high-pressure liquid chromatography (Alliance 2690; Waters) with a photodiode array detector (Waters 996), as reported previously (19).
Evolution of bacterial subpopulations during MLF.
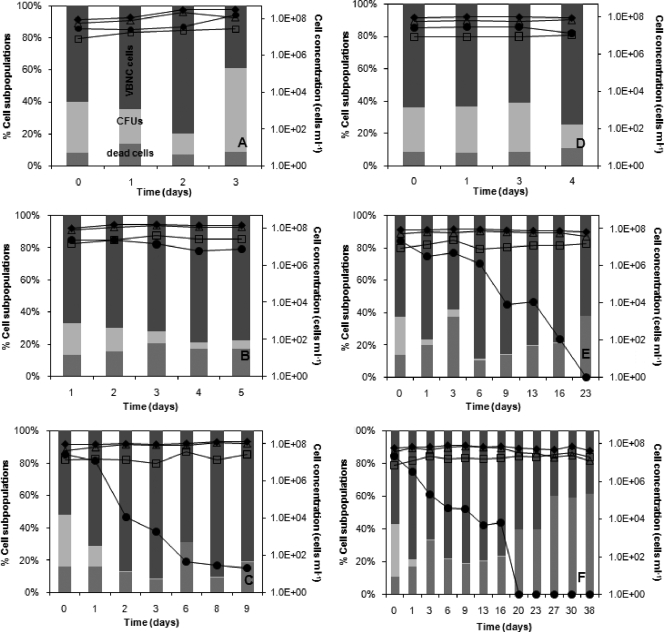
Viable cells (measured as CFU ml−1) were monitored by a plate counting method on MRS (in triplicate), as reported previously (20). Total cell counts were determined by DRAQ5 single staining, and metabolically active and dead cells were monitored by a dual-staining (Chem Chrome 6 [CV6] and propidium iodide [PI]) FC protocol carried out using a Cytomics FC 500 instrument (Beckman Coulter), as described previously (20). This dual-staining protocol was based on the detection of membrane integrity (PI) and intracellular esterase activity (CV6) as the metabolic probe. The evolution of total, viable, VBNC, and dead cells during MLF is shown in Fig. 1. A subpopulation of VBNC cells (calculated as the difference between metabolically active and viable cells) was found in both controls (Fig. 1a and d), as was detected previously under stress conditions during cider MLF (11). The use of sodium bisulfite caused a drop in cell viability even to the extent of a total absence (Fig. 1b, c, e, and f). Malic acid was consumed in all assays, showing the metabolic activity associated with the VBNC state, as previously observed (26). The addition of increasing SO2 amounts did not really correspond to an increase in cell death rate but accelerated the transition to VBNC states. The effect was more drastic with green cider fermentation, due to a synergistic effect of SO2 and other inhibitors, such as ethanol. Actually, SO2 has been reported to lead wine yeast and bacteria to adopt VBNC states rather than to undergo cell death (6, 7, 15).
FIG. 1.
Evolutions of different L. hilgardii subpopulations during MLF in apple must (A), apple must plus 30 ppm SO2 (B), apple must plus 60 ppm SO2 (C), green cider (D), green cider plus 30 ppm SO2 (E), and green cider plus 60 ppm SO2 (F). Subpopulations of VBNC cells, viable cells (CFU), and dead cells are plotted as percentages of the total cell counts on the principal y axis. Total (⧫), VBNC (▵), viable (CFU) (•), and dead (□) cells are expressed as cells ml−1 on the secondary y axis. Note the different values along the x axis in the different graphs.
Determination of malolactic activities of viable and VBNC subpopulations.
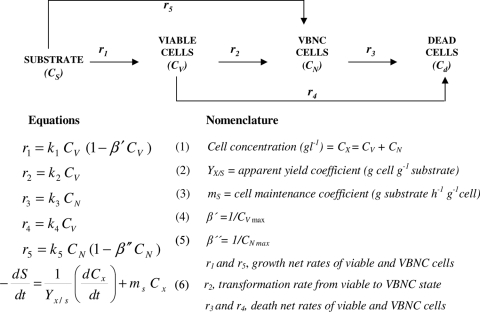
In order to quantify the malolactic activity of VBNC cells, experimental data for cell subpopulations and malate uptake were fitted (MicroMath Scientist version 2.0) to a segregated kinetic model developed previously (20). For kinetic modeling, the cell concentrations of bacterial subpopulations were expressed in g liter−1, using corresponding calibration curves determined previously (20). This model includes different cell physiological states and levels of malate consumption by metabolically active cells (Fig. 2). Enzymatic assays carried out as reported previously (10), using CV6-negative, PI-positive whole cells (referred to as dead cells in this work), showed a lack of malolactic activity, as expected. Thus, the total biomass involved in malate conversion (CX) was considered to be formed by VBNC (CN) and viable (CV) subpopulations. Since malate metabolism is not directly linked to cell growth or energy obtainment (4), the initial equation for substrate uptake (equation 6 in Fig. 2) is simplified as follows: −(dS/dT) = mVCV + mNCN, where mV and mN are cell maintenance coefficients of viable and VBNC subpopulations, respectively. These parameters can be considered a measure of the individual contribution of each subpopulation to the global process. This equation was finally expressed as follows: −(dS/dT) = qVCV + qNCN, where qV and qN are specific uptake rates of viable and VBNC subpopulations, respectively.
FIG. 2.
Scheme and equations of the segregated kinetic model (adapted from reference 20).
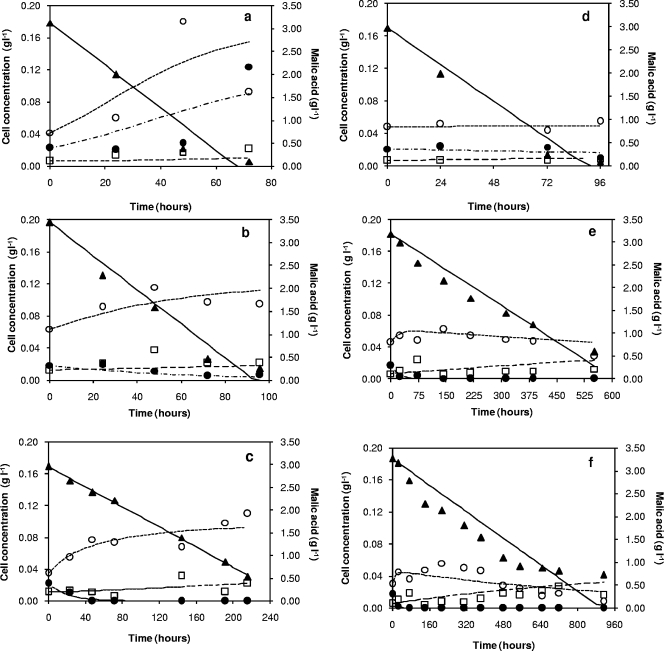
The experimental data and predicted values of different cell subpopulations during MLF are shown in Fig. 3. The values of the kinetic parameters are given in Table 1. The values obtained for k1 and k5 (growth kinetic constants) indicated that VBNC cells divided in apple must at a rate higher than that of viable cells (k5 > k1). The values of death constants, k3 and k4, showed slightly higher cell death rates as SO2 content increased, with k3 > k4 in all cases (higher VBNC death net rate).
FIG. 3.
Experimental data (symbols) and calculated values (lines) for L. hilgardii VBNC (○), viable (CFU) (•), and dead (□) cells and l-malic acid consumption (▴) during MLF in apple must (a), apple must plus 30 ppm SO2 (b), apple must plus 60 ppm SO2 (c), green cider (d), green cider plus 30 ppm SO2 (e), and green cider plus 60 ppm SO2 (f).
TABLE 1.
Kinetic parametersa determined during MLF in apple must and green cider in the absence and presence of SO2
| Fermentation medium | 1/β′ (g liter−1) | 1/β′′ (g liter−1) | k1 (h−1) | k2 (h−1) | k3 (h−1) | k4 (h−1) | k5 (h−1) |
|---|---|---|---|---|---|---|---|
| Apple must | 0.14 | 0.18 | 0.034 | 0.001 | 5.0 × 10⁻⁴ | 1.0 × 10⁻⁴ | 0.053 |
| Apple must plus 30 ppm SO2 | 0.12 | 0.017 | 5.8 × 10⁻⁴ | 1.0 × 10⁻⁴ | 0.021 | ||
| Apple must plus 60 ppm SO2 | 0.10 | 0.048 | 6.5 × 10⁻⁴ | 1.5 × 10⁻⁴ | 0.014 | ||
| Green cider | 0.050 | 0.002 | 5.5 × 10⁻⁴ | 1.5 × 10⁻⁴ | 1.5 × 10⁻⁴ | ||
| Green cider plus 30 ppm SO2 | 0.048 | 0.031 | 6.0 × 10⁻⁴ | 1.8 × 10⁻⁴ | 1.1 × 10⁻⁴ | ||
| Green cider plus 60 ppm SO2 | 0.088 | 1.0 × 10⁻³ | 3.0 × 10⁻⁴ |
β′ and β′′, the inverses of the maximum concentrations of viable and VBNC subpopulations, respectively; k1 and k5, growth kinetic constants of viable and VBNC subpopulations, respectively; k2, transformation constant from the viable state to the VBNC state; k3 and k4, death kinetic constants of viable and VBNC subpopulations, respectively.
Finally, malic uptake experimental data were also fitted to the equation −(dS/dT) = qVCV + qNCN, and parameters were calculated in each case, assuming a constant value during fermentation (Fig. 3; Table 2). In all cases, the qV/qN ratio was close to 2.0 during fermentation experiments. It was stated previously that the catalytic capacity of damaged cells is generally lower than that of viable cells (3). Entrance into the VBNC state can be accompanied by a reduction in substrate transport and metabolic activity levels in order to minimize cellular energetic requirements (16), as has been observed with nonculturable lactococci in response to sugar starvation (8).
TABLE 2.
Specific uptake rates of viable and VBNC subpopulations during MLF in apple must and green cider at concentrations of 0, 30, and 60 ppm SO2
| Fermentation medium | qV (g malate h−1 g−1 CFU) | qN (g malate h−1 g−1 VBNC cells) | qV/qN | R2 |
|---|---|---|---|---|
| Apple must | 1.10 | 0.54 | 2.04 | 0.97 |
| Apple must plus 30 ppm SO2 | 0.79 | 0.36 | 2.19 | 0.98 |
| Apple must plus 60 ppm SO2 | 0.48 | 0.17 | 2.82 | 0.99 |
| Green cider | 0.77 | 0.35 | 2.20 | 0.98 |
| Green cider plus 30 ppm SO2 | 0.13 | 0.07 | 1.94 | 0.99 |
| Green cider plus 60 ppm SO2 | 0.11 | 0.05 | 2.14 | 0.97 |
Conclusions.
VBNC cells conducting MLF showed a state of reduced metabolic activity. The specific malate uptake rate of the VBNC subpopulation was approximately 50% of that found for the viable population in all cases tested, irrespective of medium composition and SO2 concentration. VBNC cells became the majority of the total population in all cases (70 to 90%). These results may help to clarify, in quantitative terms, the real contribution of the VBNC subpopulation to fermentation processes. This outcome could be useful for bioprocess control and optimization on an industrial scale.
Footnotes
Published ahead of print on 6 March 2009.
REFERENCES
- 1.Bogosian, G., and E. V. Bourneuf. 2001. A matter of bacterial life and death. EMBO Rep. 2:770-774. [DOI] [PMC free article] [PubMed] [Google Scholar]
- 2.Brehm-Stecher, B., and E. A. Johnson. 2004. Single-cell microbiology: tools, technologies, and applications. Microbiol. Mol. Biol. Rev. 68:538-559. [DOI] [PMC free article] [PubMed] [Google Scholar]
- 3.Cánovas, M., V. García, V. Bernal, T. Torroglosa, and J. L. Iborra. 2007. Analysis of Escherichia coli cell state by flow cytometry during whole cell catalyzed biotransformation for L-carnitine production. Process Biochem. 42:25-33. [Google Scholar]
- 4.Cox, D. J., and T. Henick-Kling. 1995. Proton motive force and ATP generation during malolactic fermentation. Am. J. Enol. Vitic. 46:319-323. [Google Scholar]
- 5.Davey, H. M., and D. B. Kell. 1996. Flow cytometry and cell sorting of heterogeneous microbial populations—the importance of single-cell analyses. Microbiol. Rev. 60:641-696. [DOI] [PMC free article] [PubMed] [Google Scholar]
- 6.Divol, B., and A. Lonvaud-Funel. 2005. Evidence for viable but non-culturable yeasts in botrytis-affected wine. J. Appl. Microbiol. 99:85-93. [DOI] [PubMed] [Google Scholar]
- 7.Divol, B., P. Strehaiano, and A. Lonvaud-Funel. 2005. Effectiveness of dimethylcarbonate to stop alcoholic fermentation in wine. Food Microbiol. 22:169-178. [Google Scholar]
- 8.Ganesan, B., M. R. Stuart, and B. C. Weimer. 2007. Carbohydrate starvation causes a metabolically active but nonculturable state in Lactococcus lactis. Appl. Environ. Microbiol. 73:2498-2512. [DOI] [PMC free article] [PubMed] [Google Scholar]
- 9.Gunasekera, T. S., A. Sorensen, P. V. Attfield, S. J. Sorensen, and D. Veal. 2002. Inducible gene expression by nonculturable bacteria in milk after pasteurization. Appl. Environ. Microbiol. 68:1988-1993. [DOI] [PMC free article] [PubMed] [Google Scholar]
- 10.Herrero, M., L. A. García, and M. Díaz. 2003. Malolactic bioconversion using a Oenococcus oeni strain for cider production. Effect of yeast extract supplementation. J. Ind. Microbiol. Biotechnol. 30:699-704. [DOI] [PubMed] [Google Scholar]
- 11.Herrero, M., C. Quirós, L. A. García, and M. Díaz. 2006. Flow cytometry to follow the physiological states of microorganisms in cider fermentation processes. Appl. Environ. Microbiol. 72:6725-6733. [DOI] [PMC free article] [PubMed] [Google Scholar]
- 12.Hewitt, C. J., and G. Nebe-von-Caron. 2001. An industrial application of multiparameter flow cytometry: assessment of cell physiological state and its application to the study of microbial fermentations. Cytometry 44:179-187. [DOI] [PubMed] [Google Scholar]
- 13.Hewitt, C. J., and G. Nebe-von-Caron. 2004. The applications of flow cytometry to monitor cell physiological state. Adv. Biochem. Eng. Biotechnol. 89:197-223. [DOI] [PubMed] [Google Scholar]
- 14.Looser, H. F., M. Keller, M. Berney, K. Kovar, and T. Egli. 2005. Flow-cytometric detection of changes in the physiological state of E. coli expressing a heterologous membrane protein during carbon-limited fed-batch cultivation. Biotechnol. Bioeng. 92:69-78. [DOI] [PubMed] [Google Scholar]
- 15.Millet, V., and A. Lonvaud-Funel. 2000. The viable but non-culturable state of wine microorganisms during storage. Lett. Appl. Microbiol. 30:136-141. [DOI] [PubMed] [Google Scholar]
- 16.Oliver, J. D. 2005. The viable but non-culturable state in bacteria. J. Microbiol. 43:93-100. [PubMed] [Google Scholar]
- 17.Papadimitriou, K., H. Pratsinis, G. Nebe-von Caron, D. Kletsas, and E. Tsakalidou. 2007. Acid tolerance of Streptococcus macedonicus as assessed by flow cytometry and single-cell sorting. Appl. Environ. Microbiol. 73:465-476. [DOI] [PMC free article] [PubMed] [Google Scholar]
- 18.Peneau, S., D. Chassaing, and B. Carpentier. 2007. First evidence of division and accumulation of viable but nonculturable Pseudomonas fluorescens cells on surfaces subjected to conditions encountered at meat processing premises. Appl. Environ. Microbiol. 73:2839-2846. [DOI] [PMC free article] [PubMed] [Google Scholar]
- 19.Picinelli, A., B. Suárez, J. Moreno, R. Rodríguez, M. L. Caso García, and J. J. Mangas. 2000. Chemical characterization of Asturias cider. J. Agric. Food Chem. 48:3997-4002. [DOI] [PubMed] [Google Scholar]
- 20.Quirós, C., M. Herrero, L. A. García, and M. Díaz. 2007. Application of flow cytometry to segregated kinetic modeling based on the physiological states of microorganisms. Appl. Environ. Microbiol. 73:3993-4000. [DOI] [PMC free article] [PubMed] [Google Scholar]
- 21.Rowan, N. J. 2004. Viable but non-culturable forms of food and waterborne bacteria: quo vadis? Trends Food Sci. Technol. 15:462-467. [Google Scholar]
- 22.Sardessai, Y. N. 2005. Viable but non-culturable bacteria: their impact on public health. Curr. Sci. 89:10. [Google Scholar]
- 23.Smith, B., and J. D. Oliver. 2006. In situ and in vitro gene expression by Vibrio vulnificus during entry into, persistence within, and resuscitation from the viable but nonculturable state. Appl. Environ. Microbiol. 72:1445-1451. [DOI] [PMC free article] [PubMed] [Google Scholar]
- 24.Stuart, M. R., L. S. Chou, and B. C. Weimer. 1999. Influence of carbohydrate starvation and arginine on culturability and amino acid utilization of Lactococcus lactis subsp. lactis. Appl. Environ. Microbiol. 65:665-673. [DOI] [PMC free article] [PubMed] [Google Scholar]
- 25.Sundström, H., F. Wallberg, E. Ledung, B. Norrman, C. J. Hewitt, and S.-O. Enfors. 2004. Segregation to non-dividing cells in recombinant Escherichia coli fed-batch fermentation processes. Biotechnol. Lett. 26:1533-1539. [DOI] [PubMed] [Google Scholar]
- 26.Tonon, T., and A. Lonvaud-Funel. 2000. Metabolism of arginine and its positive effect on growth and revival of Oenococcus oeni. J. Appl. Microbiol. 89:526-531. [DOI] [PubMed] [Google Scholar]


