

Abstract
Previously established consequences of abolishing pyruvate kinase (Pyk) activity in Escherichia coli during aerobic growth on glucose include reduced acetate production, elevated hexose monophosphate (HMP) pathway flux, elevated phosphoenolpyruvate carboxylase (Ppc) flux, and an increased ratio of phosphoenolpyruvate (PEP) to pyruvate. These traits inspired two hypotheses. First, the mutant (PB25) may maintain more plasmid than the wild type (JM101) by combining traits reported to facilitate plasmid DNA synthesis (i.e., decreased Pyk flux and increased HMP pathway and Ppc fluxes). Second, PB25 likely possesses a higher level of cyclic AMP (cAMP) than JM101. This is based on reports that connect elevated PEP/pyruvate ratios to phosphotransferase system signaling and adenylate cyclase activation. To test the first hypothesis, the strains were transformed with a pUC-based, high-copy-number plasmid (pGFPuv), and copy numbers were measured. PB25 exhibited a fourfold-higher copy number than JM101 when grown at 37°C. At 42°C, its plasmid content was ninefold higher than JM101 at 37°C. To test the second hypothesis, cAMP was measured, and the results confirmed it to be higher in PB25 than JM101. This elevation was not enough to elicit a strong regulatory effect, however, as indicated by the comparative expression of the pGFPuv-based reporter gene, gfpuv, under the control of the cAMP-responsive lac promoter. The elevated cAMP in PB25 suggests that Pyk may participate in glucose catabolite repression by serving among all of the factors that tighten gene expression.
Aerobic growth of Escherichia coli and many other bacteria on glucose is characterized by the catabolite repression of many genes and copious acetate excretion. Catabolite repression occurs, in part, because adenylate cyclase (AC) activity is suppressed (29), thereby lowering the abundance of its product, cyclic AMP (cAMP). Cyclic AMP binds to the cAMP receptor protein (CRP) to form cAMP-CRP, the transcription factor that ultimately coordinates catabolite repression. Acetate production has been suggested to result from excess glycolytic capacity relative to that of the tricarboxylic acid (TCA) cycle. Due to the capacity mismatch, excess carbon from glycolysis overflows as incompletely oxidized acetate (16, 19).
Acetate excretion is problematic from a biotechnological standpoint. Its accumulation in the growth medium reduces cell growth and limits the maximum attainable cell concentration (18). Moreover, the production of acetate represents a waste of input carbon that could otherwise be used to build biomass and/or a desired product (11).
Abolishing or attenuating pyruvate kinase (Pyk; EC 2.7.1.40) activity is one strategy that has been used to develop strains of E. coli (31, 41) and Bacillus subtilis (13) that do not produce acetate. Unlike B. subtilis, E. coli possesses two isozymes, PykF and PykA, where PykF is the dominant activity when growth occurs aerobically on glucose (20, 32, 35). Figure 1 illustrates the metabolic strategy applied to E. coli. Flux analysis (30) and metabolic logic predict that two redirections of carbon flux occur. One arises from the allosteric inhibition of phosphofructokinase by phosphoenolpyruvate (PEP) (3). This reduces glycolytic flux and shunts imported glucose to the hexose monophosphate (HMP) pathway. Additionally, PEP can be directed around the pykF pykA mutations by conversion to oxaloacetate via PEP carboxylase (Ppc), thereby bypassing the acetate-forming steps. Flux reroutings combine with the phosphotransferase system (PTS) to provide ample pyruvate for meeting acetyl coenzyme A and TCA cycle demands.
FIG. 1.
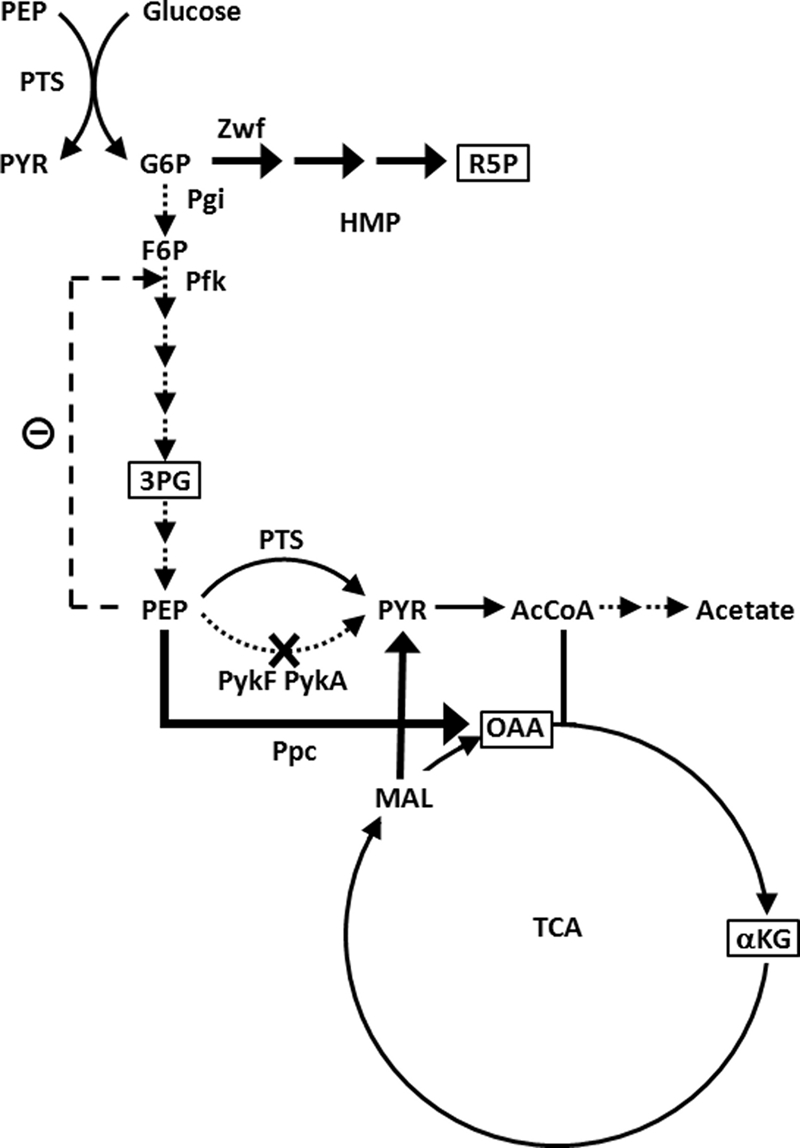
Elimination of pyruvate kinase as an acetate reduction strategy. Increased PEP leads to (i) feedback inhibition of Pfk and elevated HMP pathway flux and/or (ii) increased flux through the anaplerotic phosphoenolpyruvate carboxylase (Ppc). Dotted and fat arrows depict lessened and increased fluxes, respectively, relative to the wild type. Key precursors for plasmid DNA synthesis (boxed) are also shown. Additional abbreviations: 3PG, 3-phosphoglycerate; αKG, α-ketoglutarate; AcCoA, acetyl coenzyme A; F6P, fructose-6-phosphate; G6P, glucose-6-phosphate; MAL, malate; OAA, oxaloacetate; Pgi, phosphoglucose isomerase; PTS, phosphotransferase system; PykA, AMP-activated pyruvate kinase; PykF, FBP-activated pyruvate kinase; PYR, pyruvate; R5P, ribose-5-phosphate; Zwf, glucose-6-phosphate dehydrogenase.
An E. coli pykF pykA double knockout (PB25) produces much less acetate than JM101, its wild-type counterpart (31, 41), without eliciting the excretion of other carboxylic acids (41). It also exhibits a modest 15 to 25% reduction in growth rate (31, 41), indicating that the isozymes are not essential for growth on glucose. In accord with predictions, PB25 exhibits increased HMP pathway and Ppc fluxes (9, 33), as does a pykF single mutant (36). For example, the HMP/glycolysis flux ratio in the pykF knockout was found to increase from the wild-type value of 0.5 to 4.0, and its Ppc flux increased 2.6-fold (36).
Other consequences of the mutation in E. coli have been found. The data reported by Siddiquee et al. (35, 36) indicate that a significantly increased PEP/pyruvate ratio results, which we have also found (data not shown). Some enzyme activities whose expression is transcriptionally activated by cAMP-CRP have also been reported to be in the range of 0.6- to 1.5-fold relative to the wild-type level (35, 36).
The above observations motivated the two hypotheses that were investigated in this study. First, we hypothesized that PB25 may combine and accentuate the flux traits needed for harboring high-copy-number plasmids and thus maintain a higher copy number than JM101 (Fig. 1). This hypothesis is based on four related facts. First, the HMP pathway produces key precursors for DNA and RNA synthesis. Second, E. coli (JM101) grown in M9 medium exhibited less growth rate burden from plasmid maintenance when the HMP pathway gateway enzyme, glucose-6-phosphate dehydrogenase (Zwf), was overexpressed and glucose was the carbon source (12). For example, the burden was greatly reduced and began to level off when expression was increased by ninefold (12). Third, Ow et al. (27) found that when E. coli (DH5α) harbored a high-copy-number plasmid, expression from zwf increased by 1.2-fold while expression from phosphoglucose isomerase decreased by 1.8-fold. Their results suggest that one adaptation to plasmid presence entails increasing the HMP/glycolysis ratio by about a factor of 2. Lastly, it was reported that E. coli expressed less Pyk and more Ppc when copy number increased (2). The HMP/glycolysis ratio in Pyk-mutated E. coli, in turn, has been reported to be eightfold greater than the wild-type value (36), and as noted above, the Ppc flux is elevated 2.6-fold. The flux alterations in Pyk-deficient E. coli thus both track and combine the HMP, Pyk, Ppc, and other flux adaptations reported to occur when high-copy-number plasmids are harbored. Additionally, the magnitudes of the flux alterations are comparable to or exceed reported flux adaptations or flux changes found to significantly reduce burden.
Second, because the PEP/pyruvate ratio is greater in PB25 than in the wild type, we hypothesized that cAMP is elevated in PB25 for growth on glucose. The hypothesis is based on the positive link reported between the PEP/pyruvate ratio and the extent of phosphorylation of the PTS component IIAGlc (15). The phosphorylated form of IIAGlc (IIAGlc ∼ P), in turn, has been shown to directly participate in activating AC (28). Thus, the reported links suggest that the greater the PEP/pyruvate ratio, the higher the level of cAMP.
To investigate the first hypothesis, we measured the copy numbers of a pUC-based plasmid in exponentially growing PB25 and JM101 at 37 and 42°C. Measurements were made at two temperatures because the inherently high copy numbers of such plasmids can be bolstered two- to threefold further when shifted from 37 to 42°C (7, 17). To pursue the second hypothesis, an enzyme-linked binding assay was used to measure the cAMP levels in the strains when each was grown on glucose. To benchmark the results, cAMP was measured in glycerol-grown JM101, a case where cAMP is well-known to be sufficiently elevated to enable the expression of catabolically repressed genes. To scrutinize further the cAMP and copy number measurements, we measured the strain-dependent extent of plasmid-based GFPuv expression under the control of the cAMP-sensitive lac promoter (Plac). To ensure that the GFPuv expression provided useful results, control experiments were performed. Verifying that GFPuv expression could effectively report on cAMP levels entailed (i) comparing expression when exogenous cAMP was present or absent and (ii) observing changes in expression during diauxic growth on glucose and glycerol. Another control involved replacing Plac with the promoter PL8UV5, which is engineered to be cAMP insensitive yet of strength comparable to Plac when cAMP is abundant. This control provided the level of GFPuv expression that should occur in PB25 when the cAMP level is sufficient to highly activate Plac. Overall, we found that PB25 maintains fourfold more plasmid DNA than JM101 when each is grown at 37°C. When grown at 42°C, PB25 possesses ninefold more plasmid than JM101 grown at 37°C. PB25 was also found to have a threefold greater level of cAMP than JM101 during exponential growth on glucose, although this increase was not enough to highly activate Plac.
MATERIALS AND METHODS
Bacterial strains and plasmids.
The two E. coli strains used were JM101 [supE thi Δ(lac-proAB) F′(traD36 proA+B+ lacIqZΔM15)] (26), which served as the wild type, and PB25 (32), a JM101 derivative that lacks functional Pyk isozymes (same as JM101 except pykA::kan pykF::cat). Competent cell preparations and transformations of these strains were carried out as per the methods of Maniatis et al. (23), which are based on the calcium chloride method of Mandel and Higa (22). Growth on selective medium (LB agar plates containing 100 μg/ml of ampicillin) was employed to identify positive transformants.
Both strains were transformed with plasmid pGFPuv (Clontech Laboratories, Inc.), which contains the gfpuv gene (6) on a pUC-derived backbone that provides a high-copy-number, temperature-sensitive origin of replication (ori) and a constitutively expressed β-lactamase ampicillin resistance gene. The plasmid places expression of GFPuv, which is fused in frame to a short β-galactosidase sequence at its N terminus, under the control of the wild-type lac promoter. PB25 was also transformed with plasmid pL8UV5-GFP, whose construction is described below. This plasmid is identical to pGFPuv except that Plac was made to carry the L8 and UV5 mutations (PL8UV5), which essentially renders GFPuv expression insensitive to catabolite repression. The L8 mutation (1) occurs in the CRP binding site (8), impairing cAMP-CRP activator binding. Because this significantly weakens expression from the promoter, the UV5 mutation is incorporated to restore promoter strength to wild-type order when cAMP-CRP is ample (37) by converting the −10 region into the more favorable TATAAT (14).
Plasmid pL8UV5-GFP was created from pGFPuv with the aid of four primers (Midland Certified Reagent Company, Inc.): P1, 5′-CGGTTCCTGG CCTTTTGCTG-3′; P2, 5′-TCCGCTCACA ATTCCACACA TTATACGAGC CGGAAGCATA AAGTGTAAAG CCTGGGGTGC CTAATGAGTG AGCTAACTTA CATTAATTGC GTTGCGCTC-3′; P3, 5′-GAGCGCAACG CAATTAATGT AAGTTAGCTC ACTCATTAGG CACCCCAGGC TTTACACTTT ATGCTTCCGG CTCGTATAAT GTGTGGAATT GTGAGCGGA-3′; P4, 5′-CTACCGGTAC CCGGGGATCC-3′.
First, two independent PCR amplifications were carried out with pGFPuv, each of whose resulting fragments contained both the desired L8 (in bold italics) and UV5 (underlined) mutations. In addition, each fragment was designed to incorporate a restriction site. P1 and P2 were used to produce a 348-bp fragment (F1) containing a PciI site, and P3 and P4 were used to produce a 191-bp fragment (F2) containing a HindIII site. F1 and F2 were each purified using standard polyacrylamide gel electrophoresis (PAGE) methods (23). P1 and P4 were then used to carry out a third PCR with F1 and F2. By taking advantage of their 99-bp complementarity, a 440-bp fragment (F3) was produced that contained both mutations and both restriction sites. This fragment was also purified by PAGE. Finally, F3 and pGFPuv were each digested with PciI and HindIII, purified, mixed, and ligated together, yielding pL8UV5-GFP. PB25 was then transformed with this plasmid. Confirmation of the successful introduction of the L8 and UV5 mutations was achieved by DNA sequencing (University of Pittsburgh DNA Sequencing Facility) using purified plasmid DNA from positive clones.
Culture media and growth conditions.
All physiological characterizations of the strains were carried out in M9 minimal medium (27) supplemented with a carbon source, a trace element solution (4), and thiamine (10 mg/liter). Glucose (5.0 g/liter) and glycerol (5.1 g/liter) were employed as carbon sources to examine conditions of low and high cAMP concentration, respectively. Transformed strains were maintained on agarose plates containing LB medium plus the appropriate antibiotics (150 μg/ml carbenicillin for JM101; 10 μg/ml chloramphenicol and 150 μg/ml carbenicillin for PB25). For overnight batch cultures, single colonies were picked from plates and inoculated into 250-ml baffled shake flasks containing 50 ml M9-glucose medium. These cultures were grown (37°C, 250 rpm) to mid-exponential phase and then used to inoculate experimental cultures to an initial optical density (OD) at 660 nm of 0.01 to 0.10. Conditions for the experimental cultures were identical to those of the overnight cultures, with the following additional notes.
When examining the effects of temperature shift on copy number, cultures were inoculated to an initial OD of 0.02, allowed to undergo four doublings at 37°C, and then shifted to 42°C. This left about four additional doublings to occur at the higher temperature before glucose exhaustion and the onset of stationary phase.
When measuring GFPuv expression, induction of cultures was achieved by the addition of isopropyl β-d-1-thiogalactopyranoside (IPTG) to a final concentration of 1 mM after 1 h of noninduced growth. This concentration of inducer was selected because using higher concentrations did not affect the resulting GFPuv expression, indicating that 1 mM is enough to ensure complete repressor titration. Exogenous cAMP (1 or 5 mM) was added to cultures simultaneously with IPTG in a round of experiments aimed at verifying that GFPuv expression reports on cAMP.
Measurement of growth kinetics and GFPuv production.
Cell growth was monitored by hourly OD measurements. GFPuv was assessed by measuring fluorescence intensity at room temperature with a fluorescence spectrometer (SpectraMax M2; Molecular Devices) set to excite at 395 nm and detect emission at 507 nm. Prior to measurement, all samples were diluted to 0.05 to 0.10 OD units in order to minimize any inner filter effects. Moreover, the relationship between fluorescence intensity and OD was found to be linear in this range. Triplicate measurements were obtained for each sample, and average values are reported. Fluorescence data are reported as relative fluorescence units per OD (RFU/OD) in order to place GFPuv expression on a per cell mass basis.
Plac and PL8UV5 were verified to be nonleaky by comparing the total RFU/OD ratios of noninduced plasmid-bearing strains to those of their nontransformed counterparts and finding no difference. Growth of a noninduced plasmid-bearing culture that was inoculated from the same overnight culture as, and grown in parallel to, each induced culture provided a control for the fluorescence background contributed by native fluorophores. Thus, reported RFU/OD values were obtained by subtracting the fluorescence of a given noninduced control culture from the fluorescence of its induced counterpart. Periodically, cell-free samples of growth medium were analyzed for the presence of GFPuv, but its presence was never detected in the culture medium.
Plasmid copy number determination.
Plasmid copy numbers were determined using the agarose gel electrophoresis technique of Pushnova et al. (34) with minor modifications. All determinations were made from exponentially growing cells, with an equal OD of cells collected for every measurement. Specifically, the culture volume corresponding to 4 OD units was spun down (25°C, 10,000 × g, 3 min), and the medium was discarded. The pellet was frozen in liquid nitrogen and stored at −80°C overnight before resuspension the next day in 400 μl of 50 mM Tris-50 mM EDTA, pH 8.0 (TE). DNA isolation and purification were then carried out exactly as described by Pushnova et al. (34). Serial twofold dilutions (2-, 4-, 8-, 16-, 32-, 64-, and 128-fold) totaling 10 μl each were prepared using TE. Each of the seven dilutions was mixed with 2 μl of 6× loading dye and loaded into a 0.8% 0.5× Tris-acetate-EDTA agarose gel. The gel was electrophoresed for 3 h at 100 V (Wide Mini-Sub Cell GT; Bio-Rad), stained for 15 min in 0.5 μg/ml ethidium bromide, and destained for 45 min in water. The stained gel was UV illuminated and photographed with a charge-coupled-device camera (BioDoc-It Imaging System; UVP) before subsequently being analyzed using pixel-based densitometry software (Gel-Pro Express 4.0; Media Cybernetics). The genomic and plasmid DNA band peak areas obtained for each lane were used to calculate plasmid copy number according to recommended data reduction guidelines (34). Average per genome copy numbers from two to four gels for each case are reported.
Interstrain comparisons of per genome copy number can reliably be made because growth rate differences in all experiments were not large enough to create significant differences in cell mass or per cell genomic DNA content. This was verified by comparing the areas of the genomic DNA bands obtained from JM101 and PB25 on the same gel for lanes loaded with the same OD of cells and finding a variation of about 10%.
cAMP assay.
Extracellular cAMP concentrations were measured using a commercially available kit (cAMP direct immunoassay kit; BioVision). Cultures were grown until the OD was 2.4 (exponential phase), at which point 5 ml of culture was filtered. The filtrate was immediately frozen in liquid nitrogen and stored at −80°C until assayed. Assays were carried out within 24 h in accord with the manufacturer's instructions. Each sample was assayed in duplicate, and averages are reported.
GFPuv dynamics following cessation of induction.
To track the fate of GFPuv following the cessation of induction, IPTG-induced cultures were first grown to mid-exponential phase. At this point, 4.5 ml of culture was collected, and the cells were pelleted (4°C, 10,000 × g, 1 min). The IPTG-containing supernatant was subsequently discarded, and the cells were washed twice with 1.1 ml of wash buffer (M9 medium with no accompanying carbon source) before being used to inoculate fresh cultures of 50 ml M9-glucose medium. These cultures were grown under the aforementioned batch conditions, and their time-dependent fluorescence was monitored. Noninduced cultures were subjected to the same steps in parallel as a control for background autofluorescence.
Intrinsic GFPuv synthesis rate calculation.
The intrinsic synthesis rate (rs) of a given protein can be determined from protein induction data (P versus t) using the general time-dependent balance for any protein per unit cell mass (P), which is given by equation 1:
 |
(1) |
where kd and μ denote the first-order degradation rate constant and the specific growth rate, respectively. As equation 1 shows, protein accumulation is governed by the difference between its rate of synthesis and its rates of degradation by proteases (kdP) and dilution into daughter cells (μP). For the case of a degradation-resistant protein, equation 1 reduces to equation 2:
 |
(2) |
Thus, rs can be extracted from protein induction data by using either the initial slope or the asymptotic value of P that is established after a number of generations of balanced exponential growth at μ (24, 40). In order to fully discern the asymptote before the onset of stationary phase, cultures were initialized at an OD of ≤0.1, as this was found to permit enough culture doublings to take place. Whether the postinduction initial slope or the asymptote was used, rs was determined using P versus t data obtained from cells during exponential growth only; data from stationary phase were not used because μ goes to zero and metabolism becomes unbalanced. Figure 2 shows an example of typical growth and induction data obtained and used for calculating rs via equation 2.
FIG. 2.
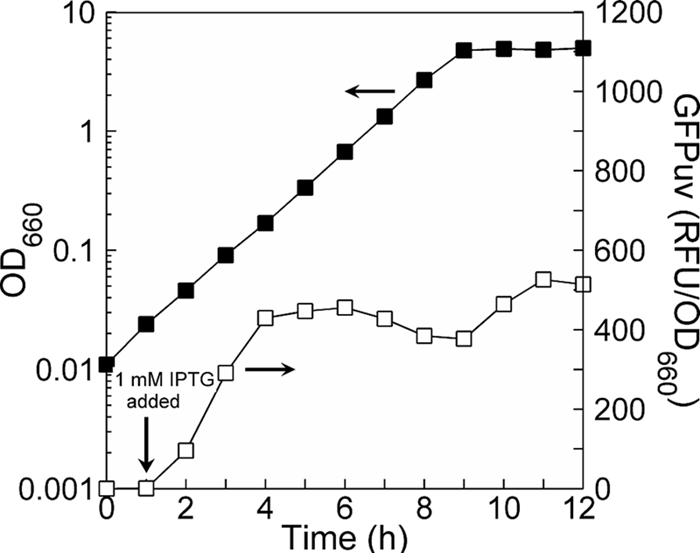
Typical growth and GFPuv induction data used for intrinsic protein synthesis rate determinations. Data are shown for JM101 grown on glucose. Use of a low-cell-density inoculum and early GFPuv induction results in a postinduction near-linear accumulation phase followed by a leveling off during which multiple doublings occur at a constant μ. Using equation 2, an intrinsic GFPuv synthesis rate (RFU/OD/h) can be determined. Data from stationary phase are not used in rs determinations, as μ goes to zero and growth becomes unbalanced.
RESULTS
Plasmid copy number comparisons.
To test the hypothesis that PB25 maintains a higher plasmid content than JM101, copy numbers were determined in these strains during exponential growth on glucose. Because pGFPuv employs a temperature-sensitive pUC ori, these determinations were made in cells growing isothermally at 37°C as well as in cells that were shifted from 37 to 42°C, at which copy numbers are known to increase two- to threefold over several generations (7, 17). The temperature shift experiment was performed in order to more fully explore the differences in plasmid copy number that may exist between PB25 and JM101. In those experiments, the shift was made after four generations of exponential growth at 37°C, leaving four additional generations to occur at 42°C before the onset of stationary phase.
Table 1 shows the growth and copy number results from the temperature shift experiment. After the shift, the growth rate of each strain decreased slightly, and their copy numbers increased as expected. At 37°C, PB25 maintained a fourfold-higher copy number than JM101. After the temperature shift, PB25 contained over ninefold more plasmid than isothermally grown JM101. When the strains were compared on a temperature-shifted basis, the copy number attained by JM101 was less than half that attained by PB25. Overall, it appears that PB25 can harbor considerably more plasmid than JM101, while PB25 maintains 78% and 92% of the specific growth rate of JM101 at 37 and 42°C, respectively.
TABLE 1.
Copy number and growth rate under isothermal and temperature-shifted growth conditions
| Strain | Isothermal at 37°C
|
After shift from 37 to 42°C
|
||
|---|---|---|---|---|
| Growth rate (h−1) | Copy no. | Growth rate (h−1) | Copy no.a | |
| JM101 | 0.76 | 129 | 0.61 | 519 |
| PB25 | 0.59 | 537 | 0.56 | 1,217 |
Determined immediately before stationary phase, about four generations post-temperature shift.
cAMP comparisons via direct immunoassay.
To test the hypothesis that cAMP levels in PB25 are elevated relative to JM101, cAMP concentrations were measured for these strains. Measurements were also performed on glycerol-grown JM101 to provide a positive control, as cAMP concentration is well known to be high in wild-type E. coli when glycerol is the carbon source and low when glucose is the carbon source. These determinations were made during exponential growth at an OD of 2.4 after five culture doublings. Extracellular measurements were made in addition to intracellular measurements because intracellular measurements are much more prone to error (25). This is because cells are permeable to cAMP and more than 99% is excreted, complicating intracellular determinations amid high backgrounds of extracellular cAMP (25).
Figure 3 shows the results of the extracellular measurements, which are proportional to the intracellular value during exponential growth (10). The intracellular values (data not shown) exhibited the same trend as the extracellular values: JM101 growing on glucose < PB25 growing on glucose < JM101 growing on glycerol. Glucose-grown PB25 possesses a threefold elevation in cAMP compared to the wild type grown on glucose. The cAMP level for PB25, however, is less than that of glycerol-grown JM101. These results support the hypothesis that the cAMP level in PB25 is greater than that of JM101 for growth on glucose.
FIG. 3.
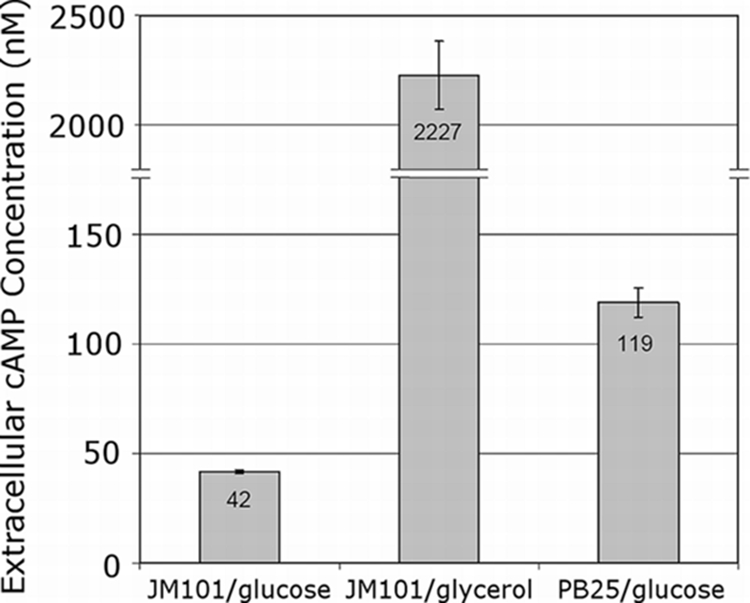
Extracellular cAMP accumulation. The indicated strains were grown in M9 minimal medium supplemented with the indicated carbon sources (5.0 g/liter glucose or 5.1 g/liter glycerol). Determinations were made from cultures during exponential growth at an OD of 2.4.
GFPuv expression as a cAMP reporter.
An additional approach was used to gauge whether cAMP differences exist between JM101 and PB25. It entailed measuring the expression of a plasmid-based reporter (GFPuv) controlled by a cAMP-responsive promoter (Plac). In addition to providing another test of the hypothesis, the use of such a system potentially permits intracellular variations to be detected while avoiding the errors associated with extraction-based assays (25). It also provides a means to examine whether the analytical elevation of cAMP in PB25 (Fig. 3) is enough to elicit significantly enhanced gene expression. Moreover, it does this while avoiding the use of AC or CRP mutants as signaling controls, which could confound results by exerting additional global regulatory effects on metabolism. Finally, this system allows us to further explore copy number variations between JM101 and PB25 by creating conditions where expression of a plasmid-based gene is also involved.
Before relying on GFPuv expression as a cAMP reporter, however, the following was first established: (i) GFPuv is a stable reporter and (ii) GFPuv expression is sensitive to cAMP variations. The results of the experiments aimed at validating the reporter system will be described first. Thereafter, the GFPuv expression results will be summarized.
Verification that GFPuv resists degradation.
To assess GFPuv stability, a pulse-chase-like experiment was performed. As detailed in Materials and Methods, cells from an IPTG-induced culture were first harvested during exponential growth and washed of the inducer. These preinduced but washed cells were then used to inoculate a second culture flask where inducer was absent. If GFPuv is stable against degradation, then its corresponding RFU/OD should decay in an exponential fashion with a time constant equal to the specific growth rate, as per equation 1, with rs = kd = 0.
Figure 4A shows the dynamics of the GFPuv-derived fluorescence following the inoculation of preinduced cells into the second growth flask. The RFU/OD ratio decreased with time as expected, and the resumption of growth was rapid. To determine if the decay was exponential and, if so, the time constant, a semilog plot (Fig. 4B) was created using fluorescence data from Fig. 4A. According to equation 1, a plot of the ln(P/P0) versus t should behave linearly with a slope equal to −(kd + μ) when synthesis ceases (rs = 0). As Fig. 4B shows, the replotted GFPuv fluorescence data did behave linearly with a negative slope. Moreover, the slope of the data is very similar to the projected case (Fig. 4B) where cytoplasmic dilution alone drives the decay of RFU/OD. The first three data points, which span more than a halving of the RFU/OD over 1.5 culture doublings, are colinear with the theoretical cytoplasmic dilution line. The fourth point corresponds to a 90% decrease and 2.5 doublings, but due to the low residual fluorescence per cell its relative error is greater. From this experiment, we conclude that kd is much smaller than μ, implying that GFPuv is resistant to degradation.
FIG. 4.
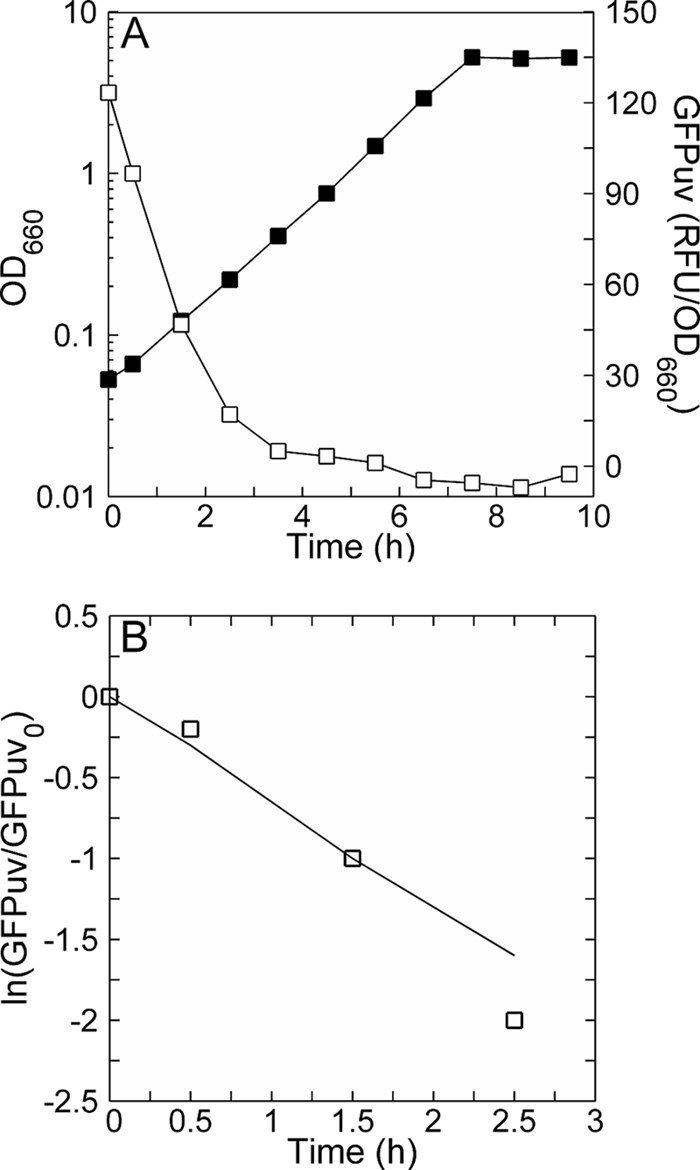
Verification that GFPuv resists degradation. (A) GFPuv dynamics following the cessation of induction. GFPuv production in JM101 was induced (1 mM IPTG at 1 h) and allowed to proceed until mid-exponential phase. Cells from this induced culture were harvested, washed of the inducer, and used to inoculate a fresh culture whose growth kinetics and loss of GFPuv are shown. No inducer was added to this culture. (B) Comparison of GFPuv decay from the experimental data in panel A with the projected case (solid line) where loss occurs solely due to cytoplasmic dilution. Equation 1 was used to obtain the projection, assuming rs = kd = 0 and μ = 0.65 h−1, based on the growth curve in panel A.
Verification that GFPuv expression reports on cAMP levels.
To confirm that GFPuv expression can effectively report on the intracellular cAMP concentration, GFPuv expression was monitored under two different circumstances: (i) exogenous cAMP addition and (ii) hierarchical carbon source utilization. The first experiment was performed by adding cAMP (1 or 5 mM) to the culture medium at the same time as the inducer and comparing the resulting GFPuv expression to the control case where only the inducer was added. If GFPuv expression were cAMP sensitive, then the level of expression would increase in a cAMP-containing culture relative to the control culture. Furthermore, the extent of the increase would be more pronounced as the amount of cAMP supplied exogenously was increased, because cells are very permeable to cAMP (25).
The second experiment was performed by adding glucose to an induced JM101 culture that was growing on glycerol for several generations. Due to catabolite repression, E. coli preferentially consumes glucose over glycerol. Therefore, glycerol consumption will cease after glucose addition, and the cAMP concentration in the cells should decrease. If GFPuv expression reports on cAMP concentration, this decrease in cAMP should be marked by a decrease in the RFU/OD.
Figure 5 shows the results of these experiments. In Fig. 5A, GFPuv expression increased when the amount of exogenous cAMP added was increased. This indicates that GFPuv expression can report on changes in cAMP concentration on the order of 1 mM if complete equilibration occurs. In Fig. 5B, the RFU/OD first increased, then decreased, and finally increased again. The initial increase occurred simply due to induction. The decrease occurred shortly after glucose addition, as expected. The final increase occurred after glucose exhaustion, as the remainder of the glycerol was consumed and cAMP levels rose in accord with relieved catabolite repression. These results (Fig. 5B) demonstrate that GFPuv expression can effectively report on intracellular cAMP concentrations over the range that reflects low to high catabolite repression (i.e., strong to weak activation of Plac).
FIG. 5.
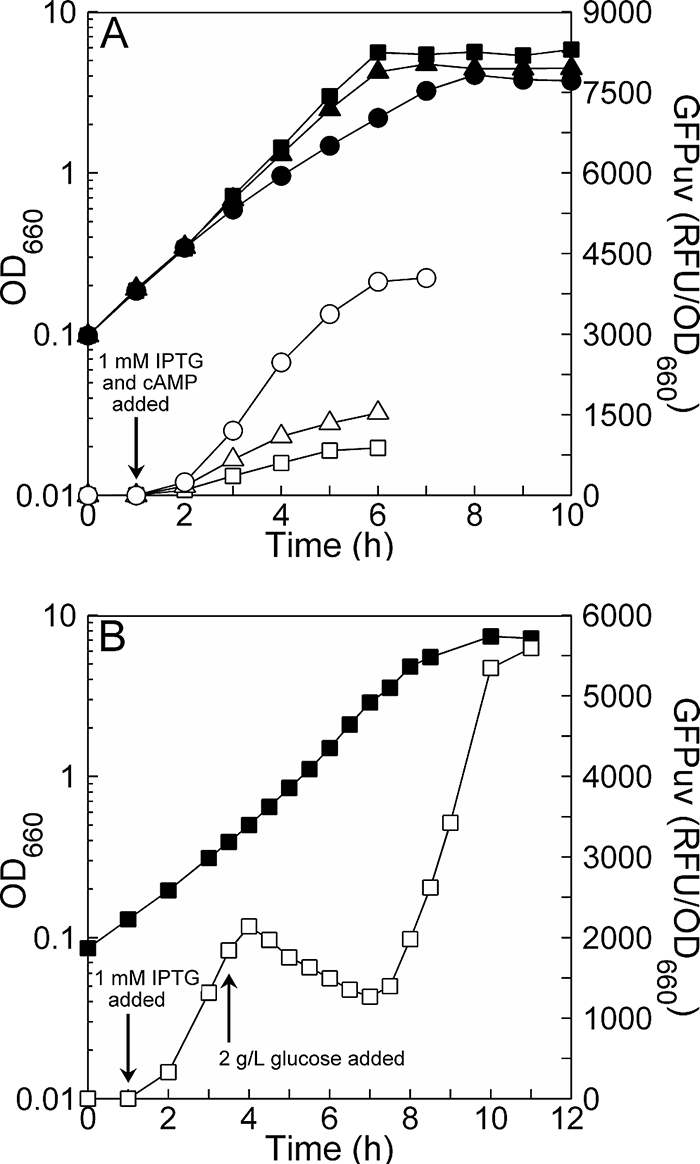
Verification that GFPuv expression reports on cAMP levels. (A) The effect of exogenous cAMP addition. Growth (filled symbols) and induced GFPuv production through stationary phase (open symbols) are shown for three different cases of exogenous cAMP addition: 0 mM (squares), 1 mM (triangles), and 5 mM (circles). (B) The effect of hierarchical carbon source utilization. Growth (filled squares) and induced GFPuv production (open squares) are shown for JM101 grown in M9 plus 5.1 g/liter glycerol (high intracellular cAMP) with glucose added to 2 g/liter at 3.5 h (low intracellular cAMP). Carbon source usage switches from glycerol to glucose at this point but switches back to glycerol upon glucose exhaustion at 7 h, with the remainder of the glycerol consumed by 10 h as the culture becomes stationary. The yield of JM101 on glucose is 1 OD unit per 1 g/liter of glucose; hence, glucose exhaustion occurs after the OD has increased by 2 units from the OD at 3.5 h.
Intrinsic GFPuv synthesis rates and promoter activation.
The validated GFPuv reporter system was used to ascertain whether the observed analytical elevation of cAMP in PB25 relative to JM101 (Fig. 3) was significant at the level of enhancing gene expression. Because PB25 was found to maintain substantially more plasmid DNA than JM101 (Table 1), relative differences in GFPuv expression between these strains could not be used alone to compare the extent to which each provided cAMP-enabled transcriptional activation of Plac. Instead, each strain's relative intrinsic rate of GFPuv synthesis was normalized by its copy number to determine the relative extent of promoter activation. Otherwise, if PB25 were found to exhibit higher GFPuv expression than JM101, for example, this might be mistakenly attributed to cAMP elevation, whereas it simply may have resulted from an increased plasmid copy number.
Thus, both the intrinsic GFPuv synthesis rates and plasmid copy numbers were measured in cultures of JM101 and PB25 that were growing exponentially on glucose. These measurements were also made for two controls. First, glycerol-grown JM101 was used as a high-cAMP control (see also Fig. 3), and its resulting per gene promoter activation was assumed to represent the case of strong Plac activation. This provided a contrast to the results for glucose-grown JM101, which were assumed to reflect weak Plac activation. As a second control, Plac in PB25 was mutated to PL8UV5, which is cAMP insensitive and about fourfold stronger than Plac when these two promoters are compared for growth on either glucose-6-phosphate (37) or glucose (21). That is, the strength of PL8UV5 corresponds to about that of Plac when cAMP is ample (i.e., Plac with glycerol). This control obviates any potential pitfalls that may accompany making comparisons across experiments performed with different carbon courses. Moreover, it remedies the inability to examine Plac activation in PB25 for growth on glycerol, as the Pyk mutations are lethal on this carbon source.
Table 2 summarizes how the GFPuv synthesis rate, copy number, and per gene promoter activation in glucose-grown PB25 with Plac compared to those of glucose-grown JM101 and the two controls. Values are shown on a relative basis, and the intrinsic GFPuv synthesis rates were determined from induction data (Fig. 2) using equation 2. When accounting for the effect of copy number, the extent of Plac activation by glucose-grown PB25 was much closer to the case of weak Plac activation (JM101/Plac/glucose) than to the two control cases for strong Plac activation (JM101/Plac/glycerol and PB25/PL8UV5/glucose). Thus, we conclude that the analytically elevated cAMP level in PB25 (Fig. 3) is not sufficient to elicit significantly enhanced gene expression. Rather, GFPuv expression is largely driven by copy number when controlled by Plac.
TABLE 2.
Relative GFPuv expression, copy number, and Plac activation or PL8UV5 strength
| Strain | Promoter | Carbon source | Relative intrinsic GFPuv synthesis ratea | Relative plasmid copy no.a | Relative promoter activationb |
|---|---|---|---|---|---|
| JM101 | Plac | Glucose | 1 | 1c | 1 |
| JM101 | Plac | Glycerol | 7.9 | 1.2 | 6.6 |
| PB25 | Plac | Glucose | 2.1 | 3.0 | 0.7 |
| PB25 | PL8UV5 | Glucose | 14 | 2.7 | 5.2 |
Values are reported relative to those in the first row of data (i.e., JM101, Plac, and glucose).
Relative intrinsic synthesis rate divided by relative plasmid copy number.
The actual value was 111 ± 11 (four replicates).
DISCUSSION
One of the two hypotheses has been confirmed; namely, PB25 maintains more plasmid DNA than wild-type JM101. When expressing GFPuv, PB25 has threefold more plasmid than JM101 (Table 2). When not expressing GFPuv, PB25 has fourfold more plasmid than JM101 (Table 1, 37°C data). The difference between cells that express GFPuv and those that do not may arise from the latter being able to allocate more metabolic resources into plasmid synthesis. For each strain, the copy number increases severalfold after shifting the temperature from 37 to 42°C (Table 1), which agrees well with previous studies on strains carrying pUC-based plasmids (7, 17). Moreover, the copy number sustained by PB25 at 37°C exceeds the value JM101 attains after four generations have elapsed following the temperature shift.
The copy number results are interesting from several standpoints. First, plasmids employing the pUC ori are routinely used in processes that produce therapeutic DNA for gene therapies and vaccines because of their high copy number and temperature sensitivity (7). Pyk deletion further amplifies plasmid content in PB25 while the growth rate at 37°C is reduced by only 22% of the parent strain value (Table 1). The growth rate difference between the strains is only 8% at 42°C while PB25 contains considerably more plasmid. Thus, it may be an advantageous mutation to incorporate in therapeutic plasmid DNA production strains. Such a strategy may offer an alternative to medium optimization (7, 38) because the purchase, inventory, and mixing of medium adjuncts such as amino acids are not required. Alternately, abolishing Pyk activity may be a useful mutation to employ to develop a host strain for producing a plasmid that has been engineered to have even weaker control over copy number.
Second, the fluxes within PB25 can be viewed as combining and accentuating the adaptations wild-type E. coli makes when maintaining high-copy-number plasmids. As noted earlier, these adaptations include increased flux through Ppc and Zwf in conjunction with diminished Pyk flux (2, 12, 27). Prior to plasmid introduction and compared to the wild type, PB25 presents such a flux pattern (Fig. 1). The copy number results thus suggest that eliminating Pyk pre-positions the fluxes in a manner that is more amenable to plasmid production than that the wild type can achieve. Additionally, the flux pattern of PB25 is marked by low acetate production, which may offer the additional advantage of easier cultivation to high cell concentration through fed-batch feeding. Rather than controlling glucose feed at a low level to minimize acetate production, when a strain such as PB25 is used the main concern would be to ensure that adequate oxygen delivery occurs.
This work also indicates that the level of cAMP in E. coli increases in response to Pyk deletion for growth on glucose (Fig. 3). This result supports the proposed effect of an increased PEP/pyruvate ratio (15, 28). However, the cAMP level in glucose-grown PB25, although higher than that in JM101 for growth on the strong catabolite repressor glucose, is much less than that in JM101 for growth on the weak catabolite repressor glycerol (Fig. 3). Because typically a 10-fold or more increase in a regulatory molecule or a messenger is required to induce a marked regulatory effect, we conclude that the elevation of cAMP in PB25 is not sufficient for significantly enabling the expression of catabolically repressed genes. The results in Table 2 are also consistent with the conclusion that cAMP is not elevated enough to foster enhanced gene expression. They indicate that the intrinsic rate of GFPuv synthesis in PB25 appears to be driven more by the plasmid copy number than the activation of Plac by cAMP. This may also explain why the measured activities of several cAMP-CRP-controlled enzymes were found to be near or modestly above the wild-type levels in a mutant deficient in the dominant Pyk isozyme (35, 36).
The interpretation of the results shown in Table 2, however, is based on combining plasmid copy number and protein synthesis measurements, which are determined on different bases. That is, the plasmid copy numbers are measured on a per genomic DNA mass basis. In contrast, the intrinsic rates of GFPuv synthesis are on a per cell mass basis (i.e., OD). Combing data on different bases can introduce errors if data are acquired from cells in different growth stages or from those growing at vastly different growth rates. Slow- versus fast-growing cells will, for example, differ in their genome equivalents per unit cell mass (5). We suggest that reliable conclusions can be made from the results in Table 2 for three reasons.
First, the genomic mass/cell mass ratio typically varies twofold when the growth rate changes by fivefold, and switching from minimal to complex medium is required to obtain such a large growth rate range (5). In contrast, all data were obtained for exponentially growing cells, and the growth rate differences were in the range of 0.1 to 0.2 h−1; hence, compositional and other differences would be expected to be small. To explore this further, the first step in determining a given relative promoter activation for Table 2 was to calculate the ratio of two independently measured quantities, (i) the intrinsic value of GFPuv synthesis rs and (ii) plasmid content (the plasmid mass/genomic mass ratio). As noted in Materials and Methods, when cell samples were obtained at equivalent OD values and then analyzed for plasmid content, the sizes of the genomic bands varied little. Thus, the genomic mass/OD ratio varied little across the experiments, implying that the OD and genomic mass bases are interchangeable with little error in this case. That is, a fixed constant can with good accuracy transform the plasmid mass/genomic mass ratio to the plasmid mass/OD ratio across all of the experiments. In the second step, the values of the ratios were normalized to the value exhibited by JM101 with Plac when grown on glucose. The range of normalized values is much greater than the small sample-to-sample variation in the genomic mass/OD ratios. Thus, a given relative promoter activation value in Table 2 represents well the value of the intrinsic rate of GFPuv synthesis per promoter relative to that of JM101 growing on glucose, where GFPuv expression is under the control of Plac. Overall, confounding effects are not significant in this case because intrinsic rates were determined in exponentially growing cells, which exhibit small variations in genomic DNA content.
Second, the values determined for the relative promoter activation (Table 2) compare reasonably well to other reported values. For example, the value found for glycerol-grown JM101 with Plac was 6.6. This result agrees well with a prior report that showed 6.7-fold-greater β-galactosidase expression occurs from Plac during growth on glycerol relative to that on glucose-6-phosphate (37), which is similar to glucose in repressive strength (29). Prior work also indicated that PL8UV5 is about fourfold stronger than Plac when both are compared for growth on glucose (21). The value we determined (5.2) compares reasonably well with the reported value, and as one would expect, the value falls between 1.0 (weakly activated Plac) and 6.6 (fully activated Plac) but closer to the latter, as it was designed to do.
Finally, how PB25 performed when Plac was replaced by PL8UV5 strongly and independently supports the conclusion made from the data in Table 2. For only a modest variation in the measured copy number, GFPuv expression in PB25 was about sevenfold greater from the cAMP-insensitive PL8UV5 than from the cAMP-sensitive Plac. This result clearly indicates that expression from Plac is not highly enabled by the cAMP concentration present within glucose-grown PB25.
To conclude, we suggest a mechanistic interpretation of the cAMP results presented in Fig. 3 and the outcomes shown in Table 2. As noted earlier, we observed an elevation of cAMP in PB25, which is in accord with the proposed effect of the PEP/pyruvate ratio (15, 28). Thus, we suggest that in addition to serving as an ATP-generating link between glycolysis and the TCA cycle, the pyruvate-producing activity of Pyk may help to “manage” the PTS (Fig. 6). Overall, the thermodynamic irreversibility of Pyk couples with the chain of reversible PTS reactions (39) to sway the net outcome. The first PTS reaction uses PEP to reversibly phosphorylate PTS enzyme I, producing pyruvate. Without Pyk, the PEP/pyruvate ratio increases. With lessened “back pressure” on the phosphorylation reaction, a greater fraction of PTS enzyme I may be phosphorylated. As phosphate reversibly transfers along the chain of protein carriers, the outcome will be increased abundance of IIAGlc ∼ P. Since IIAGlc ∼ P is a key participant in AC activation (28), elevated cAMP levels can result. This scenario contrasts with the case where Pyk activity is high and abundant glucose scavenges a lower level of IIAGlc ∼ P, with the result that AC activation is highly suppressed. Thus, it appears that for aerobic growth on glucose, Pyk expression plays a role in maintaining cAMP at a low level, thereby ensuring tighter control over genes that are transcriptionally regulated by cAMP-CRP than might be accomplished if the irreversibility provided by Pyk were absent.
FIG. 6.

Proposed involvement of pyruvate kinase in catabolite repression. Pyk provides a thermodynamic irreversibility that maintains the PEP/pyruvate ratio at a level that results in low glucose-specific PTS enzyme IIA (IIAGlc) phosphorylation, low AC activity, and tight cAMP-mediated catabolite repression. Without Pyk, there is more phosphorylated IIAGlc and correspondingly leakier catabolite repression. Abbreviations, in addition to those also used in Fig. 1, are the following: EI, PTS enzyme I; HPr, PTS heat-stable, histidyl-phosphorylatable protein; IIBCGlc, glucose-specific PTS enzyme IIBCGlc.
Acknowledgments
This work was developed in part by grants BES-0224603 and BES-0118961 from the National Science Foundation. D.S.C. was supported by NIH grant T32GM65100-01A1 and by an award from the Pennsylvania Infrastructure Technology Alliance (PITA).
The results presented here represent the efforts and conclusions of the authors and not those of the supporting entities.
Edwin Minkley (Carnegìe Mellon) provided some helpful insights that contributed to the results reported for PB25.
Footnotes
Published ahead of print on 27 February 2009.
REFERENCES
- 1.Arditti, R. R., J. G. Scaife, and J. R. Beckwith. 1968. The nature of mutants in the lac promoter region. J. Mol. Biol. 38421-426. [DOI] [PubMed] [Google Scholar]
- 2.Birnbaum, S., and J. E. Bailey. 1991. Plasmid presence changes the relative levels of many host cell proteins and ribosome components in recombinant Escherichia coli. Biotechnol. Bioeng. 37736-745. [DOI] [PubMed] [Google Scholar]
- 3.Blangy, D., H. Buc, and J. Monod. 1968. Kinetics of the allosteric interactions of phosphofructokinase from Escherichia coli. J. Mol. Biol. 3113-35. [DOI] [PubMed] [Google Scholar]
- 4.Buhler, B., B. Witholt, B. Hauer, and A. Schmid. 2002. Characterization and application of xylene monooxygenase for multistep biocatalysis. Appl. Environ. Microbiol. 68560-568. [DOI] [PMC free article] [PubMed] [Google Scholar]
- 5.Cox, R. A. 2004. Quantitative relationships for specific growth rates and macromolecular compositions of Mycobacterium tuberculosis, Streptomyces coelicolor A3(2) and Escherichia coli B/r: an integrative theoretical approach. Microbiology 1501413-1426. [DOI] [PubMed] [Google Scholar]
- 6.Crameri, A., E. A. Whitehorn, E. Tate, and W. P. C. Stemmer. 1996. Improved green fluorescent protein by molecular evolution using DNA shuffling. Nat. Biotechnol. 14315-319. [DOI] [PubMed] [Google Scholar]
- 7.Danquah, M., and G. Forde. 2008. Development of a pilot-scale bacterial fermentation for plasmid-based biopharmaceutical production using a stoichiometric medium. Biotechnol. Bioprocess. Eng. 13158-167. [Google Scholar]
- 8.Dickson, R. C., J. Abelson, and P. Johnson. 1977. Nucleotide sequence changes produced by mutations in the lac promoter of Escherichia coli. J. Mol. Biol. 11165-75. [DOI] [PubMed] [Google Scholar]
- 9.Emmerling, M., M. Dauner, A. Ponti, J. Fiaux, M. Hochuli, T. Szyperski, K. Wuthrich, J. E. Bailey, and U. Sauer. 2002. Metabolic flux responses to pyruvate kinase knockout in Escherichia coli. J. Bacteriol. 184152-164. [DOI] [PMC free article] [PubMed] [Google Scholar]
- 10.Epstein, W., L. B. Rothman-Denes, and J. Hesse. 1975. Adenosine 3′:5′-cyclic monophosphate as mediator of catabolite repression in Escherichia coli. Proc. Natl. Acad. Sci. USA 722300-2304. [DOI] [PMC free article] [PubMed] [Google Scholar]
- 11.Fieschko, J., and T. Ritch. 1986. Production of human alpha consensus interferon in recombinant Escherichia coli. Chem. Eng. Commun. 45229-240. [Google Scholar]
- 12.Flores, S., R. de Anda-Herrera, G. Gosset, and F. G. Bolivar. 2004. Growth-rate recovery of Escherichia coli cultures carrying a multicopy plasmid, by engineering of the pentose-phosphate pathway. Biotechnol. Bioeng. 87485-494. [DOI] [PubMed] [Google Scholar]
- 13.Fry, B., T. Zhu, M. M. Domach, R. R. Koepsel, C. Phalakornkule, and M. M. Ataai. 2000. Characterization of growth and acid formation in a Bacillus subtilis pyruvate kinase mutant. Appl. Environ. Microbiol. 664045-4049. [DOI] [PMC free article] [PubMed] [Google Scholar]
- 14.Gilbert, W. 1976. Starting and stopping sequences for RNA polymerase, p. 193-205. In M. Chamberlin and R. Losick (ed.), RNA polymerase. Cold Spring Harbor Laboratory, Cold Spring Harbor, NY.
- 15.Hogema, B. M., J. C. Arents, R. Bader, K. Eijkemans, H. Yoshida, H. Takahashi, H. Aiba, and P. W. Postma. 1998. Inducer exclusion in Escherichia coli by non-PTS substrates: the role of the PEP to pyruvate ratio in determining the phosphorylation state of enzyme IIAGlc. Mol. Microbiol. 30487-498. [DOI] [PubMed] [Google Scholar]
- 16.Holms, W. H. 1986. The central metabolic pathways of Escherichia coli: relationship between flux and control at a branch point, efficiency of conversion to biomass, and excretion of acetate. Curr. Top. Cell. Regul. 2869-105. [DOI] [PubMed] [Google Scholar]
- 17.Lin-Chao, S., W. T. Chen, and T. T. Wong. 1992. High copy number of the pUC plasmid results from a Rom/Rop-suppressible point mutation in RNA II. Mol. Microbiol. 63385-3393. [DOI] [PubMed] [Google Scholar]
- 18.Luli, G. W., and W. R. Strohl. 1990. Comparison of growth, acetate production, and acetate inhibition of Escherichia coli strains in batch and fed-batch fermentations. Appl. Environ. Microbiol. 561004-1011. [DOI] [PMC free article] [PubMed] [Google Scholar]
- 19.Majewski, R. A., and M. M. Domach. 1990. Simple constrained-optimization view of acetate overflow in E. coli. Biotechnol. Bioeng. 35732-738. [DOI] [PubMed] [Google Scholar]
- 20.Malcovati, M., and H. L. Kornberg. 1969. Two types of pyruvate kinase in Escherichia coli K12. Biochim. Biophys. Acta 178420-423. [DOI] [PubMed] [Google Scholar]
- 21.Mandecki, W., R. A. Goldman, B. S. Powell, and M. H. Caruthers. 1985. lac up-promoter mutants with increased homology to the consensus promoter sequence. J. Bacteriol. 1641353-1355. [DOI] [PMC free article] [PubMed] [Google Scholar]
- 22.Mandel, M., and A. Higa. 1970. Calcium-dependent bacteriophage DNA infection. J. Mol. Biol. 53159-162. [DOI] [PubMed] [Google Scholar]
- 23.Maniatis, T., E. F. Fritsch, and J. Sambrook. 1982. Molecular cloning: a laboratory manual. Cold Spring Harbor Laboratory, Cold Spring Harbor, NY.
- 24.Marr, A. G., and L. Marcus. 1962. Kinetics of induction of mannitol dehydrogenase in Azotobacter agilis. Biochim. Biophys. Acta 6465-82. [Google Scholar]
- 25.Matin, A., and M. K. Matin. 1982. Cellular levels, excretion, and synthesis rates of cyclic AMP in Escherichia coli grown in continuous culture. J. Bacteriol. 149801-807. [DOI] [PMC free article] [PubMed] [Google Scholar]
- 26.Messing, J. 1979. A multipurpose cloning system based on the single-stranded DNA bacteriophage M13. Recombinant DNA Tech. Bull. NIH 243-48. [Google Scholar]
- 27.Ow, D. S.-W., P. M. Nissom, R. Philp, S. K.-W. Oh, and M. G.-S. Yap. 2006. Global transcriptional analysis of metabolic burden due to plasmid maintenance in Escherichia coli DH5α during batch fermentation. Enzyme Microb. Technol. 39391-398. [Google Scholar]
- 28.Park, Y. H., B. R. Lee, Y. J. Seok, and A. Peterkofsky. 2006. In vitro reconstitution of catabolite repression in Escherichia coli. J. Biol. Chem. 2816448-6454. [DOI] [PubMed] [Google Scholar]
- 29.Pastan, I., and R. Perlman. 1970. Cyclic adenosine monophosphate in bacteria. Science 169339-344. [DOI] [PubMed] [Google Scholar]
- 30.Phalakornkule, C., S. Lee, T. Zhu, R. Koepsel, M. M. Ataai, I. E. Grossmann, and M. M. Domach. 2001. A MILP-based flux alternative generation and NMR experimental design strategy for metabolic engineering. Metab. Eng. 3124-137. [DOI] [PubMed] [Google Scholar]
- 31.Ponce, E. 1999. Effect of growth rate reduction and genetic modifications on acetate accumulation and biomass yields in Escherichia coli. J. Biosci. Bioeng. 87775-780. [DOI] [PubMed] [Google Scholar]
- 32.Ponce, E., N. Flores, A. Martinez, F. Valle, and F. Bolivar. 1995. Cloning of the two pyruvate kinase isoenzyme structural genes from Escherichia coli: the relative roles of these enzymes in pyruvate biosynthesis. J. Bacteriol. 1775719-5722. [DOI] [PMC free article] [PubMed] [Google Scholar]
- 33.Ponce, E., A. Martinez, F. Bolivar, and F. Valle. 1998. Stimulation of glucose catabolism through the pentose pathway by the absence of the two pyruvate kinase isoenzymes in Escherichia coli. Biotechnol. Bioeng. 58292-295. [DOI] [PubMed] [Google Scholar]
- 34.Pushnova, E. A., M. Geier, and Y. S. Zhu. 2000. An easy and accurate agarose gel assay for quantitation of bacterial plasmid copy numbers. Anal. Biochem. 28470-76. [DOI] [PubMed] [Google Scholar]
- 35.Siddiquee, K. A. Z., M. J. Arauzo-Bravo, and K. Shimizu. 2004. Effect of a pyruvate kinase (pykF-gene) knockout mutation on the control of gene expression and metabolic fluxes in Escherichia coli. FEMS Microbiol. Lett. 23525-33. [DOI] [PubMed] [Google Scholar]
- 36.Siddiquee, K. A. Z., M. J. Arauzo-Bravo, and K. Shimizu. 2004. Metabolic flux analysis of pykF gene knockout Escherichia coli based on 13C-labeling experiments together with measurements of enzyme activities and intracellular metabolite concentrations. Appl. Microbiol. Biotechnol. 63407-417. [DOI] [PubMed] [Google Scholar]
- 37.Silverstone, A. E., R. R. Arditti, and B. Magasanik. 1970. Catabolite-insensitive revertants of lac promoter mutants. Proc. Natl. Acad. Sci. USA 66773-779. [DOI] [PMC free article] [PubMed] [Google Scholar]
- 38.Wang, Z., G. Le, Y. Shi, and G. Wegrzyn. 2001. Medium design for plasmid DNA production based on stoichiometric model. Process Biochem. 361085-1093. [Google Scholar]
- 39.Weigel, N., M. A. Kukuruzinska, A. Nakazawa, E. B. Waygood, and S. Roseman. 1982. Sugar transport by the bacterial phosphotransferase system. Phosphoryl transfer reactions catalyzed by enzyme I of Salmonella typhimurium. J. Biol. Chem. 25714477-14491. [PubMed] [Google Scholar]
- 40.Yagil, G., and E. Yagil. 1971. On the relation between effector concentration and the rate of induced enzyme synthesis. Biophys. J. 1111-27. [DOI] [PMC free article] [PubMed] [Google Scholar]
- 41.Zhu, T., C. Phalakornkule, R. R. Koepsel, M. M. Domach, and M. M. Ataai. 2001. Cell growth and by-product formation in a pyruvate kinase mutant of E. coli. Biotechnol. Prog. 17624-628. [DOI] [PubMed] [Google Scholar]