

Abstract
The tumor-suppressive role of p53 at the level of tumor initiation is well documented. It has also been shown previously that p53 acts against tumor progression/metastasis. However, its role in modulating cell migration and invasion leading to metastasis is poorly understood. In this study, using vascular smooth muscle cells and NIH 3T3 fibroblast cells, we have shown that p53 potently suppresses Src-induced podosome/rosette formation, extracellular matrix digestion, cell migration, and invasion. The overexpression of exogenous wild-type p53 or the activation of the endogenous p53 function suppresses, while the short hairpin RNA-mediated knockdown of p53 expression or the blocking of its function exacerbates, Src-induced migratory and invasive phenotypes. We have also found that p53 expression and function are downregulated in cells stably transformed with constitutively active Src that exhibit aggressive invasive properties. Lastly, p53 upregulates the expression of caldesmon, an actin-binding protein that has been shown to be an inhibitor of podosome/invadopodium formation. The ability of p53 to suppress Src phenotypes in transformed cells was largely abolished by knocking down caldesmon. This study reports a novel molecular mechanism (caldesmon), as well as a structural basis (podosomes/rosettes), to show how p53 can act as an anti-motility/invasion/metastasis agent.
p53 is one of the most important tumor suppressors and executes its tumor-suppressive role through well-established mechanisms such as cell cycle arrest/repair, apoptosis, and senescence (4, 8, 10, 33, 45). About one-half of tumor cells have somewhat compromised p53 function (29). The loss of p53 function is also implicated in the evolution of highly invasive/metastatic cancers (25, 32, 34, 40). However, relatively little is known about the roles of p53 in cell migration and invasion, the other defining characteristics of invasive cancer cells (46). Recently, p53 has been shown to prevent Cdc42-dependent filopodium formation in fibroblast cells (19) and to negatively modulate RhoA-dependent cell polarization and amoeboid cell movement (18).
Podosomes and invadopodia are dynamic cellular protrusions found in different cell types and are associated with cell motility and cellular invasion (21, 35, 52, 55). Cells transformed with Src typically express protrusions that possess characteristics akin to both podosomes and invadopodia (2, 35); they either exist as individual podosomes or, by unknown mechanisms, aggregate to form rings of podosomes, known as rosettes (1). The very ability of these structures not only to provide cells with mechanical thrust/propulsion but also to cause extensive extracellular matrix (ECM) degradation led them to be perceived as one of the most important appendages of migratory/invasive cells, especially in the context of metastatic cancer cells (11, 51, 52, 56). However, the formation of these structures involves extensive cytoskeletal reorganization (22, 35).
Caldesmon is a calmodulin- and actin-binding protein (48) whose roles in modulating the dynamics of the actin cytoskeleton and contractility during cell movement are well documented (23, 26). We and others (14, 24, 39) have recently shown that caldesmon negatively regulates the formation of podosomes and rosettes by vascular smooth muscle cells (SMC) transformed with Src. Caldesmon expression is downregulated in transformed cells and cancer cells (43, 47, 49) and is inversely correlated with metastatic frequency in malignant melanoma (30). In addition, caldesmon is implicated in the suppression of cancer cell invasion (57). These reports suggest an anti-migratory/invasive role of caldesmon in cancer cells. However, very little about the regulation of caldesmon expression in normal and cancer cells is known.
Here, we report a novel mechanism through which p53 exercises potent anti-invasive functions by suppressing podosome/rosette formation and cell invasion via the upregulation of caldesmon expression. We have used rat aortic SMC and NIH 3T3 fibroblast cells stably transduced with SrcY527F as study models. Both cell types produce prominent rosettes of podosomes, providing an ideal background for studying the effects of p53 on the migratory/invasive phenotypes.
MATERIALS AND METHODS
Plasmid constructs/shRNAs.
The gene for constitutively active Src (SrcY527F), described earlier (58), was subcloned from pBabe vector into pWZL-Hygro retroviral vector (37) using BamHI-SalI. Wild-type (wt) murine p53 was described previously (12). A wt caldesmon expression plasmid (expressing enhanced green fluorescent protein [EGFP]-wt caldesmon) was generated as described earlier (14). The short hairpin RNAs (shRNAs) were generated using a mir-30-based design described previously (44). For the cloning and expression of shRNAs, either a regulated TMP or a constitutive LMP vector system (Open Biosystems) was used. Every shRNA sequence was chosen such that it targets both rat and mouse transcripts. Two shRNAs each for p53 (rat, NM_030989, and mouse, NM_011640) and caldesmon (rat, NM_013146, and mouse, NM_145575) were generated. The target/sense sequences used for designing shRNAs were as follows: for p53, 5′-GTC(A/T)GGGACAGCCAAGTCTGT-3′ and 5′-CG(T/C)GCCATGGCCATCTACAAG-3′; and for caldesmon, 5′-GGAGAATTCATGACCCACAAA-3′ and 5′-GGAACCTCTGGGAAAAGCAAT-3′. The degeneracy shown on p53 shRNA target sequences is for the rat and mouse genes, respectively.
Different promoter-luciferase gene constructs containing the p53 response elements for the genes MDM2, BAX, and PUMA were a generous gift of M. Oren, Weizmann Institute of Science, Rehovot, Israel.
Cell culturing and retroviral transduction.
Primary rat aortic SMC, NIH 3T3 cells, and A7r5 vascular SMC were cultured in high-glucose Dulbecco's modified Eagle's medium (DMEM; Invitrogen) supplemented with 10% fetal bovine serum (HyClone) and 1% penicillin G-streptomycin sulfate (Invitrogen). All cell lines were grown at 37°C in the presence of 5% CO2. Retroviral infections were carried out as described previously (15). Infected SMC and NIH 3T3 cell lines were selected with 5 μg/ml of puromycin (Sigma), 100 μg/ml of hygromycin (Sigma), and 1 mg/ml of neomycin (Sigma) wherever applicable.
Antibodies, chemical inhibitors, and other reagents.
Antibodies to Src (05-185), β-PIX (AB3829), matrix metalloproteinase 2 (MMP2; MAB13405), and glyceraldehyde-3-phosphate dehydrogenase (GAPDH; MAB374) were purchased from Millipore, antibodies to p53 (2524 and 9282) and p53 phosphorylated at Ser15 (9284) were from Cell Signaling, those to MDM2 (M4308) and vinculin (V9131) were obtained from Sigma-Aldrich, the antibody to phosphorylated cortactin Y421 (pYCTN; 44-854G) was from Biosource, and that to caldesmon (610661) was from BD Biosciences. The Src inhibitor PP2 was from Calbiochem. The p53 inhibitor pifithrin-α (PFA), phorbol-12,13-dibutyrate (PDBu), and the genotoxic drug doxorubicin (Adriamycin) were purchased from Sigma-Aldrich.
Immunofluorescence imaging.
Cells were plated at a density of 1 × 10⁴ to 2 × 10⁴ cells per 12-mm-diameter glass coverslip (Fisher Scientific), which was precoated with 5 μg/ml fibronectin (Roche Applied Science). Subsequent processing of the cells and imaging were performed as described previously (14, 53) using the primary antibodies mentioned above and secondary Alexa Fluor 488- and Alexa Fluor 568-conjugated antibodies (Molecular Probes). Actin staining was performed by using Alexa Fluor 350-phalloidin (Molecular Probes) or tetramethyl rhodamine isocyanate (TRITC)- or fluorescein isothiocyanate-phalloidin (Sigma). Confocal images were taken on a Leica TCS-SP2 RS scanning laser confocal microscope equipped with a plan apochromatic 100×, 1.40-numerical-aperture oil immersion lens objective. Images were processed using ImageJ software (NIH). Epifluorescent images were captured using a Zeiss Axiovert S100 microscope equipped with a plan neofluar 63× or 40× 0.75-numerical-aperture lens objective, a high-performance charge-coupled device camera (Cooke SensiCam), and the Slidebook image analysis software (Intelligent Imaging Innovations). A cell was classified as forming podosomes if at least two punctate actin structures of at least 0.5 μm in diameter were present.
ECM digestion.
ECM invasion assays were performed as described previously (54). A cell was classified as invasive if at least one digested cavity was created in the migration path of the cell through the TRITC-fibronectin matrix. A minimum of 150 cells from each of three separate experiments were used for assessing cell invasion, and 30 cells were used for the calculation of the area of digestion. The area of digestion was determined by measuring the number of black pixels of a digestion image with Image Pro Plus 6 software and then converting the area in pixels into square micrometers.
Wound-healing cell migration assays.
Cells were seeded at densities of 1 × 10⁵ to 2 × 10⁵ on Delta-T dishes (Bioptechs) in normal growth medium. Once cells reached 100% confluence, the medium was replaced with DMEM lacking phenol red and containing HEPES (Invitrogen), supplemented with 10% fetal bovine serum or bovine growth serum (HyClone), for 1 h. Cells were then scratched using a 10-μl pipette tip and immediately taken for imaging. The dishes were layered with heavy mineral oil (Sigma) and kept at 37°C by using a ΔTC3 culture dish microobservation temperature control system (Bioptechs). Images were captured every 10 min for 15 h on a Zeiss Axiovert S100 microscope equipped with a plan neofluar 5× objective. Cell speed and distance were determined by tracking the number of pixels traveled using ImageJ software (NIH) and then converting the data into micrometers traveled.
Boyden chamber invasion assay.
A Matrigel invasion assay (BD Biosciences) was performed as recommended by the manufacturer. Cells (2.5 × 10⁴) in 500 μl of serum-free DMEM were added to Matrigel inserts (8-μm-pore screens containing Matrigel) and control inserts (8-μm-pore screens without Matrigel), and the inserts were incubated for 22 h at 37°C in 5% CO2. Invaded cells were fixed with 1.6% paraformaldehyde for 5 min, washed in phosphate-buffered saline, and stained with DAPI (4′,6-diamidino-2-phenylindole). The membranes were then cut out of the inserts and placed under a 12-mm coverslip with 20 μl of mounting medium (Dako). Cells in 10 different fields from both the control inserts and the Matrigel inserts were counted using a Zeiss Axiovert S100 microscope equipped with a plan neofluar 10× objective. To assess the percent invasion, the number of cells counted on Matrigel inserts was divided by the number of cells counted on the control inserts and multiplied by 100.
Western blot analyses.
Total cell proteins were prepared by lysing cells in sodium dodecyl sulfate (SDS) sample buffer (60 mM Tris-HCl, pH 6.8, 10% glycerol, 2% SDS, and 100 mM dithiothreitol) and boiling the lysate for 5 min. For Western blotting, 20 to 50 μg of total cell protein was separated on SDS-10 to 15% polyacrylamide gel electrophoresis gels and transferred onto polyvinylidene difluoride membranes (Millipore). We measured the levels of GAPDH to verify the loading of equal amounts of the different samples. The primary antibodies used were as mentioned above. Specific horseradish peroxidase-labeled secondary antibodies (Amersham, United Kingdom) were used, and signals were detected using enhanced chemiluminescence reagent (Millipore).
Semiquantitative reverse transcription-PCR (RT-PCR) assay.
Total RNA from cells was prepared using the reagents from a GeneElute kit according to the instructions of the manufacturer (Sigma). The pool of first-strand cDNAs was synthesized with a RevertAid H Minus first-strand synthesis kit (Fermentas) using total RNA as the template and random/oligo(dT) primers. The primers used for the PCR amplification of rat and mouse BAX genes (13), PUMA genes (41), and GAPDH genes (16) were described previously. The primers used for the amplification of rat and mouse MDM2 genes were as follows: 5′-AGGAGATGTGTTTGGAGTCCC-3′ and 5′-CTCAGCGATGTGCCAGAGTC-3′. We measured the levels of the GAPDH mRNAs to verify the amplification and loading of equal levels from the different samples.
Dual-luciferase assay.
For the luciferase assay, cells were plated at 0.5 × 10⁵ to 1.5 × 10⁵ cells per well in 24-well plates. Cells were transfected using the Lipofectamine Plus reagent system (Invitrogen) with 250 ng of the firefly luciferase reporter plasmid under the control of different p53 target gene promoters and 25 ng of the Renilla luciferase reporter plasmid under the control of the housekeeping β-globin gene promoter. Additional treatments of the cells are indicated wherever applicable. Cells were harvested 48 h posttransfection for analysis using a dual-luciferase assay kit (Promega, Madison, WI). Samples were read using an Lmax microplate luminometer (Sunnyvale, CA) in 96-well-plate format, and data acquisition was done by using SoftmaxPro software.
RESULTS
Constitutively active Src induces the formation of podosomes and rosettes and suppresses endogenous p53 in vascular SMC and NIH 3T3 cells.
To investigate the role of p53 in cell migration and invasion, we have generated smooth muscle and NIH 3T3 cell lines stably expressing constitutively active Src (SrcY527F) via retroviral transduction. Cells expressing empty vector (Fig. 1A and B) displayed prominent stress fibers with no podosomes, while close to 100% of the SrcY527F-expressing cells produced F-actin-staining podosomes and rosettes (Fig. 1C and D). Podosomes exist either as individual dots or, in about 20% of the cells, as aggregates to form intense actin-staining rosettes as described previously (1). As reported before (6, 9, 35), confocal microscopy confirmed that podosomes, which comprise vertical actin columns containing pYCTN, vinculin, and β-PIX (Fig. 1C to F and insets), were also associated with extensive ECM degradation and enhanced cell migration and invasion (see Fig. 3).
FIG. 1.

The stable expression of SrcY527F induces podosome/invadopodia, with the concomitant downregulation of endogenous p53. (A to F) Stable lines of SMC (A, C, and E) and NIH 3T3 cells (B, D, and F) expressing empty vector (control) (A and B) or SrcY527F (C to F) were established. Cells were cultured on fibronectin-coated coverslips overnight and immunostained for pYCTN (red) or stained with fluorescein isothiocyanate-phalloidin for F-actin (green) (A to D) or phalloidin for F-actin (blue), β-PIX (red), and vinculin (green) (E and F). Cell images were taken using a scanning laser confocal microscope. Insets (C to F) are x/z profiles and were taken at the line drawn through the cell in each respective panel. Each z axis is 4.6 μm in depth. Scale bars represent 20 μm. (G and H) Immunofluoresence microscopy analysis of SMC and NIH 3T3 cells stably expressing SrcY527F (SMC-SrcY527F and 3T3-SrcY527F) was performed. Cells were labeled with combinations of pYCTN (red) and p53 (green) antibodies. Scale bars represent 20 μm. Cells with altered p53 expression are indicated by white arrowheads. (I) Western blotting analysis carried out with the lysates from SMC and NIH 3T3 cells transduced with either empty vector (control) or SrcY527F expression constructs. The proteins probed for are as shown, and GAPDH was used as a loading control. (J) A semiquantitative RT-PCR technique was applied using total cellular RNA preparations from SMC lines treated as indicated. The relative abundance of p53 target gene transcripts is shown. Housekeeping GAPDH gene transcript levels were used as amplification and loading controls. (K) Promoter-luciferase activity assay conducted using SMC stably transduced with either empty vector or SrcY527F expression constructs. Relative luciferase activities from different promoters (as indicated) in SrcY527F-expressing cells were plotted against control cell activities (set at 1). The error bars represent standard deviations of results for three replicates, and * indicates a P value of <0.05 for the comparison to data for the respective controls.
FIG. 3.

p53 suppresses Src-induced ECM digestion, Matrigel invasion, and cell migration. (A to J) SMC and NIH 3T3 cells stably expressing SrcY527F (SMC-SrcY527F and NIH-3T3-SrcY527F) were treated as indicated. These cells were cultured on gelatin-coated coverslips layered with TRITC-fibronectin (TRITC-Fn) for 20 h. Cells either underexpressing p53 (those treated with shp53) or overexpressing wt p53 are indicated by white arrowheads. Scale bars represent 20 μm. (K and L) A quantitative approach to determine the area of ECM digestion for each cell type was taken. For 30 cells of each type the areas of digestion, in square micrometers, in the migration paths of the cells after 7 h were measured. (M) SMC or NIH 3T3 cells expressing the indicated constructs were examined to determine their abilities to invade Matrigel. The number of cells that migrated through the screen were counted, and the percent invasion was determined by dividing the number of invaded cells (Matrigel inserts) by the number of migrated cells (control inserts). (N) SMC or NIH 3T3 cells stably transduced with the indicated expression constructs were subjected to a scratch wound-healing assay. Time-lapse movies of SMC and NIH 3T3 cells were analyzed to determine the average migration speed of the wound front, in micrometers per hour. Error bars represent standard deviations of results from three separate experiments. P values were determined using a two-sided, equal-variance Student t test. * indicates a P value of <0.05.
We then asked if Src induces the formation of podosomes and rosettes by suppressing the p53 functions. Unlike most cancer cell lines, the cell lines used for this study express endogenous functional p53. This feature allows us to examine whether the stable expression of SrcY527F affects the functional status of the endogenous p53. As shown in Fig. 1G and H, SMC or NIH 3T3 cells expressing high levels of the Src activation marker pYCTN (7) displayed reduced nuclear p53 staining, which is indicative of the transcriptionally active form of p53. Of note, the levels of pYCTN directly correlated with the numbers of podosomes and rosettes borne by the cells and inversely correlated with the levels of nuclear p53 (see Fig. S1 in the supplemental material). This finding is consistent with Western blot analyses that showed a reduction in the levels of p53, as well as those of its target protein MDM2, in SMC and NIH 3T3 cells transduced to express SrcY527F (Fig. 1I). Furthermore, the cellular mRNA levels for bona fide p53 target genes, namely, MDM2, BAX, and PUMA (3, 28, 38), in SrcY527F-expressing cells were also downregulated compared to those in non-Src-expressing (vector control) derivatives of SMC (Fig. 1J), thus suggesting suppressed p53 function in the cells. Additionally, the mRNA levels, in most cases, were found to be comparable to the control levels when Src function was inhibited by PP2, indicating the alleviation of the Src-mediated suppression of p53 (Fig. 1J). In addition, we carried out luciferase reporter assays in a dual-luciferase assay system using constructs containing promoters of known p53 target genes, MDM2, BAX, and PUMA. As shown in Fig. 1K, the relative luciferase activities for all the promoters in cells transduced with SrcY527F were significantly reduced compared to those in control cells. These data are indicative of the definite suppression of endogenous p53 by Src and suggest that the suppression of p53 may be a prerequisite for Src-induced invasive phenotypes.
p53 inhibits the Src-induced formation of podosomes and rosettes.
Next, we asked whether a gain or loss of p53 function may affect the ability of cells transduced with SrcY527F to produce podosomes and rosettes. The enhancement of p53 function in cells with a stable SrcY527F background was achieved either by the overexpression of wt murine p53 or by treatment with the p53-activating drug doxorubicin (50). As shown in Fig. 2C and D, cells overexpressing wt p53 were marked by strong nuclear p53 staining and highly reduced numbers of podosomes compared to those displayed by SrcY527F-only control cells (cells without enhanced p53 function). Similarly, activating endogenous p53 by doxorubicin enhanced p53 translocation to the nucleus and inhibited the SrcY527F-induced formation of podosomes and rosettes in both SMC and NIH 3T3 cells (Fig. 2E and F; also see Fig. S2A in the supplemental material). Of note, the suppressive effect of p53 on rosette structure was more severe than that on dot-shaped individual podosomes. This observation is consistent with the finding that either the overexpression of wt p53 or doxorubicin treatment reduced the percentage of rosette-producing cells among SMC by over twofold and that among NIH 3T3 cells by fourfold (Fig. 2L and M). To attenuate p53 function, we either knocked down p53 expression with p53-targeting shRNAs (herein designated shp53) or inhibited p53 function with the chemical inhibitor PFA (31), which binds to p53 and interferes with its DNA-binding ability. The stable expression of one of the shRNAs, shp53-1, induced the knockdown of p53 expression in both cell types by over 70% (Fig. 2K) and was used for subsequent studies. As shown in Fig. 2G to J, the knockdown of p53 expression by shp53 or the inhibition of p53 activity by PFA led to a significant decrease in actin stress fibers, accompanied by a marked increase in the number of rosettes produced per cell. These effects were further illustrated by a considerable increase in the percentage of rosette-producing cells as a result of the shRNA-mediated knockdown of p53 or treatment with PFA (Fig. 2L and M; also see Fig. S2A in the supplemental material).
FIG. 2.

p53 is a suppressor of Src-induced podosomes/invadopodia. (A to J) SMC and NIH 3T3 cells stably expressing SrcY527F (SMC-SrcY527F and NIH-3T3-SrcY527F) were treated as indicated. Cells either underexpressing p53 (those treated with shp53) or overexpressing wt p53 are indicated by white arrowheads. (K) SMC and NIH 3T3 cell lines were retrovirally transduced with either empty vector (control) or two shRNAs designed against rat/mouse p53 targets. Selected cell populations were subjected to Western blot analysis to probe the levels of p53 protein. (L and M) A minimum of 100 individual cells of each type in three separate experiments were counted to determine the percentage of cells of each type bearing at least one rosette. Scale bars represent 20 μm. Error bars represent standard deviations of results from three separate experiments. * indicates a P value of <0.05.
Thus, p53 suppresses the ability of cells transformed with SrcY527F to produce podosomes and rosettes, known to be involved in extensive matrix degradation and invasiveness (17, 35). We have also observed a similar effect of p53 on the number of podosomes and rosettes per cell (see Fig. S2B and C in the supplemental material). In keeping with the above-described observations, Western blot analyses revealed that the ectopic expression of wt p53 indeed suppressed the levels of pYCTN and MMP2 induced by SrcY527F (see Fig. S2D in the supplemental material), which is also indicative of reduced podosome/rosette levels and/or activity.
These results, taken together, suggest strongly that p53 acts as a potent antagonist of Src-induced podosome/rosette formation in both SMC and NIH 3T3 cells.
p53 suppresses Src-induced ECM degradation, cell invasion, and cell migration.
It has been reported previously that the Src-induced formation of podosomes increases the ability of the cells to degrade and invade the ECM (17). This finding prompted us to investigate whether the effect of p53 on SrcY527F-induced podosome formation correlates with ECM degradation, cell invasion, and cell migration. As shown in Fig. 3A to F, K, and L, the overexpression of wt p53 or the activation of p53 with doxorubicin resulted in a significant reduction in the area of ECM degradation for both cell types. It is noteworthy that cells with higher levels of nuclear p53 expression (Fig. 3C and D) were associated with minimal or no ECM digestion. In contrast, the shRNA-mediated knockdown of p53 expression or the blocking of p53 function with PFA (Fig. 3G to J, K, and L) enhanced the SrcY527F-induced degradation of fibronectin substrates, which directly correlated with an increase in podosome/rosette formation in these cells as shown before (Fig. 2; also see Fig. S2 in the supplemental material). This effect also correlated with the reduced level of MMP2 seen (see Fig. S2D in the supplemental material) as a result of overexpressed wt p53.
Next, we examined whether p53's suppressive effect on Src-induced podosome formation also affected the invasiveness of the cells and/or cell movement. In an invasion assay using Matrigel substrates, we found that the overexpression of wt p53 effectively suppressed the Src-induced invasive phenotype. On the other hand, the knockdown of p53 with shp53 significantly increased the Src-induced invasiveness of both cell types (Fig. 3M). Cell movement was evaluated using wound-healing assays in which the speed of wound closure was measured. As shown in Fig. 3N, the stable expression of SrcY527F alone increased the speed of migration of the wound front, and the speed was further enhanced by the shp53-mediated knockdown of p53 but significantly attenuated by the overexpression of p53. These results indicate that increased p53 activity suppresses the Src-induced formation of podosomes and correlates with a reduction of ECM degradation, invasion of Matrigel, and cell migration.
p53 induces the expression of caldesmon, an actin-binding protein known to inhibit podosome formation.
We asked whether p53 regulates the remodeling of the cytoskeleton by regulating the expression of the ubiquitous actin-binding protein caldesmon, which is well documented to stabilize actin stress fibers and act as a podosome antagonist (14, 39). As shown in Fig. 4A, SMC and NIH 3T3 cells stably expressing p53-targeting shRNAs had reduced expression of p53, with a concomitant reduction of caldesmon expression. On the other hand, we also examined the effect of the activation of endogenous p53 by doxorubicin on caldesmon expression (Fig. 4B). Western blot analyses show that with the increase in p53 function, as indicated by the increased levels of p53 phosphorylated at Ser15 as well as p53-inducible MDM2 protein levels, there was a corresponding increase in caldesmon levels. Since doxorubicin is known to activate a number of other proteins involved in the DNA damage response pathway, we wanted to establish that the doxorubicin-induced caldesmon was due specifically to activated p53. As shown in Fig. 4B, the p53-specific inhibitor PFA almost completely abolished the increased caldesmon expression induced by doxorubicin in SMC.
FIG. 4.

p53 induces the expression of caldesmon. (A) SMC and NIH 3T3 cells were stably transduced with either vector control or shp53-1 expression constructs and subjected to Western blot analysis. Caldesmon protein levels directly correlate with the p53 levels in the cells. GAPDH was used as a loading control. (B) Induction of caldesmon as a result of the activation of endogenous p53. Cell lysates were prepared from primary SMC either treated with a fixed dose of the p53-activating drug doxorubicin (ADR; 500 ng/ml) for different durations as indicated or treated with different doses of doxorubicin and p53 inhibitor PFA as indicated. Cellular caldesmon levels, p53 levels and activity, and p53-inducible MDM2 protein levels were detected through Western blotting using antibodies as indicated. The GAPDH protein level was used as a loading control. Ser15-p53, p53 phosphorylated at Ser15. (C to H) Immunofluorescence study showing that enhanced p53 leads to a concomitant increase in caldesmon-stained stress fibers in SMC (C, E, and G) and NIH 3T3 cells (D, F, and H) transduced with SrcY527F (SMC-SrcY527F and NIH-3T3-SrcY527F). Cells with altered p53 status are indicated by white arrowheads. Scale bars represent 20 μm.
To further validate these observations, immunofluorescence microscopic images of cells with an SrcY527F background and either wt p53 overexpression or doxorubicin treatment are shown in Fig. 4C to H. Cells with higher levels of nuclear p53 staining, as a result of either the overexpression of wt p53 (Fig. 4C and D) or treatment with doxorubicin (Fig. 4E and F), consistently showed prominent caldesmon-decorated stress fibers. Doxorubicin treatment of cells stably expressing wt p53 further enhanced the nuclear localization of p53 and led to a matching increase in caldesmon-decorated stress fibers (Fig. 4G and H).
These results show that caldesmon expression correlates directly with the transcriptional function of p53 (Fig. 4 and Fig. 5B), suggesting that caldesmon may be a transcriptional target of p53. In addition, p53 promotes stress fiber stability (Fig. 4), suppresses podosome formation (Fig. 2), and attenuates cell migration/invasion (Fig. 3), likely by upregulating the expression of caldesmon.
FIG. 5.

p53 suppresses podosomes through the upregulation of caldesmon. (A and B) Immunoblot (A) and semiquantitative RT-PCR (B) analyses detecting the levels of caldesmon protein and mRNA in the cell lines as indicated. GAPDH was used either as a protein loading control (A) or as an RT-PCR amplification control (B). (C) Two shRNAs were designed to target both rat and mouse caldesmon (Cald) mRNAs. Retroviral vectors expressing the shRNAs shcaldesmon-1 and shcaldesmon-2 were stably introduced into both cell lines, along with empty vector as a control. The Western blot shows the shRNA-mediated knockdown of caldesmon in SMC and NIH 3T3 cells. (D to I) Effects of caldesmon on SrcY527F-induced podosome formation. The expression of wt caldesmon strongly suppresses Src-induced podosomes (D and E). The expression of wt caldesmon also reverses the phenotypic aggravation caused by p53 knockdown in SrcY527F-expressing cells (SMC-SrcY527F and NIH-3T3-SrcY527F) (F and G). On the other hand, the removal of caldesmon by the expression of caldesmon shRNAs in cells expressing SrcY527F and wt p53 relieves the p53-mediated suppression of podosome formation (H and I). Cells expressing wt caldesmon, wt p53, and shp53 are indicated by white arrowheads. Scale bars represent 20 μm. (J and K) For each condition, more than 100 cells were counted to determine the number of rosettes per cell and the number of cells with more than 10 podosomes (podosome- or invadopodium-like structures [PILS]; determined as the total number of punctate structures, including those present within rosette clusters) per cell (J). The area of digestion after 7 h on gelatin-coated coverslips layered with TRITC-labeled fibronectin was determined (K). The data were plotted relative to those for control cells expressing only SrcY527F. Error bars represent standard deviations of results from three separate experiments. Black asterisks denote P values of <0.05 for the comparison to data for cells expressing SrcY527F only, and red asterisks represent P values of <0.05 for the comparison to data for cells expressing SrcY527F and wt p53.
p53 suppresses Src-induced podosome formation by the upregulation of caldesmon.
We investigated if the upregulation of caldesmon by p53 may play a role in the p53-mediated inhibition of Src-induced podosome formation and the manifestation of the invasive phenotype. First, we showed that SrcY527F suppressed caldesmon expression in SMC and NIH 3T3 cells, in agreement with data previously reported (39, 49) (Fig. 5A). However, the expression of wt p53 in the cells with the SrcY527F background restored the caldesmon protein and mRNA levels fully in SMC and partially in NIH 3T3 cells (Fig. 5A and B). These results suggest that the Src-mediated suppression of cellular p53, as we have shown (Fig. 1), may result in the downregulation of caldesmon.
Next, we wanted to know whether the upregulation of caldesmon expression by p53 may play a role in p53-mediated suppression of the Src-induced formation of podosomes in general and rosettes in particular. In agreement with data in previous reports (14, 57) and as shown in Fig. 5, the overexpression of EGFP-caldesmon in SMC and 3T3 cells in an SrcY527F background reduced, not only the overall percentage of rosette-producing cells, but also the ability of these cells to form rosettes in a manner similar to that caused by the overexpression of wt p53 (Fig. 5D, E, and J). We designed two shRNAs targeting rat/mouse caldesmon transcripts and analyzed the level of knockdown through Western blotting as shown (Fig. 5C). The suppressive effect of wt p53 was largely abolished by the knockdown of caldesmon by shRNAs (Fig. 5H, I, and J). It is of note that the shRNA knockdown of caldesmon produced numerous podosomes and multiple rosettes, even in cells that expressed high levels of p53 (Fig. 5 H and I). In contrast, the overexpression of EGFP-wt caldesmon suppressed the formation of podosomes and rosettes, even in a p53 knockdown background (Fig. 5F and G). We further investigated whether the induction of caldesmon expression by p53 also affects ECM degradation. As shown in Fig. 5K, the knockdown of caldesmon in both SrcY527F-expressing SMC and SrcY527F-expressing NIH 3T3 cells overexpressing wt p53 promoted ECM digestion. In contrast, the expression of GFP-caldesmon in shp53-treated cells reduced ECM degradation strongly in Src-expressing NIH 3T3 cells but slightly in Src-expressing SMC. These results strongly indicate that caldesmon expression is a dominant downstream effector of p53 in determining the ability of cells to form podosomes/rosettes and digest ECM.
p53 also plays a role in phorbol ester-induced podosome formation.
Lastly, we asked whether podosome formation induced by an agonist other than Src may also involve p53 signaling. We chose PDBu-induced podosome formation in A7r5 vascular SMC as a study model (27). As shown in Fig. S3 in the supplemental material, and in agreement with data in previous reports (14, 27), PDBu induced podosome formation in A7r5 SMC. The inhibition of Src by PP2 significantly suppressed the ability of PDBu to induce podosomes, consistent with previous data that protein kinase C α activates Src and induces podosome formation via AFAP-110 (20). The enhancement of p53 activity by doxorubicin also suppressed PDBu-induced podosome formation, although to a lesser extent than Src inhibition. Together, these data suggest that PDBu-induced podosome formation also acts, at least partly, via the suppression of p53 by Src.
DISCUSSION
Cell migration/invasion and uncontrolled cell proliferation are two defining features, not only of cancer cells, but also of vascular SMC in atherosclerosis. The involvement of p53 in cell migration/invasion has been reported only recently (46), although its roles in the deregulation of cell proliferation, by comparison, have been widely studied and documented (4, 10, 33, 45). It was our goal in this study to investigate if p53 plays a role in Src-induced cytoskeleton remodeling and cell invasion in NIH 3T3 cells, as well as SMC. We have provided strong evidence that, as illustrated in Fig. 6, p53 is a potent suppressor of the Src-induced formation of podosomes and rosettes (Fig. 2) and the associated ECM degradation and cell invasion and, either directly or indirectly, Src-induced cell migration (Fig. 3). Lastly, we have identified caldesmon, a known antagonist of podosome formation, as a novel, downstream effector of p53 (Fig. 4 and 5). It is well known that the upregulation of p53 occurs in cells in response to the stress of oncogene activation, presumably as a defense to curb uncontrolled cell proliferation (5, 36). Interestingly, we found that cells stably expressing high levels of SrcY527F expressed low levels of p53 (Fig. 1). Our data suggest that persistent and permanent stress encountered by cells stably transformed to express SrcY527F is able to suppress p53 expression, resulting in an invasive phenotype, as observed in normal and cancer cells (19, 25, 32, 34, 40, 46). We have also found that the promigratory/invasive effects of Src in the SrcY527F-expressing cell lines can be overcome by the overexpression of wt p53 or the activation of p53 by doxorubicin (Fig. 3). These results, taken together, indicate that Src acts upstream of and is antagonistic to p53 expression and that the ability of Src to induce an invasive phenotype hinges on its ability to suppress p53. The mechanism by which Src suppresses p53 is not clear at present. One promising pathway involves the Src activation of Stat3, which in turn suppresses p53 expression (42).
FIG. 6.
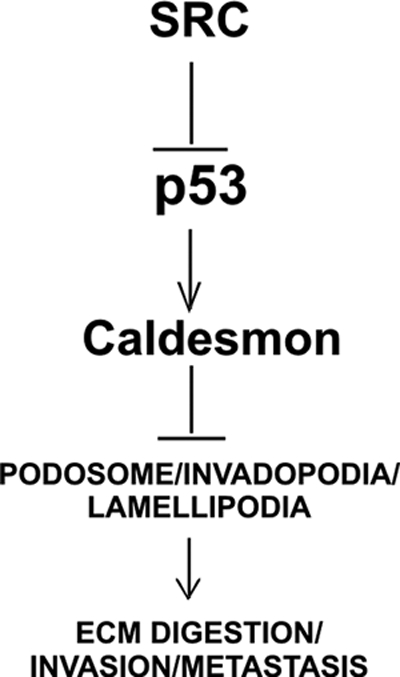
Schematic representation of signaling from Src to podosomes involving p53 and caldesmon. Src induces podosomes/ rosettes and suppresses p53, which induces the podosome antagonist caldesmon.
Our finding that p53 suppresses the migratory/invasive phenotype raises an important question: does p53 regulate the expression of proteins known to be involved in cytoskeletal remodeling and/or the regulation of the dynamics of podosome formation? Caldesmon is a likely candidate that is known to stabilize actin stress fibers and regulate actomyosin-mediated contractility (23, 26). It has been shown recently to be a potent suppressor of podosome formation (14, 24) and, like p53, is downregulated in many cancer cells (43, 47, 49). Our data clearly show that caldesmon expression correlates directly with the transcriptional function of p53 (Fig. 4 and 5A), suggesting that caldesmon may be a transcriptional target of p53.
It has been shown previously that small interfering RNA-mediated knockdown of caldesmon alone does not induce podosome formation in the absence of stimulation by Src or PDBu (39). This result is in line with the present finding that p53 deficiency alone is required but not sufficient to induce the formation of podosomes and the associated invasive phenotype without Src stimulation. These data indicate that Src and p53/caldesmon together and independently target a wide spectrum of downstream effectors in concert to produce the necessary cytoskeletal structures/functions, such as focal adhesion/cell adhesion, stress fibers/cell contraction, and MMP secretion/ECM digestion, which are required for the migratory and invasive phenotypes. In agreement with this conclusion are reports that p53 also prevents Cdc42-dependent formation of filopodia and cell spreading (19) and RhoA-ROCK-dependent amoeboid cell migration (18). Additionally, we have also seen that the overexpression of wt p53 strongly suppresses Src-induced lamelopodium formation in the breast cancer cell line MCF7 (data not shown). Interestingly, our preliminary data also show that the PDBu induction of podosome formation in A7r5 SMC may also act by suppressing p53 (see Fig. S3 in the supplemental material). This possibility is consistent with findings that protein kinase C α, via AFAP-110, activates Src (20), which as demonstrated in this study, can suppress p53. Further studies, however, are required to explore this interesting hypothesis.
In conclusion, we have shown a novel function of p53 in the inhibition of the Src-induced formation of podosomes and rosettes and the associated invasive phenotype in both NIH 3T3 cells and vascular SMC. We have also demonstrated that p53 may act by upregulating caldesmon. Although ample evidence indicates that podosomes play a critical role in ECM digestion and cell invasion (35), it is not clear whether podosomes may have any effect directly on cell migration. Further experiments will be required to determine whether the suppression of Src-induced cell migration and podosome formation by p53 act in series or in parallel. This study adds to our understanding of the role of p53 in regulating cell migration/invasion relevant to physio-/pathological events such as angiogenesis, metastasis, and atherosclerosis.
Supplementary Material
Acknowledgments
This work was supported by grants from the Canadian Institute of Health Research and Ontario Heart and Stroke Foundation to A.S.M. (HSFO T5829 and CIHR MOP78468).
We acknowledge the help of Chris Moyes, Christine Genge, and Melanie Fortner with fluorometry. The use of the Protein Function Discovery Imaging Facilities at Queen's University at Kingston is acknowledged.
Footnotes
Published ahead of print on 6 April 2009.
Supplemental material for this article may be found at http://mcb.asm.org/.
REFERENCES
- 1.Abram, C. L., D. F. Seals, I. Pass, D. Salinsky, L. Maurer, T. M. Roth, and S. A. Courtneidge. 2003. The adaptor protein fish associates with members of the ADAMs family and localizes to podosomes of Src-transformed cells. J. Biol. Chem. 27816844-16851. [DOI] [PubMed] [Google Scholar]
- 2.Aga, M., J. M. Bradley, K. Keller, M. J. Kelley, and T. S. Acott. 2008. Specialized podosome- or invadopodia-like structures (PILS) for focal trabecular meshwork extracellular matrix turnover. Investig. Ophthalmol. Vis. Sci. 495353-5365. [DOI] [PMC free article] [PubMed] [Google Scholar]
- 3.Ashur-Fabian, O., A. Avivi, L. Trakhtenbrot, K. Adamsky, M. Cohen, G. Kajakaro, A. Joel, N. Amariglio, E. Nevo, and G. Rechavi. 2004. Evolution of p53 in hypoxia-stressed Spalax mimics human tumor mutation. Proc. Natl. Acad. Sci. USA 10112236-12241. [DOI] [PMC free article] [PubMed] [Google Scholar]
- 4.Aylon, Y., and M. Oren. 2007. Living with p53, dying of p53. Cell 130597-600. [DOI] [PubMed] [Google Scholar]
- 5.Bartek, J., J. Bartkova, and J. Lukas. 2007. DNA damage signalling guards against activated oncogenes and tumour progression. Oncogene 267773-7779. [DOI] [PubMed] [Google Scholar]
- 6.Block, M. R., C. Badowski, A. Millon-Fremillon, D. Bouvard, A. P. Bouin, E. Faurobert, D. Gerber-Scokaert, E. Planus, and C. Albiges-Rizo. 2008. Podosome-type adhesions and focal adhesions, so alike yet so different. Eur. J. Cell Biol. 87491-506. [DOI] [PubMed] [Google Scholar]
- 7.Bowden, E. T., E. Onikoyi, R. Slack, A. Myoui, T. Yoneda, K. M. Yamada, and S. C. Mueller. 2006. Co-localization of cortactin and phosphotyrosine identifies active invadopodia in human breast cancer cells. Exp. Cell Res. 3121240-1253. [DOI] [PubMed] [Google Scholar]
- 8.Bristow, R. G., and R. P. Hill. 2008. Hypoxia and metabolism. Hypoxia, DNA repair and genetic instability. Nat. Rev. Cancer. 8180-192. [DOI] [PubMed] [Google Scholar]
- 9.Buccione, R., J. D. Orth, and M. A. McNiven. 2004. Foot and mouth: podosomes, invadopodia and circular dorsal ruffles. Nat. Rev. Mol. Cell Biol. 5647-657. [DOI] [PubMed] [Google Scholar]
- 10.Campisi, J. 2005. Senescent cells, tumor suppression, and organismal aging: good citizens, bad neighbors. Cell 120513-522. [DOI] [PubMed] [Google Scholar]
- 11.Clark, E. S., A. S. Whigham, W. G. Yarbrough, and A. M. Weaver. 2007. Cortactin is an essential regulator of matrix metalloproteinase secretion and extracellular matrix degradation in invadopodia. Cancer Res. 674227-4235. [DOI] [PubMed] [Google Scholar]
- 12.de Stanchina, E., E. Querido, M. Narita, R. V. Davuluri, P. P. Pandolfi, G. Ferbeyre, and S. W. Lowe. 2004. PML is a direct p53 target that modulates p53 effector functions. Mol. Cell 13523-535. [DOI] [PubMed] [Google Scholar]
- 13.de Torres, C., F. Munell, M. Roig, J. Reventos, and A. Macaya. 2002. Naturally occurring cell death during postnatal development of rat skeletal muscle. Muscle Nerve 26777-783. [DOI] [PubMed] [Google Scholar]
- 14.Eves, R., B. A. Webb, S. Zhou, and A. S. Mak. 2006. Caldesmon is an integral component of podosomes in smooth muscle cells. J. Cell Sci. 1191691-1702. [DOI] [PubMed] [Google Scholar]
- 15.Ferbeyre, G., E. de Stanchina, E. Querido, N. Baptiste, C. Prives, and S. W. Lowe. 2000. PML is induced by oncogenic ras and promotes premature senescence. Genes Dev. 142015-2027. [PMC free article] [PubMed] [Google Scholar]
- 16.Fiegel, H. C., M. V. Lioznov, L. Cortes-Dericks, C. Lange, D. Kluth, B. Fehse, and A. R. Zander. 2003. Liver-specific gene expression in cultured human hematopoietic stem cells. Stem Cells 2198-104. [DOI] [PubMed] [Google Scholar]
- 17.Furmaniak-Kazmierczak, E., S. W. Crawley, R. L. Carter, D. H. Maurice, and G. P. Cote. 2007. Formation of extracellular matrix-digesting invadopodia by primary aortic smooth muscle cells. Circ. Res. 1001328-1336. [DOI] [PubMed] [Google Scholar]
- 18.Gadea, G., M. de Toledo, C. Anguille, and P. Roux. 2007. Loss of p53 promotes RhoA-ROCK-dependent cell migration and invasion in 3D matrices. J. Cell Biol. 17823-30. [DOI] [PMC free article] [PubMed] [Google Scholar]
- 19.Gadea, G., L. Lapasset, C. Gauthier-Rouviere, and P. Roux. 2002. Regulation of Cdc42-mediated morphological effects: a novel function for p53. EMBO J. 212373-2382. [DOI] [PMC free article] [PubMed] [Google Scholar]
- 20.Gatesman, A., V. G. Walker, J. M. Baisden, S. A. Weed, and D. C. Flynn. 2004. Protein kinase Cα activates c-Src and induces podosome formation via AFAP-110. Mol. Cell. Biol. 247578-7597. [DOI] [PMC free article] [PubMed] [Google Scholar]
- 21.Gimona, M., and R. Buccione. 2006. Adhesions that mediate invasion. Int. J. Biochem. Cell Biol. 381875-1892. [DOI] [PubMed] [Google Scholar]
- 22.Gimona, M., R. Buccione, S. A. Courtneidge, and S. Linder. 2008. Assembly and biological role of podosomes and invadopodia. Curr. Opin. Cell Biol. 20235-241. [DOI] [PubMed] [Google Scholar]
- 23.Greenberg, M. J., C. L. Wang, W. Lehman, and J. R. Moore. 2008. Modulation of actin mechanics by caldesmon and tropomyosin. Cell Motil. Cytoskeleton 65156-164. [DOI] [PMC free article] [PubMed] [Google Scholar]
- 24.Gu, Z., J. Kordowska, G. L. Williams, C. L. Wang, and C. M. Hai. 2007. Erk1/2 MAPK and caldesmon differentially regulate podosome dynamics in A7r5 vascular smooth muscle cells. Exp. Cell Res. 313849-866. [DOI] [PMC free article] [PubMed] [Google Scholar]
- 25.Guo, F., and Y. Zheng. 2004. Rho family GTPases cooperate with p53 deletion to promote primary mouse embryonic fibroblast cell invasion. Oncogene 235577-5585. [DOI] [PubMed] [Google Scholar]
- 26.Hai, C. M., and Z. Gu. 2006. Caldesmon phosphorylation in actin cytoskeletal remodeling. Eur. J. Cell Biol. 85305-309. [DOI] [PubMed] [Google Scholar]
- 27.Hai, C. M., P. Hahne, E. O. Harrington, and M. Gimona. 2002. Conventional protein kinase C mediates phorbol-dibutyrate-induced cytoskeletal remodeling in a7r5 smooth muscle cells. Exp. Cell Res. 28064-74. [DOI] [PubMed] [Google Scholar]
- 28.Han, J. W., C. Flemington, A. B. Houghton, Z. M. Gu, G. P. Zambetti, R. J. Lutz, L. Zhu, and T. Chittenden. 2001. Expression of bbc3, a pro-apoptotic BH3-only gene, is regulated by diverse cell death and survival signals. Proc. Natl. Acad. Sci. USA 9811318-11323. [DOI] [PMC free article] [PubMed] [Google Scholar]
- 29.Hollstein, M., D. Sidransky, B. Vogelstein, and C. C. Harris. 1991. p53 mutations in human cancers. Science 25349-53. [DOI] [PubMed] [Google Scholar]
- 30.Koganehira, Y., M. Takeoka, T. Ehara, K. Sasaki, H. Murata, T. Saida, and S. Taniguchi. 2003. Reduced expression of actin-binding proteins, h-caldesmon and calponin h1, in the vascular smooth muscle inside melanoma lesions: an adverse prognostic factor for malignant melanoma. Br. J. Dermatol. 148971-980. [DOI] [PubMed] [Google Scholar]
- 31.Komarov, P. G., E. A. Komarova, R. V. Kondratov, K. Christov-Tselkov, J. S. Coon, M. V. Chernov, and A. V. Gudkov. 1999. A chemical inhibitor of p53 that protects mice from the side effects of cancer therapy. Science 2851733-1737. [DOI] [PubMed] [Google Scholar]
- 32.Ku, T. K., D. C. Nguyen, M. Karaman, P. Gill, J. G. Hacia, and D. L. Crowe. 2007. Loss of p53 expression correlates with metastatic phenotype and transcriptional profile in a new mouse model of head and neck cancer. Mol. Cancer Res. 5351-362. [DOI] [PubMed] [Google Scholar]
- 33.Levine, A. J. 1997. p53, the cellular gatekeeper for growth and division. Cell 88323-331. [DOI] [PubMed] [Google Scholar]
- 34.Lewis, B. C., D. S. Klimstra, N. D. Socci, S. Xu, J. A. Koutcher, and H. E. Varmus. 2005. The absence of p53 promotes metastasis in a novel somatic mouse model for hepatocellular carcinoma. Mol. Cell. Biol. 251228-1237. [DOI] [PMC free article] [PubMed] [Google Scholar]
- 35.Linder, S. 2007. The matrix corroded: podosomes and invadopodia in extracellular matrix degradation. Trends Cell Biol. 17107-117. [DOI] [PubMed] [Google Scholar]
- 36.Lowe, S. W. 1999. Activation of p53 by oncogenes. Endocr.-Relat. Cancer 645-48. [DOI] [PubMed] [Google Scholar]
- 37.McCurrach, M. E., T. M. Connor, C. M. Knudson, S. J. Korsmeyer, and S. W. Lowe. 1997. bax-deficiency promotes drug resistance and oncogenic transformation by attenuating p53-dependent apoptosis. Proc. Natl. Acad. Sci. USA 942345-2349. [DOI] [PMC free article] [PubMed] [Google Scholar]
- 38.Miyashita, T., and J. C. Reed. 1995. Tumor suppressor p53 is a direct transcriptional activator of the human bax gene. Cell 80293-299. [DOI] [PubMed] [Google Scholar]
- 39.Morita, T., T. Mayanagi, T. Yoshio, and K. Sobue. 2007. Changes in the balance between caldesmon regulated by p21-activated kinases and the Arp2/3 complex govern podosome formation. J. Biol. Chem. 2828454-8463. [DOI] [PubMed] [Google Scholar]
- 40.Morton, J. P., D. S. Klimstra, M. E. Mongeau, and B. C. Lewis. 2008. Trp53 deletion stimulates the formation of metastatic pancreatic tumors. Am. J. Pathol. 1721081-1087. [DOI] [PMC free article] [PubMed] [Google Scholar]
- 41.Nickson, P., A. Toth, and P. Erhardt. 2007. PUMA is critical for neonatal cardiomyocyte apoptosis induced by endoplasmic reticulum stress. Cardiovasc. Res. 7348-56. [DOI] [PMC free article] [PubMed] [Google Scholar]
- 42.Niu, G., K. L. Wright, Y. Ma, G. M. Wright, M. Huang, R. Irby, J. Briggs, J. Karras, W. D. Cress, D. Pardoll, R. Jove, J. Chen, and H. Yu. 2005. Role of Stat3 in regulating p53 expression and function. Mol. Cell. Biol. 257432-7440. [DOI] [PMC free article] [PubMed] [Google Scholar]
- 43.Owada, M. K., A. Hakura, K. Iida, I. Yahara, K. Sobue, and S. Kakiuchi. 1984. Occurrence of caldesmon (a calmodulin-binding protein) in cultured cells: comparison of normal and transformed cells. Proc. Natl. Acad. Sci. USA 813133-3137. [DOI] [PMC free article] [PubMed] [Google Scholar]
- 44.Paddison, P. J., M. Cleary, J. M. Silva, K. Chang, N. Sheth, R. Sachidanandam, and G. J. Hannon. 2004. Cloning of short hairpin RNAs for gene knockdown in mammalian cells. Nat. Methods 1163-167. [DOI] [PubMed] [Google Scholar]
- 45.Rodier, F., J. Campisi, and D. Bhaumik. 2007. Two faces of p53: aging and tumor suppression. Nucleic Acids Res. 357475-7484. [DOI] [PMC free article] [PubMed] [Google Scholar]
- 46.Roger, L., G. Gadea, and P. Roux. 2006. Control of cell migration: a tumour suppressor function for p53? Biol. Cell 98141-152. [DOI] [PubMed] [Google Scholar]
- 47.Ross, D. T., U. Scherf, M. B. Eisen, C. M. Perou, C. Rees, P. Spellman, V. Iyer, S. S. Jeffrey, M. Van de Rijn, M. Waltham, A. Pergamenschikov, J. C. Lee, D. Lashkari, D. Shalon, T. G. Myers, J. N. Weinstein, D. Botstein, and P. O. Brown. 2000. Systematic variation in gene expression patterns in human cancer cell lines. Nat. Genet. 24227-235. [DOI] [PubMed] [Google Scholar]
- 48.Sobue, K., and J. R. Sellers. 1991. Caldesmon, a novel regulatory protein in smooth muscle and nonmuscle actomyosin systems. J. Biol. Chem. 26612115-12118. [PubMed] [Google Scholar]
- 49.Tanaka, J., T. Watanabe, N. Nakamura, and K. Sobue. 1993. Morphological and biochemical analyses of contractile proteins (actin, myosin, caldesmon and tropomyosin) in normal and transformed cells. J. Cell Sci. 104595-606. [DOI] [PubMed] [Google Scholar]
- 50.Tewey, K. M., T. C. Rowe, L. Yang, B. D. Halligan, and L. F. Liu. 1984. Adriamycin-induced DNA damage mediated by mammalian DNA topoisomerase-II. Science 226466-468. [DOI] [PubMed] [Google Scholar]
- 51.Vishnubhotla, R., S. Sun, J. Huq, M. Bulic, A. Ramesh, G. Guzman, M. Cho, and S. C. Glover. 2007. ROCK-II mediates colon cancer invasion via regulation of MMP-2 and MMP-13 at the site of invadopodia as revealed by multiphoton imaging. Lab. Investig. 871149-1158. [DOI] [PubMed] [Google Scholar]
- 52.Weaver, A. M. 2006. Invadopodia: specialized cell structures for cancer invasion. Clin. Exp. Metastasis 2397-105. [DOI] [PubMed] [Google Scholar]
- 53.Webb, B. A., R. Eves, S. W. Crawley, S. Zhou, G. P. Cote, and A. S. Mak. 2005. PAK1 induces podosome formation in A7r5 vascular smooth muscle cells in a PAK-interacting exchange factor-dependent manner. Am. J. Physiol. Cell Physiol. 289C898-C907. [DOI] [PubMed] [Google Scholar]
- 54.Webb, B. A., L. Jia, R. Eves, and A. S. Mak. 2007. Dissecting the functional domain requirements of cortactin in invadopodia formation. Eur. J. Cell Biol. 86189-206. [DOI] [PubMed] [Google Scholar]
- 55.Xiao, H., R. Eves, C. Yeh, W. Kan, F. Xu, A. S. Mak, and M. Liu. 2009. Phorbol ester-induced podosomes in normal human bronchial epithelial cells. J. Cell. Physiol. 218366-375. [DOI] [PubMed] [Google Scholar]
- 56.Yamaguchi, H., F. Pixley, and J. Condeelis. 2006. Invadopodia and podosomes in tumor invasion. Eur. J. Cell Biol. 85213-218. [DOI] [PubMed] [Google Scholar]
- 57.Yoshio, T., T. Morita, Y. Kimura, M. Tsujii, N. Hayashi, and K. Sobue. 2007. Caldesmon suppresses cancer cell invasion by regulating podosome/invadopodium formation. FEBS Lett. 5813777-3782. [DOI] [PubMed] [Google Scholar]
- 58.Zhou, S., B. A. Webb, R. Eves, and A. S. Mak. 2006. Effects of tyrosine phosphorylation of cortactin on podosome formation in A7r5 vascular smooth muscle cells. Am. J. Physiol. Cell Physiol. 290C463-C471. [DOI] [PubMed] [Google Scholar]
Associated Data
This section collects any data citations, data availability statements, or supplementary materials included in this article.