Abstract
In vivo measurements of perfusion present a challenge to existing small animal imaging techniques such as magnetic resonance microscopy (MRM), microCT, microPET, and microSPECT, due to combined requirements for high spatial and temporal resolution. We demonstrate the use of Tomographic Digital Subtraction Angiography (TDSA) for estimation of perfusion in small animals. TDSA augments conventional digital subtraction angiography (DSA) by providing three-dimensional spatial information using tomosynthesis algorithms. TDSA is based on the novel paradigm that the same time density curves can be reproduced in a number of consecutive injections of μL volumes of contrast at a series of different angles of rotation. The capabilities of TDSA are established in studies on lung perfusion in rats. Using an imaging system developed in-house, we acquired data for 4D imaging with temporal resolution of 140 ms, in-plane spatial resolution of 100 microns, and slice thickness on the order of millimeters. Based on a structured experimental approach, we optimized TDSA imaging providing a good tradeoff between slice thickness, the number of injections, contrast-to-noise, and immunity to artifacts. Both DSA and TDSA images were used to create parametric maps of perfusion. TDSA imaging has potential application in a number of areas where functional perfusion measurements in 4D can provide valuable insight into animal models of disease and response to therapeutics.
Keywords: X-ray, digital subtraction angiography, tomosynthesis, small animal, lung, perfusion, functional imaging
Introduction
The availability of genetically altered mouse and rat models of human disease and the increasing use of small animals in basic research have spurred extraordinary interest in the development of imaging methods for small animals. Perfusion imaging presents a challenge to existing small animal imaging techniques particularly MR microscopy, microPET, microSPECT, microCT, and digital subtraction angiography (DSA). Arterial spin labeling1 and dynamic contrast enhancement 2 have been used in MR microscopy. Perfusion in rodents has also been measured via nuclear techniques, such as microPET using 15O labeled water 3 and microSPECT4. Pre-clinical microCT scanners are also available. The fastest commercial small animal microCT scanner we are aware of is the GE eXplore Locus Ultra system with scan of approximately 1 sec, and an in-plane resolution of 0.15 mm5. For comparison, first-pass perfusion studies in humans require clinical CT systems with a temporal resolution of at least 1 sec, or roughly one image per heartbeat6. Scaling this temporal requirement to the rodent with one image every heartbeat requires an interscan time on the order of 150 ms in rats and 100 ms in mice. A larger interscan time in small animals would result in missing the peak of enhancement required for accurate perfusion estimation. Consequently, none of these modalities provide simultaneous high spatial and temporal resolution.
Functional perfusion imaging in small animal models can be addressed particularly well using digital subtraction angiography (DSA). First suggested by Mistretta et al7, DSA is now a routine clinical exam. To date, there have been only limited studies using DSA in small animals8-10. Yet, potential exists for this modality given its ease of use, potential speed, and relatively low cost. Indeed, DSA can be used for functional studies with very high temporal resolution on the order of 100 ms but is a projection imaging method that does not provide tomographic information. To overcome this limitation, tomosynthesis has been used to recover the depth information in angiographic imaging11-13. Tomosynthesis, reviewed by Dobbins et al14, allows the post-acquisition tomographic reconstruction of any desired plane from a finite number of common digitized radiographs taken over a limited sampling arc.
Our goal for the present work was to develop and demonstrate the use of Tomographic Digital Subtraction Angiography (TDSA) for functional perfusion imaging in rodents. The TDSA approach is based on the novel paradigm that the same time density curves can be reproduced in a number of consecutive injections of contrast agent at a series of different angles of rotation. The capabilities of TDSA have been demonstrated in studies on lung perfusion in rats.
Materials and Methods
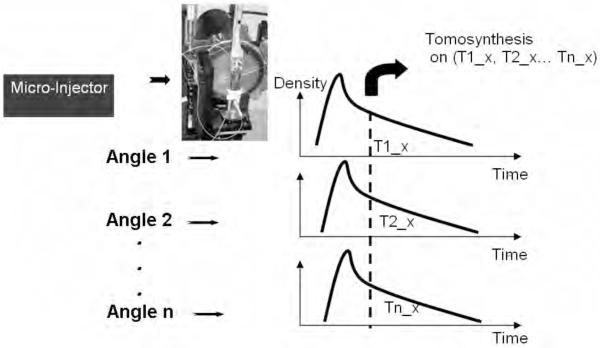
TDSA involves the acquisition of multiple series of DSA images at different angles with subsequent generation of 4D datasets derived from tomosynthetic reconstruction algorithms. The TDSA principle is shown by Fig.1. TDSA relies on our ability to produce similar time density profiles in a number of consecutive injections at different angles through the use of a carefully controlled injection of contrast agent along with synchronized scanning. The time density profiles refer to the temporal evolution of enhancement in a single voxel or in a region of interest (ROI). Thus, consistent projections at different angles corresponding to the same time points in the profiles are clustered and used for tomographic reconstruction based on tomosynthesis.
Fig.1.
The TDSA principle: the same time density profiles are generated for a ROI during multiple contrast injections at a number of different angles. By selecting the same time points (T1_x T2_x to Tn_x) in the time density profile, a set of consistent projections at different angles can be used for tomographic reconstruction using tomosynthesis.
In TDSA imaging, we aim to obtain the best image quality for estimating tomographic perfusion, while minimizing the number of contrast agent injections and thus projections. In the following sections, we present our integrated imaging system with the micro-injector and we describe our structured experimental approach to image quality optimization and our motivation in selection of volumes of contrast, number of angles, reconstruction arc.
Imaging System
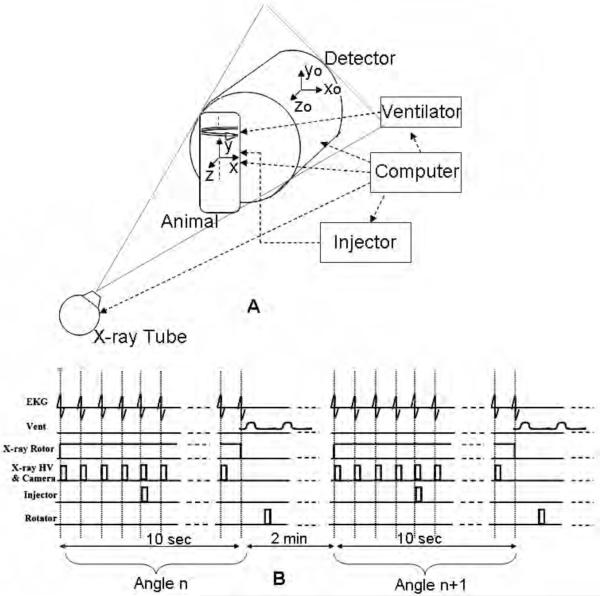
Our system is described in detail in 15 and is used for both microCT and angiography studies of small animals. The system uses a high-flux rotating anode x-ray tube (Philips SRO 09 50) designed for clinical angiography, with a dual 0.3/1.0 mm focal spot operating at 9 kW (0.3 mm focal spot) or 50 kW (1.0 mm focal spot). The detector is a cooled, charge-coupled device camera with a Gd2O2S phosphor on a 3:1 fiber optic reducer (X-ray ImageStar, Photonics Science, East Sussex, UK). The camera has an active input area of 106 mm (horizontal) x 106 mm (vertical) imaged on the sensor with an image matrix of 2048 × 2048 pixels with pixel size of 51 × 51 microns. The tube and detector are mounted in the horizontal plane on an extruded aluminum frame (80/20, Bellevue WA). The animal is held in a vertical position in an acrylic cradle using an upper incisor bar and the limbs are taped to the side of the cradle. The cradle is then placed on a circular pedestal that is rotated about the vertical axis by a computer-controlled stepping motor (Oriel Model 13049). The Fig.2A shows the schematics of the system during sampling and includes two reference systems i.e. one for the rotating animal or object (x, y, z) and one for the static imaging system (xo, yo, zo). The object system of reference (x, y, z) rotates around the y axis during sampling. This rotating object imaging system is equivalent from a tomographic reconstruction point of view with a system where the object would be stationary and the tube and detector would rotate. The distance between the detector and animal is 40 mm and the distance between the animal and x-ray source is 480 mm. This configuration results in a geometric blur of the focal spot that matches the Nyquist sample at the detector15. The use of the fixed gantry with the rotating animal has two distinct benefits over traditional commercial scanners. First, it permits the use of larger focal spots, which in turn provide a much higher radiation flux. Secondly, since the mass of the animal is small, this geometry allows a step and shoot rotation with arbitrary intervals, which makes synchronization of the exposure to the physiologic state much easier. The influence of a vertical body position on murine hemodynamics over time has been investigated with MR microscopy16, 17. The conclusion was that tilting the animal to a vertical position introduced no significant change in the animal’s hemodynamics. Similar results were shown for rats18. An acceptable explanation could be that the liquid column of water in a rodent is only a few centimeters long and therefore the small gravitational effect is negated by the animal’s autoregulatory system. Thus, the vertical position was not considered to be a major concern in our study.
Fig.2.
DSA and TDSA require integration of the X-ray imaging chain ( x-ray tube & detector) with the biological pulse sequencer (gating). (A) shows the schematics of the system during sampling and includes two reference systems i.e. one for the rotating animal or object (x, y, z) and one for the static imaging system (xo, yo, zo). The Biological Pulse Sequence (B) shows suspension of ventilation and image capture on every heartbeat at the QRS complex before and after a single contrast injection. A complete DSA sequence at angle n is acquired in 10 secs of suspended respiration (end expiration). The animal is rotated to the next angle n+1 and ventilated for 2 mins before another DSA sequence is repeated.
Micro-Injector
For micro-DSA and TDSA imaging, we use a custom-built power micro-injector, which consists of a computer-controlled solenoid valve attached to the contrast injection catheter, a heated contrast agent reservoir, and power from compressed N2 (90 PSI). The solenoid valve has a maximum response time of 20 ms. The contrast agent Isovue 370 mg I/mL (Bracco Diagnostics Inc., Princeton, NJ) is heated to the body temperature, eliminating thermal shock and reducing contrast viscosity. The high power driving the injection compensates for the small caliber lumen and high resistance of the injection catheters (3 Fr) achieving the high flow velocity required for the tightly controlled bolus injections. The micro-injector controls the volume of contrast agent via the injection time. This device reproducibly injects volumes down to 6 μL.
Biological Pulse Sequence
We employ the term “biological pulse sequence” to describe the synchronization of all of the events required to reliably reproduce the time density curves required for TDSA. As shown by Fig.2A, a computer running a LabVIEW (National Instruments, Austin, TX) application integrates the timing for the biological pulse sequence shown by Fig.2B. Intubation and ventilation is used to control the respiratory motion19. A DSA imaging sequence at angle n is started by first placing the animal in suspended respiration for 10 seconds (Fig. 2B). A series of mask images is captured on every heartbeat at the QRS complex prior to contrast injection with a more extended series captured at the same point in the QRS complex following the contrast injection. The animal is rotated to the next angle n+1 and ventilated for 2 minutes before another DSA sequence is repeated. This 2-min time interval between successive DSA runs allows both stabilization of blood gases and clearance of contrast agent. A series of MATLAB (The MathWorks, Natick, MA) functions are applied post-acquisition to average 5 pre-contrast images that create a mask. Logarithmic subtraction of the post-contrast and the pre-contrast mask images provide the DSA sequence containing the vascular/perfusion information.
Animal Procedures
The Duke Institutional Animal Care and Use Committee approved all animal procedures. Right jugular catheters (3F) for contrast agent deliveries were placed in female Fischer 344 rats (160-190g). The animals were anesthetized with Nembutal (50 mg/kg, IP, Abbott Laboratories, North Chicago, IL) and butorphanol (2mg/kg. IP, Fort Dodge Animal Health, Fort Dodge, Iowa), perorally intubated, and mechanically ventilated at 60 breaths per minute with a tidal volume of 2.0-2.2 mL. Anesthesia was maintained with isoflurane (1-2%, Halocarbon Laboratories, River Edge, NJ). Body temperature was measured with a rectal thermistor and maintained at normal levels with a PID feedback-controlled heat lamp. Solid-state transducers on the breathing valve measured airway pressure and flow. Pediatric electrodes were taped on the footpads of the animal for ECG. All physiologic signals were continuously collected (Coulbourn Instruments, Allentown, PA) and displayed on a computer using LabVIEW software. These physiologic signals were also used to control the gating described in the Biological Pulse Sequence section. At the conclusion of the studies, the animals were euthanized with an overdose of anesthesia.
Volume of Contrast Agent
Biological limits on the total volume of contrast injected are imposed in an animal during a study. We limited the total volume of contrast to less than 1.75 mL in a rat per study, which represents about 10% of the total blood volume. The total volume of contrast agent used in a study can be divided in various ways with each involving a different number of contrast injections and thus tomographic angles that might be used during TDSA imaging.
We specified that each contrast injection should provide peak enhancement in angiographic images that would satisfy the Rose criterion for detectability20, i.e. that the detectable signal difference must be at least 3-5 times greater than the standard deviation (the noise in the image). In a dedicated experiment, we measured the contrast-to-noise-ratio (CNR) in the aortic arch for DSA images when using various injection times (i.e., 50, 100, 150, 200, 300 ms) and associated with different volumes of contrast agent (see Table 1).
Table 1.
The calibration of injection time versus the injected volume for Isovue 370. We used (n=5) injections and computed mean and standard deviations. The injection volume increases linearly with the injection time i.e. the regression line has R2=0.97. Some inconsistencies and the standard deviations in the injection volumes are due to the response time of the solenoid valve
| Injection time [ms] | Volume [μL] |
|---|---|
| 50 | 39.48± 2.16 |
| 100 | 83.22±5.13 |
| 150 | 102.13±1.87 |
| 200 | 144.91±7.81 |
| 300 | 248.70±17.02 |
Our approach is based on the repeatability of the time density curves. We tested this hypothesis by performing multiple injections with 100 ms duration to determine the reproducibility of the time density curves.
The number of injections per study corresponds to the total volume of contrast injected divided by the volume of contrast per DSA sequence. Each injection is used for the acquisition of a complete DSA sequence at one particular angle of 40 images acquired during successive heartbeats. After fixing the total volume of contrast per experiment to 1.75 mL, we explored three cases: 1) 41 injections each of 39.5 μL, 2) 21 injections each of 83.2 μL, and 3) 11 injections each of 144.9 μL. As shown in Table 1, single injections of contrast agent were delivered over 50, 100, and 200 ms in duration. The total volume of contrast in these three cases was 1.6, 1.74, and 1.58 mL, respectively, and for each case was less than the 1.75 mL limit mentioned previously.
The number of injections is equal to the number of angles used for TDSA reconstruction. The sampling arc is the angular step multiplied by the number of sampling angles. We have chosen an angular step of 2°. A larger angular step would create artifacts in the reconstruction due to angular undersampling, while a smaller angular step would involve a reduction in the sampling arc and thus less tomographic resolution. Therefore the three sampling arcs corresponding to the three cases mentioned previously are 80°, 40°, and 20° respectively. We used the Multiple Projection Algorithm (MPA) for tomographic reconstruction21. This MPA algorithm is part of the shift-and-add class and is equivalent to backprojection.
X-ray Parameters and the Radiation Dose
The x-ray settings were 80 kVp, 250 mA and 9 ms per exposure. The temporal resolution for these DSA/TDSA studies was one image per heartbeat (every 140 ms). Although the actual acquisition time is about 9 ms, images can only be repeated every 140 ms because of the delays due to data readout from the camera. Simulations were performed previously to find the best x-ray characteristics for DSA imaging in small animals8. The study examined the selection of molybdenum (Mo) or tungsten (W) anode and technique ( kVp) to produce the highest quality small animal functional subtraction angiograms in terms of contrast and signal-difference-to-noise ratio squared (SdNR2). All simulations were performed using the xSpect simulation program developed at Henry Ford Health Systems (Detroit, MI). Using insights provided by simulations, we selected a sampling at 80 kVp that ensures a good contrast for DSA imaging of the rodent. Based on our experiments for half value layer (HVL) determination, 80 kVp involves a mean effective energy of 35keV (HVL =3.17 mm) that is very close to the k-edge of Iodine (33.17 keV), thus explaining the good contrast in angiographic images.
Dose was measured using a Wireless Dosimetry System Mobile MOSFET TN-RD-16, SN 63 (Thomson/Nielsen, Ottawa, ON, Ca). Five MOSFET detectors (TN-1002RDM) consisting of silicon chips of 1 mm2 with a 0.2 mm2 sensitive area were used in this study. An acrylic cylindrical phantom reflecting the anterior-posterior diameter of a rodent (30 mm) was placed in the x-ray beam path. This phantom had two holes with diameters (3.0 mm) that went through the length of the cylinder and were used to position the dosimeters at various locations. One hole was placed through the center of the cylinder and the other was made at ½ the radius of the phantom. Four detectors were placed in the phantom, i.e. two in each of the holes. One detector was placed at surface of the phantom. Dose was measured by each detector for sampling a DSA sequence of 40 x-ray images and an average dose was obtained by averaging over the five detectors.
MTF Quantification
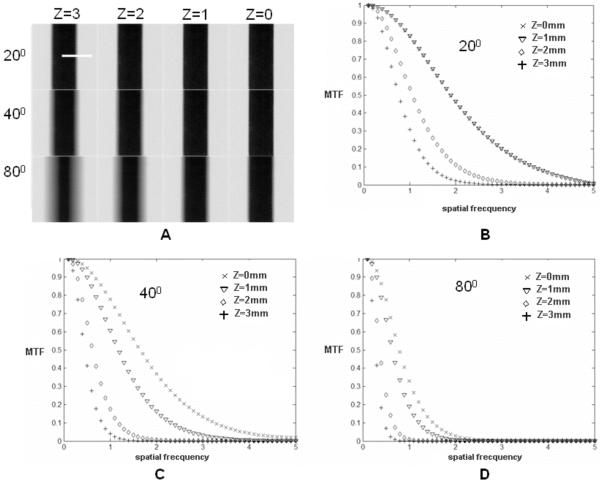
A phantom study was performed to investigate image quality related to the tomosynthetic reconstruction process. An aluminum thin plate of (0.5 mm thickness, 7.5 mm width and 30 mm height) was placed in the cradle parallel with the x-y plane with its long edge perpendicular to the direction of angular motion. This phantom was scanned using sampling arcs of 20°, 40°, and 80°, respectively, each with an angular step of 2°. Projections without the plate in the field of view were also acquired and used for mask subtraction. Thus DSA-like images were produced and used for tomographic reconstruction with MPA algorithm. Coronal tomosynthetic planes (parallel to x-y plane) were produced at Δz=1 mm increments and a number of line profiles across an edge of the plate were taken, averaged, and fitted using polynomials to create an edge response function. The Fourier transform of the derivatives of these fitted line profiles provide the Modulation Transfer Function (MTF) that characterize the performance of the tomographic system22. We analyzed the MTF in the sampling motion direction where the out-of-plane structures are maximally blurred. There is no tomographic degradation in the direction perpendicular to the sampling motion. Ideally, an infinitely thin slice would contain only the in-plane structures with equal contrast for all spatial frequencies. This refers only to the tomographic blur. However, since tomosynthesis is a limited angle reconstruction processes both in-focus and out-of-focus structures are overlapped in the same plane. The MTFs curves corresponding to edges of in-focus (z=0 mm) and out-of-focus structures (z=1, 2, 3 mm) show the abilities of the tomographic reconstruction algorithm to filter various spatial frequencies in the x-z plane.
Perfusion Maps
DSA and TDSA images contain functional information related to perfusion. The intravascular phase of contrast enhancement can be used to evaluate perfusion, i.e. blood flow per unit volume or mass of tissue. We computed perfusion using the Mullani-Gould formulation6, 23. Typically here, perfusion i.e. blood flow in a voxel is calculated as the peak enhancement divided by the area under the time density curve for the arterial input. The arterial input was obtained by selecting an ROI in a pulmonary artery. We created parametric maps for perfusion for DSA and a number of TDSA slices.
Results
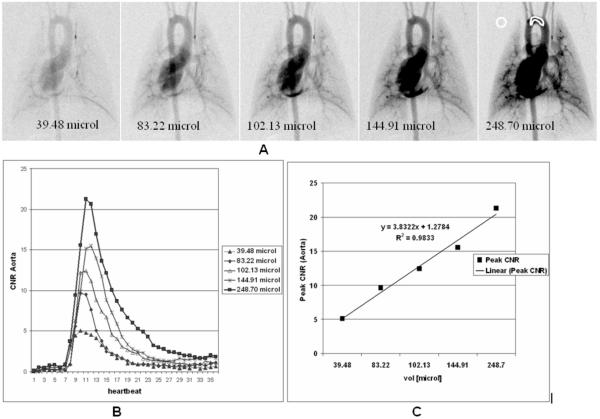
Fig. 3A shows DSA images corresponding to maximum peak enhancement in the aortic arch at the 5 different injections volumes given by Table 1. ROIs were selected in the aorta and the background and the mean pixel values μaorta, μbackground and standard deviation in the background σbackground were used to compute CNR. CNR = (μaorta - μbackground)/σbackground is plotted versus injection volumes (Fig.3B) and the linearity of the imaging approach is confirmed (Fig.3C). As Fig.3B suggests, even a 50 ms injection (volume = 39.48 μL) satisfies the Rose criterion (CNR ≡ 5) and the peak enhancement in DSA projection is detectable (Fig.3A).
Fig.3.
Micro-DSA images corresponding to maximum peak enhancement in the aortic arch at 5 different injections volumes (A). ROIs were selected in the aorta and the background and the CNR Aorta is plotted for the different injections (B). The linearity of the imaging system is confirmed by the plot of the CNR versus injection volume for the 5 injections (C).
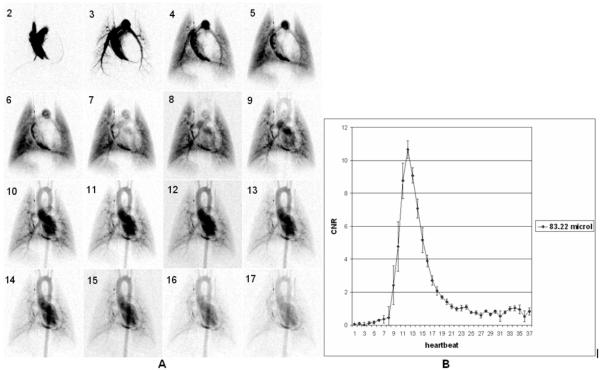
Sixteen successive images (starting at the second heartbeat post-injection) from a DSA sequence with 100 ms injection at a single angle are shown in Fig. 4A. The reproducibility for (n=5) sequential runs in the same animal with 100 ms injections (volume =83.22 microliter) is shown by the mean and standard error at each heartbeat (Fig. 4B) in a ROI of the aortic arch shown in Fig.3A. To summarize the reproducibility, we report the contrast-to-noise (CNR) at the peak enhancement (10.65±1.07) and the time to the peak enhancement of 1.42 ± 0.01 sec. Note that mean peak value of CNR >10.
Fig.4.
Sixteen successive images (starting at second heartbeat post injection) from a DSA sequence with 100 ms injection (A). The reproducibility for (n=5) 100 ms injections (volume injected 83.22 μL) is shown by mean and standard error at each heartbeat (B) in a region of the aortic arch (see Fig.3). Note that mean peak value of CNR >10.
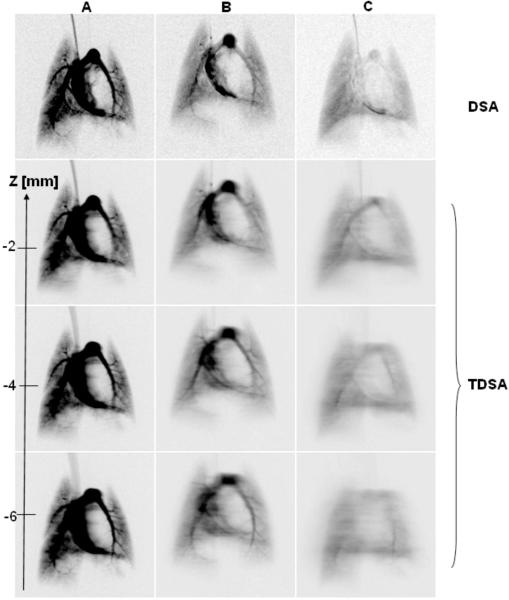
In order to understand how image quality, i.e. slice thickness, is affected by the reconstruction arc and the volume of contrast agent injected, we show in Fig. 5 a comparison for the fourth heartbeat post-injection between DSA images and three TDSA tomographic planes obtained with: A) 20° and 11 injections of 144. 91 μL contrast agent each, B) 40° and 21 injections of 83.22 μL contrast agent each, and C) 80° arc and 41 injections of 39.48 μL contrast agent each. The first row shows the corresponding DSA images for a single 144. 91 μL (DSA A), 83.22 μL (DSA B) and 39.48 μL (DSA C) injection. Note that larger volume injections does not allow a large reconstructed arc and thus the filtration of out-of-focus structure is reduced (TDSA A) while large arcs with 39.48 μL injections (TDSA,C) suffer from an overall blurring and contrast reduction.
Fig.5.
Comparison for the fourth heartbeat post injection between DSA images and three TDSA tomographic planes obtained with: A) 20° and 11 injections of 144.91μL each, B) 40° and 21 injections of 83.22 μL each and C) 80° arc and 41 injections of 39.48 μL. The first row shows the corresponding DSA images for a single injection of : 144.91μL (DSA A), 83.22μL (DSA B) and 39.48μL ( DSA C).
The plate phantom was used to determine the MTF of the system along the slice selections axis. Fig. 6A shows four (x-y) TDSA images corresponding to coronal planes (x-y) at Δz=1 mm interval for a thin plate positioned in the plane z=0. The four TDSA images were obtained with projections acquired over three reconstruction arcs (i.e., 20°, 40°, and 80°) and the same angular step of 2°. The MTF plots that were computed based on the edge profile (see dotted line in Fig. 6A) characterize the filtration mechanism along the (x-z) plane, obtained through the tomographic reconstruction. Note that low frequencies are less filtered by the reconstruction process than high frequencies as more distant planes are reconstructed (compare MTFs for z=1 versus z=3). Thus low frequencies propagate from one plane to another and appear superimposed on the in-focus structures resulting in an increased slice thickness. Increasing the sampling arc increases the filtration of low frequencies, thus reducing the slice thickness, but also suffers from an overall blurring due to attenuation of high frequencies (see Fig. 6D). Both the TDSA images from Fig.5 and the MTF plots suggest that MPA-based reconstruction with a 40° arc shows a good compromise between preserving in-plane high frequencies and filtration of out of plane structures.
Fig.6.
A) Four (x-y) TDSA planes at Δz=1mm interval for the thin plate phantom positioned at z=0. The 4 TDSA images were obtained with projections acquired over three reconstruction arcs (20°, 40° and 80°) and the same angular step of 2°. The MTF plots based on the edge profile (see dotted line in A) characterize the filtration along the (x-z) plane for the three arcs 20° (B), 40°(C), 80° (D).
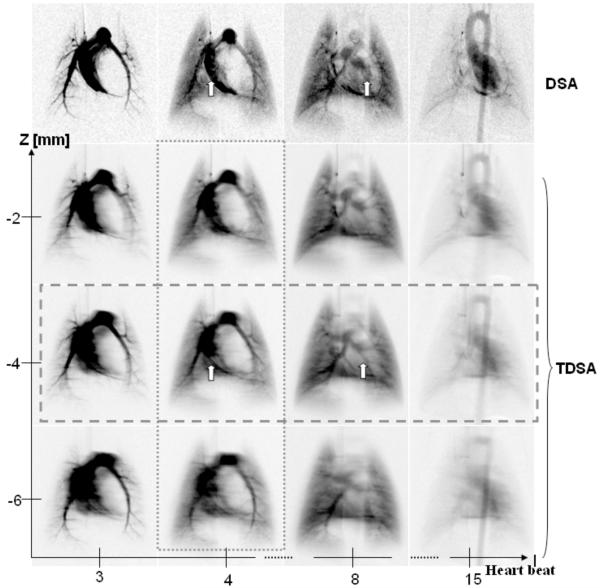
Fig. 7 shows a comparison between DSA at four selected heartbeats following injection (i.e., heartbeats 3, 4, 8, and 15) and three TDSA reconstructed planes at 2 mm intervals. The sampling arc for the TDSA images was 40°. Note how TDSA discriminates depth revealing the pulmonary vessels shown by the arrow at z=-4 mm TDSA slice. These vessels are masked by the superposition of other structures such as the right or left ventricle in the DSA sequence. TDSA allows 4D imaging, i.e. both time evolution at heartbeat resolution (Fig.7, horizontal rectangle) and depth discrimination (Fig.7, vertical rectangle).
Fig. 7.
A comparison at four selected heartbeats post contrast injection i.e. (3rd, 4th, 8th,15th) between DSA and three TDSA planes at 2 mm interval on z axis. A 40° arc was used for TDSA sampling. Note how the depth discrimination reveals the pulmonary vessels (arrows) at z=-4 mm TDSA slice. These vessels are masked by the superposition of other structures such as the right or left ventricle in the DSA sequence. TDSA allows 4D imaging i.e. both time evolution at heartbeat resolution (horizontal rectangle) and depth discrimination (vertical rectangle).
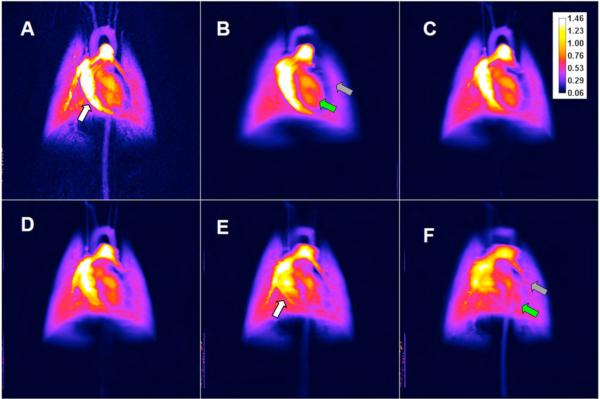
Fig.8 shows a comparison between DSA (A) and TDSA perfusion maps in five selected planes (i.e., Figures 8B, 8C, 8D, 8E, and 8F) computed on a pixel-by-pixel basis as the peak enhancement divided by the area under the curve for the arterial input. The color bar shows the perfusion in arbitrary units.
Fig.8.
A comparison between perfusion maps for DSA (A) and TDSA at z=(4, 0,-2,-4,-6) mm (B,C,D,E,F). The white arrows show the pulmonary vessel for which perfusion can be estimated in a TDSA slice (E) but not in DSA (A). Note also how various TDSA planes are different e.g. the LV pointed by the green arrow in (B) does not appear in (F) while the pulmonary artery in (F), shown by the gray arrow, is not in present in (B).
For a set of 40 x-ray images corresponding to a DSA sequence, we measured an average dose over the 5 MOSFET dosimeters of 3.4 cGy. Thus, the radiation doses obtained with TDSA for arcs of 20°, 40°, and 80°, corresponding to 11, 21 and 41 projections, were 37.4, 71.4, and 139.4 cGy, respectively.
Discussion and Conclusions
We have demonstrated the principle of TDSA based on the reproducibility of the time density curves obtained at different angles through repeated contrast injections (Fig. 4B). The variation over five injections for the peak enhancement for an 83.22 μL injection is about 10%, while the variation in the time to peak is only 7%. This proves that we can achieve sufficient reproducibility through careful synchronization of the imaging and contrast agent injections with the physiology of the animal (e.g. ECG and ventilation) as implemented by the biological pulse sequence shown in Fig 2B.
Optimization of the TDSA images is very dependent on some subjective decisions and the specific imaging task. Using what we believe are conservative physiological limits for the total contrast injection (10% of the total blood volume) and clearance time between injections (2 min), we explored the tradeoffs for pulmonary imaging in the rat. We have shown that a 40° arc and 21 contrast agent injections of 83.22 μL each is the best choice for sampling over the range of variables we explored. This offers a compromise between the number of injections and the tomographic capabilities of the MPA reconstruction algorithm (see Figs. 5, 6). We expect there is considerable room for improvement in the choice of parameters and reconstruction algorithms and such experiments are planned.
One major concern with the methods is that perfusion estimation could be affected if multiple injections create an accumulation of contrast agent in the tissue. However, we note that TDSA is based on subtraction of post-contrast images and masks we obtain in the same runs. Consequently, if a buildup of contrast takes place, the masks will contain this accumulation allowing for correction and the plot in Fig 4B supports this conclusion. Note that the baseline in the time density curves remains at the same level. For example, examination of the peak enhancement for five sequential injections shows no apparent systematic trend. A particularly critical point of our method is the use of the biological pulse sequence and the exquisite timing and reproducibility of the micro-injector allowing injection of very small volumes ( 83.22 μL is <0.5% of the blood volume/injection) of very tight boluses. This optimizes the absorption, and the small volumes are rapidly cleared.
As shown by Fig.7, TDSA provides the depth discrimination to image obscured organs or vessels that are not seen in DSA. The same observation is valid for Fig. 8 where perfusion maps are compared for DSA and TDSA. The pulmonary vessels indicated by arrows in Fig.7 in TDSA slices, are not seen in the DSA sequence. According to Fig.8 the perfusion values in DSA and TDSA appear to be in a similar range but TDSA allows depth separations of various structures. The pulmonary vessel totally obscured by the right ventricle in DSA is uncovered in the TDSA perfusion map. Although the tomographic capabilities are obvious (see green and gray arrows in Fig. 8), TDSA perfusion measurements are also expected to be affected by the tomographic blur associated with the tomosynthesis. Although it is impossible to achieve the image quality of CT, several methods promise significant improvement i.e. noise removal algorithms or filtration processes24, 25. Iterative reconstruction algorithms such as MART 26 that are known to work better for limited arcs or undersampling cases are also promising.
The perfusion measurements shown in this paper are not validated and future studies involving thermodilution and/or microspheres are necessary.
TDSA using conventional contrast agents and microCT with blood pool contrast agents, such as Fenestra VC (Alerion Biomedical Inc., San Diego, CA), can be performed together in the same animal with our imaging system and can provide both high temporal resolution for functional information and 3D morphology with high spatial resolution. Indeed such a combined microCT/DSA approach was applied by us in tumor imaging in small animals10. TDSA comes as natural enhancement to DSA bringing the tomographic dimension to perfusion estimation while maintaining the temporal resolution at heartbeat level.
However, TDSA involves multiple injections and thus a larger volume of contrast agent than in DSA. Both the imaging time and radiation dose are increased. For a 40° sampling arc the radiation dose associated with TDSA is 71.4 cGy versus 3.4 cGy in DSA. While TDSA radiation dose is significant is still 8 to 10 times less than the which in mice for example is from 5 to 7 Gy27. is the whole-body radiation dose that would kill 50% of an exposed small animal population within 30 days of exposure.
While other imaging methods allow some estimation of perfusion, TDSA offers a particularly appealing potential of both high spatial and temporal resolution. Applications exist in fundamental studies of physiology, exploration of tumor biology, toxicology, and drug discovery. To the best of our knowledge, this work represents the first demonstration of TDSA in small animal models and we believe there is great potential for the method.
Acknowledgements
All work was performed at the Duke Center for In Vivo Microscopy, an NCRR/NCI National Biomedical Technology Resource Center (P41 RR005959/R24 CA-092656). We thank to Sally Zimney for editorial assistance. We also thank to Terry T. Yoshizumi, PhD from Duke’s Department of Radiology and Division of Radiation Safety for the support in dose measurements.
References
- 1.Thomas DL. Arterial spin labeling in small animals: Methods and applications to experimental cerebral ischemia. J Magn Reson Imaging. 2005;22:741–744. doi: 10.1002/jmri.20453. [DOI] [PubMed] [Google Scholar]
- 2.Benjaminsen IC, Graff BA, Brurberg KG, Rofstad EK. Assessment of tumor blood perfusion by high-resolution dynamic contrast-enhanced mri: A preclinical study of human melanoma xenografts. Magn Reson Med. 2004;52:269–276. doi: 10.1002/mrm.20149. [DOI] [PubMed] [Google Scholar]
- 3.Yee SH, Jerabek PA, Fox PT. Non-invasive quantification of cerebral blood flow for rats by micropet imaging of 15o labelled water: The application of a cardiac time-activity curve for the tracer arterial input function. Nucl Med Commun. 2005;26:903–911. doi: 10.1097/00006231-200510000-00009. [DOI] [PubMed] [Google Scholar]
- 4.Constantinesco A, Choquet P, Monassier L, Israel-Jost V, Mertz L. Assessment of left ventricular perfusion, volumes, and motion in mice using pinhole gated spect. J Nucl Med. 2005;46:1005–1011. [PubMed] [Google Scholar]
- 5.Du LY, Lee T-Y, Holdsworth DW. Image quality assessment of a pre-clinical flat-panel volumetric micro-ct scanner. Proc. SPIE Int. Soc. Opt. Eng. 2006:614216. [Google Scholar]
- 6.Miles KA, Griffiths MR. Perfusion ct: A worthwhile enhancement? Br J Radiol. 2003;76:220–231. doi: 10.1259/bjr/13564625. [DOI] [PubMed] [Google Scholar]
- 7.Mistretta C, Ort M, Cameron J, Crummy A, Moran P. Multiple image subtraction technique for enhancing low contrast periodic objects. Invest. Radiol. 1973;8:43–49. doi: 10.1097/00004424-197301000-00007. [DOI] [PubMed] [Google Scholar]
- 8.Lin DM, Samei E, Badea C, Johnson GA. Optimized radiographic spectra for small animal digital subtraction angiography. Med. Phys. 2006;33:4249–4257. doi: 10.1118/1.2356646. [DOI] [PubMed] [Google Scholar]
- 9.Kobayashi S, Hori M, Dono K, Nagano H, Umeshita K, Nakamori S, Sakon M, Osuga K, Umetani K, Murakami T, Nakamura H, Monden M. In vivo real-time microangiography of the liver in mice using synchrotron radiation. J Hepatol. 2004;40:405–408. doi: 10.1016/j.jhep.2003.11.029. [DOI] [PubMed] [Google Scholar]
- 10.Badea CT, Hedlund LW, Lin MD, Boslego JF, Johnson GA. Tumor imaging in small animals with a combined micro-ct/micro-dsa system using iodinated conventional and blood pool contrast agents. Contrast Media and Molecular Imaging. 2006;1:153–164. doi: 10.1002/cmmi.103. [DOI] [PubMed] [Google Scholar]
- 11.Kruger RA, Sedaghati M, Roy DG, Liu P, Nelson JA, Kubal W, Del Rio P. Tomosynthesis applied to digital subtraction angiography. Radiology. 1984;152:805–808. doi: 10.1148/radiology.152.3.6379747. [DOI] [PubMed] [Google Scholar]
- 12.Anderson RE, Kruger RA, Sherry RG, Nelson JA, Liu P. Tomographic dsa using temporal filtration: Initial neurovascular application. AJNR Am J Neuroradiol. 1984;5:277–280. [PMC free article] [PubMed] [Google Scholar]
- 13.Maravilla KR, Murry RC, Jr., Diehl J, Suss R, Allen L, Chang K, Crawford J, McCoy R. Digital tomosynthesis: Technique modifications and clinical applications for neurovascular anatomy. Radiology. 1984;152:719–724. doi: 10.1148/radiology.152.3.6379745. [DOI] [PubMed] [Google Scholar]
- 14.Dobbins JT, 3rd, Godfrey DJ. Digital x-ray tomosynthesis: Current state of the art and clinical potential. Phys Med Biol. 2003;48:R65–106. doi: 10.1088/0031-9155/48/19/r01. [DOI] [PubMed] [Google Scholar]
- 15.Badea CT, Hedlund LW, Johnson GA. Micro-ct with respiratory and cardiac gating. Med. Phys. 2004;31:3324–3329. doi: 10.1118/1.1812604. [DOI] [PMC free article] [PubMed] [Google Scholar]
- 16.Wiesmann F, Neubauer S, Haase A, Hein L. Can we use vertical bore magnetic resonance scanners for murine cardiovascular phenotype characterization? Influence of upright body position on left ventricular hemodynamics in mice. J Cardiovasc Magn Reson. 2001;3:311–315. doi: 10.1081/jcmr-100108584. [DOI] [PubMed] [Google Scholar]
- 17.Schneider JE, Cassidy PJ, Lygate C, Tyler DJ, Wiesmann F, Grieve SM, Hulbert K, Clarke K, Neubauer S. Fast, high-resolution in vivo cine magnetic resonance imaging in normal and failing mouse hearts on a vertical 11.7 t system. J Magn Reson Imaging. 2003;18:691–701. doi: 10.1002/jmri.10411. [DOI] [PubMed] [Google Scholar]
- 18.Tyler DJ, Lygate CA, Schneider JE, Cassidy PJ, Neubauer S, Clarke K. Cine-mr imaging of the normal and infarcted rat heart using an 11.7 t vertical bore mr system. J Cardiovasc Magn Reson. 2006;8:327–333. doi: 10.1080/10976640500451903. [DOI] [PubMed] [Google Scholar]
- 19.Hedlund LW, Johnson GA. Mechanical ventilation for imaging the small animal lung. ILAR J. 2002;43:159–174. doi: 10.1093/ilar.43.3.159. [DOI] [PubMed] [Google Scholar]
- 20.Rose A. The sensitivity performance of the human eye on an absolute scale. J. Opt. Soc. Am. 1948;38:196–208. doi: 10.1364/josa.38.000196. [DOI] [PubMed] [Google Scholar]
- 21.Kolitsi Z, Panayiotakis G, Anastassopoulos V, Scodras A, Pallikarakis N. A multiple projection method for digital tomosynthesis. Med. Phys. 1992;19:1045–1050. doi: 10.1118/1.596822. [DOI] [PubMed] [Google Scholar]
- 22.A. S. T. a. M. (ASTM) Standard test method for measurements of computed tomography (ct) system performance. 1995. [Google Scholar]
- 23.Mullani NA, Gould KL. First-pass measurements of regional blood flow with external detectors. J Nucl Med. 1983;24:577–581. [PubMed] [Google Scholar]
- 24.Badea C, Kolitsi Z, Pallikarakis N. Image quality in extended arc filtered digital tomosynthesis. Acta Radiol. 2001;42:244–248. doi: 10.1080/028418501127346585. [DOI] [PubMed] [Google Scholar]
- 25.Kolitsi Z, Panayiotakis G, Pallikarakis N. A method for selective removal of out-of-plane structures in digital tomosynthesis. Med. Phys. 1993;20:47–50. doi: 10.1118/1.597060. [DOI] [PubMed] [Google Scholar]
- 26.Gordon R, Bender R, Herman GT. Algebraic reconstruction techniques (art) for three-dimensional electron microscopy and x-ray photography. J. Theor. Biol. 1970;29:471–481. doi: 10.1016/0022-5193(70)90109-8. [DOI] [PubMed] [Google Scholar]
- 27.Ford NL, Thornton MM, Holdsworth DW. Fundamental image quality limits for microcomputed tomography in small animals. Med. Phys. 2003;30:2869–2877. doi: 10.1118/1.1617353. [DOI] [PubMed] [Google Scholar]


