Abstract
The therapeutic usefulness of the quinoxaline derivatives XK469 (2-{4-[(7-chloro-2-quinoxalinyl)oxy]phenoxy}propionic acid) and SH80 (2-{4-[(7-bromo-2-quinolinyl)oxy]phenoxy}propionic acid) has been attributed to their abilities to induce G2/M arrest and apoptotic or autophagic cell death. Concentrations of XK469 or SH80 ≥ 5 μM were cytostatic to cultures of the normal murine melanocyte cell line Melan-a. Higher concentrations caused dose-dependent cytotoxicity. Concentrations ≥10 μM provoked dramatic morphological changes typified by marked increases in cell size and granularity. XK469/SH80-treated cultures accumulated tetraploid (4N) DNA-containing cells within 24 h of treatment, an 8N population within 3 days, and a 16N population within 5 days. Increases in ploidy correlated with the appearance of multinucleated cells. Under no circumstances did cells exhibit evidence of furrow formation. Both drugs suppressed cytokinesis in additional mammalian cell lines. Cytotoxic concentrations of XK469 elevated DEVDase activities (a measure of procaspase-3/7 activation) and enhanced cellular staining by a fluorescent analog of the pan caspase inhibitor valine-alanine-aspartic acid-fluoromethyl ketone within 48 to 96 h of treatment. Within 48 h of treatment, cytostatic and cytotoxic concentrations of XK469 elevated p21 contents, reduced Bcl-2 and Bcl-XL contents, and induced autophagy, as monitored by the accumulaton of phosphatidylethanolamine-modified cleavage product of microtubule-associated protein light chain 3 (LC3-II). Cultures treated with ≥10 μM XK469 or SH80 for 5 days could not be induced to divide upon removal of drugs. Such cultures maintained high LC3-II contents, exhibited reduced cyclin E and D1 contents, and extensively expressed senescence-associated β-galactosidase within 14 to 17 days of cessation of drug treatment. Hence, XK469 and SH80 inhibit cytokinesis, promote polyploidy, and induce senescence in Melan-a cells.
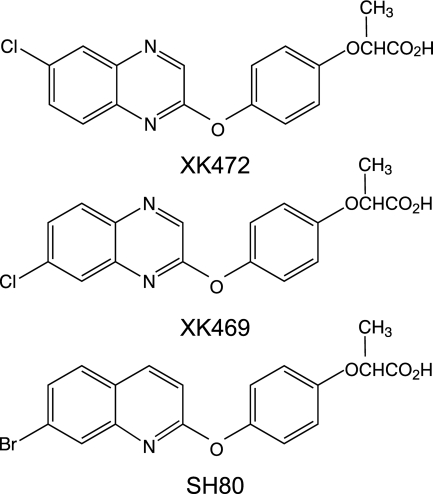
XK469 and SH80 are members of the quinoxaline family of antitumor agents (Fig. 1; Corbett et al., 1998; Hazeldine et al., 2001; Hazeldine et al., 2005). In vitro screens and xenograft transplantation studies have demonstrated the efficacy of these two agents toward a broad range of human tumor types, including those expressing the multidrug resistance phenotype (Corbett et al., 1998; Hazeldine et al., 2001, 2005; Ding et al., 2002; Mensah-Osman et al., 2003).
Fig. 1.
Structure of XK469 and its analogs. Syntheses and structures are reported in Hazeldine et al. (2001, 2005).
Several properties of XK469 and SH80 contribute to their therapeutic usefulness. Multiple groups have reported that XK469 promotes the accumulation of tetraploid cells in a variety of cultured tumor cell lines (Ding et al., 2001; Lin et al., 2002a,b; Ling et al., 2004; Kessel et al., 2007). Similar accumulations occurred in the murine leukemia cell line L1210 after exposure to SH80 (Kessel et al., 2007). XK469 is also cytotoxic to a variety of tumor cell lines. However, the mode of death is variable. Some cell types die expressing traits consistent with apoptosis (Ding et al., 2002; Mensah-Osman et al., 2003), whereas others do not (Kessel et al., 2007). With regard to the latter, Kessel et al. (2007) used pharmacological and short hairpin RNA knockdown approaches to demonstrate that both XK469 and SH80 kill L1210 cells by macroautophagic processes. Death by macroautophagy was not because of inherent deficiencies in the ability of the L1210 line to initiate or develop an apoptotic response. Instead, it reflected the preferential activation of macroautophagy in this cell line.
Cells undergoing macroautophagy (hereafter referred to as autophagy) up-regulate the expression of MHC class II molecules and their loading with processed peptides (Dengjel et al., 2005; Münz, 2006). These properties of autophagic cells are being exploited in the development of vaccines (van der Bruggen and Van den Eynde, 2006) and have been hypothesized as the basis for the therapeutic in vivo immunological response that develops after photodynamic therapy of tumors with photosensitizers capable of inducing autophagy (Kessel et al., 2006). In either case, autophagy presumably facilitates presentation of tumor-specific antigens, to which an immunological response can be subsequently mounted. Although highly speculative, we hypothesized that toxicant-induced autophagy in normal cells might inadvertently facilitate the presentation of “self-antigens” and the eventual development of an autoimmune response. To address this question, we initiated a study in which we intended to use autophagic normal murine melanocyte Melan-a cells (induced with XK469) as an immunogen to initiate in vivo immunity against resident cutaneous murine melanocytes. In essence, we hoped to use autophagic Melan-a cells to induce an autoimmune vitiligo-like condition. Early on, we observed that cytostatic concentrations of XK469/SH80 promoted the accumulation of multinucleated cells. The current study was designed to investigate that phenomenon and revealed that both XK469 and SH80 are potent and effective inhibitors of cytokinesis. As such, their mechanism of action is unlike what has been reported, and the two agents join a very short list of agents with a similar activity.
Materials and Methods
Chemicals. Stock 20 mM solutions of XK472, R (+) XK469, and R (+) SH80 were prepared in water. Stocks were added directly to cell cultures to achieve specified drug concentrations. XK472 was a gift from the DuPont Merck Pharmaceutical Co. (Wilmington, DE). The other agents were synthesized as described (Hazeldine et al., 2001, 2005) and provided by J. Horwitz (Karmanos Cancer Institute, Detroit, MI). HO33342 was purchased from Molecular Probes (Carlsbad, CA). The Bcl-2 antagonist HA14-1 was provided by Ryan Scientific, Inc. (Mt. Pleasant, SC). N-Acetyl-Asp-Glu-Val-Asp-amino-4-methylcoumarin was obtained from BD Pharmingen (San Jose, CA). AMC was purchased from Calbiochem (San Diego, CA). Bicinchoninic acid, poly-l-lysine, and 12-O-tetradecanoylphorbol-13-acetate were from Sigma-Aldrich (St. Louis, MO). The Carboxyfluorescein MultiCaspase Activity Kit (AK-117) was purchased from BIOMOL Research Laboratories (Plymouth Meeting, PA). The Senescence β-Galactosidase Staining Kit was obtained from BioVision (Mountain View, CA).
Cell Culture. Low-passage Melan-a cells were obtained from Dr. Faith Strickland (University of Michigan, Ann Arbor, MI). This line has a diploid chromosome number, is nontumorigenic in syngeneic or nude mice, and has a limited life span when propagated continuously in culture (Bennett et al., 1987). Cells were propagated in RPMI 1640 media with phenol red (final pH, 7.0-7.1), supplemented with l-glutamine (2 mM), 5% fetal bovine serum, penicillin (100 U/ml), streptomycin (100 μg/ml), HEPES (10 mM), and 12-O-tetradecanoylphorbol-13-acetate (200 nM). Cells were subcultured by first rinsing with PBS (CaCl2- and MgCl2-free) and then briefly incubating with trypsin-EDTA (0.25% trypsin, 1 mM EDTA) on a warming plate at 37°C. Single-cell suspensions were generated by gently pipetting dissociated cells. After centrifugation, cells were plated at 1.5 × 10⁴/ml every 4 to 5 days in media that were prewarmed to 37°C in a 5% CO2 incubator. The sources, growth media, and culturing conditions for the normal human breast epithelial cell line MCF10A (Guo et al., 2002), and murine hepatoma cell line 1c1c7 (Caruso et al., 2004), have been described in detail.
Flow Cytometry. Melan-a cells were released from culture dishes by trypsin-EDTA exposure and processed for FACS analysis of DNA content as described previously (Reiners et al., 1999). Data related to side light scatter (SSC) and forward light scatter (FSC) were simultaneously collected. Initial SSC and FSC data derived from nontreated cells were used to set gates that excluded inclusion of debris. Analyses were made with a BD Biosciences FACScalibur instrument (BD Biosciences, San Jose, CA). Percentages of cells in G0/G1, S, and G2/M stages of the cell cycle were determined with a DNA histogram-fitting program (ModFit; Verity Software House, Topsham, ME). Gated events/sample (2 × 10⁴) were collected for subsequent analysis and plotting.
FAM-VAD-FMK Analysis. A 12-well plate was seeded with low-passage Melan-a cells. Media were removed and replaced with 1.5 ml of fresh media the next day. Individual wells were treated with XK469 24, 48, or 72 h before harvest. On harvest day, media were transferred to a microfuge tube to retain any nonattached cells, and fresh media were added to the wells. Transferred media were centrifuged, and any pelleted cells were resuspended in 600 μl of fresh media. Wells were subsequently aspirated dry and refed with either 600 μl of fresh media or the cell suspensions. At this point, 0.8 μl of 150× FAM-VAD-FMK (BIOMOL Research Laboratories; AK-117 Kit) was added to the wells and incubated in the dark, at 37°C, in a 5% CO2 incubator. The subsequent steps involved in the staining, processing, and analyses of cells have been described in great detail (Elliott and Reiners, 2008). Samples were ultimately analyzed by FACS. Forward versus 90° side scatter analyses were used to set gates restricting subsequent data collection to cells and not debris. Cell-associated FAM-VAD-FMK fluorescence was analyzed in the FL1-H channel. Gated events/sample (2 × 10⁴) were collected for subsequent analyses. For these studies, it was extremely important to set a gate (based upon forward and side scatter analyses) that eliminated the inclusion of debris or cell fragments and to use a low concentration of, and short incubations with, the caspase inhibitor.
DEVDase Assay. Procaspase-3/7 activation was analyzed by monitoring the generation of AMC from the caspase substrate N-acetyl-Asp-Glu-Val-Asp-amino-4-methylcoumarin. The procedures used for the harvesting of cells and measurements of DEVDase activity have been described in detail (Caruso et al., 2004). Changes in fluorescence over time were converted into picomoles of product by comparison with a standard curve constructed with AMC. DEVDase-specific activities are reported as nanomoles of product per minute per milligram of protein. The bicinchoninic acid assay, using bovine serum albumin as a standard, was used to estimate protein concentrations.
Western Blotting. The conditions used for the preparation of cell extracts, separation of proteins on SDS-polyacrylamide gels, and transfer of separated proteins onto nitrocellulose membranes have been described in detail (Caruso et al., 2004). The primary antibodies used were: a mouse IgG1 monoclonal to full-length human cyclin E (Santa Cruz Biotechnology, Inc., Santa Cruz, CA), a mouse IgG2a monoclonal to N-terminal amino acids 3 to 14 of murine Bcl-XL (BD Pharmingen), a rabbit polyclonal raised against full-length murine p16 (Santa Cruz Biotechnology, Inc.) or a carboxy-terminal fragment of Bcl-2 (Cell Signaling Technology Inc., Danvers, MA), a mouse IgG2b monoclonal raised to full-length murine p21 and a mouse IgG1 monoclonal raised to full-length human cyclin D1 (Santa Cruz Biotechnology, Inc.), a rabbit polyclonal antibody raised to murine microtubule-associated protein light chain 3 (a gift from David Kessel, Wayne State University, Detroit, MI), and a mouse IgG1 monoclonal to the amino terminus of murine β-actin (Sigma-Aldrich). After washing, membranes were incubated with appropriate horseradish peroxidase secondary antibody for 1.5 h at room temperature. Antibody detection was performed with an enhanced chemiluminescence reaction kit (Amersham Pharmacia Biotech, Chalfont St. Giles, UK) and recorded on X-ray film.
Microscopy. Phase microscopy was performed with an Olympus IX71 microscope equipped with an Olympus D70 microscope digital camera (Olympus, Tokyo, Japan). For visualization of HO33342-stained nuclei, cells were plated on coverslips coated with poly-l-lysine. Treatment began a day after plating. Thereafter, cultures were pulled at various times, washed with PBS, and fixed using a solution of 4% paraformaldehyde. Accumulated coverslips were washed with PBS and subsequently incubated at room temperature, in the dark, in a PBS solution containing 500 nM HO33342. After 5 min, the coverslips were repeatedly washed with PBS and inverted onto a drop of Antifade Reagent (Molecular Probes) on glass slides and sealed with acrylic nail polish. Digital phase and fluorescence images were captured using an Axioplan 2 Imaging Microscope (Carl Zeiss GmbH, Jena, Germany).
Expression of senescence-associated β-galactosidase was monitored by staining for its activity according to the directions supplied by the manufacturer. Pictures were taken with an Olympus IX71 microscope approximately 12 to 14 h after initiation of the staining protocol.
Results
Cytostatic and Cytotoxic Properties of XK469 and SH80. Concentrations of XK469 ranging from 0.1 to 5 μM inhibited Melan-a proliferation without being cytotoxic (Fig. 2, A and B). Concentrations of XK469 ≥ 10 μM completely suppressed proliferation (Fig. 2, A and C) and exhibited concentration-dependent cytotoxicity after 4 days of treatment (Fig. 2D). In contrast, exposure to XK472 (Fig. 1), an inactive structural analog of XK469 (Ding et al., 2001; Hazeldine et al., 2001), did not affect either proliferation or viability at even 40 μM (Fig. 2, C and D). Concentrations of XK469 analog SH80 ≥ 5 μM effectively suppressed proliferation and exhibited concentration-dependent cytotoxicity at ≥10 μM (Fig. 2, E and F).
Fig. 2.
Cytostatic and cytotoxic properties of XK469 and analogs. Approximately 24 h after plating 2 × 10⁴ cells, cultures of Melan-a cells were treated with varied concentrations of XK469 (A-D) or SH80 (E and F) or 40 μM XK472 (C and D). Cells were harvested at various times afterward for determinations of cell numbers (A, C, and E) or the ability to exclude trypan blue (B, D, and F). Treatment conditions are noted in the figure. Data represent means ± S.D. of analyses of three plates per time point and treatment group.
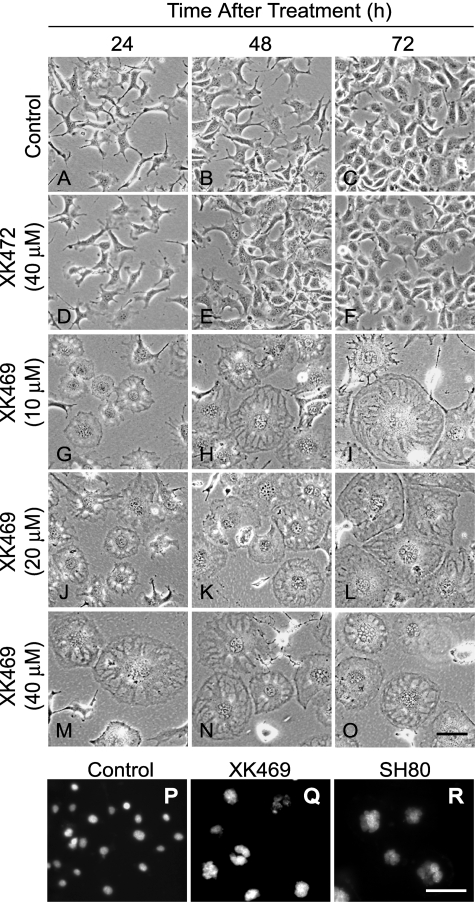
Morphological Features of XK469-Treated Cultures. Melan-a cells tended to be fairly uniform in size and somewhat dendritic when cultured at low density. Cells lost their dendritic characteristics as cultures became confluent (Fig. 3, A-C). In agreement with the proliferation studies, exposure to 40 μM XK472 had no notable effects on culture density or morphology (Fig. 3, D-F). Likewise, the morphology of Melan-a cells was not affected by a noncytotoxic concentration of XK469 (i.e., 1 μM). In contrast, 10 μM XK469 provoked rapid and dramatic morphological changes (Fig. 3, G-I). In particular, within 24 h of treatment, some cells flattened, enlarged, and became organized such that they resembled a “sand dollar” (Fig. 3G). With increasing time, these cells became larger and more granular (Fig. 3, H and I), and other cells assumed the sand dollar morphology. Concentrations of XK469 > 10 μM seemed to accelerate these morphological changes (Fig. 3, J-O). Concentrations of SH80 ≥ 10 μM induced morphological changes in Melan-a cultures similar to those observed in XK469-treated cultures (J. J. Reiners, unpublished data).
Fig. 3.
Phase and fluorescence microscopy of cultures treated with XK469 or analogs. Approximately 24 h after plating, Melan-a cultures were treated with solvent (H2O, A-C), 40 μM XK472 (D-F), or 10 (G-I), 20 (J-L), or 40 (M-O) μM XK469. Phase pictures were taken 24, 48, or 72 h after treatment. Alternatively, some cultures were treated with solvent (P) or 30 μM XK469 (Q) or SH80 (R) for 72 h before staining with HO33342. Black bar in O, 200 μm. White bar in R, 100 μm.
A striking feature of XK469-treated cells was their accumulation of what appeared to be multiple nuclei. Multinucleated cells (≥2 nuclei per cell) were obvious within 24 h of treatment with ≥10 μM XK469 (Fig. 3, G, J, and M). Within 48 to 72 h of treatment, cultures were extensively polynucleated (Fig. 3, H, I, K, L, N, and O). HO33342 staining of DNA was used to confirm that the nuclei-like structures in XK469-treated cultures contained DNA (Fig. 3, P-R). Normal Melan-a cells exhibited a single nucleus (Fig. 3P). In contrast, individual Melan-a cells exposed to 30 μM XK469 for 3 days exhibited a cluster of multiple nuclei (Fig. 3Q). Similar clusters of nuclei were observed in cultures treated with 30 μM SH80 for 3 days (Fig. 3R).
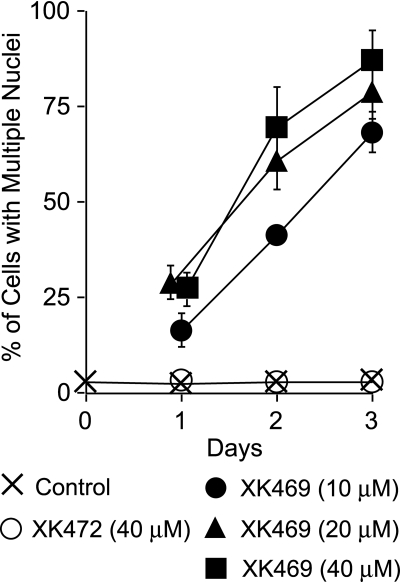
Quantification of nuclei confirmed both the concentration- and time-dependent accumulation of nuclei in XK469-treated but not XK472-treated cultures (Fig. 4). A majority of multinucleated Melan-a cells exhibited the flattened sand dollar morphology. Analyses of cultures treated with 10 μM XK469 for 24 h revealed the presence of some single nucleated cells with the sand dollar morphology. However, within the next 24 h, these cells became minimally binucleated. Within 72 h of XK469 treatment (≥10 μM), >98% of the cells with the sand dollar morphology were polynucleated.
Fig. 4.
Accumulation of nuclei in XK469-treated Melan-a cultures. Approximately 24 h after plating cultures were treated with nothing, 40 μM XK472, or various concentrations of XK469. Treatment conditions are noted in the figure. Cultures were either imaged by phase contrast microscopy approximately 24, 48 or 72 h after treatment, or fixed and stained with HO33342, and subsequently analyzed by fluorescence microscopy. Data represent means ± S.D. of data generated from analyses of four to eight fields of cells for each time and treatment group (actual cells counted varied from 240-690 per group).
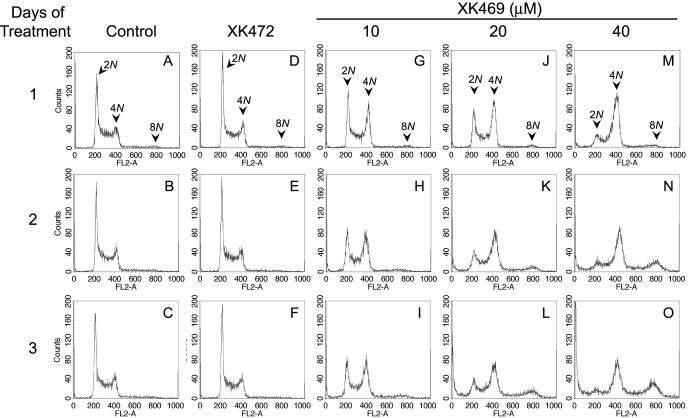
Flow Cytometric Analyses of Cell Size and DNA Contents. Exposure to solvent (i.e., H2O) or XK472 did not markedly affect the cell cycle distribution of Melan-a cultures over a 3-day period. (Fig. 5, A-F). However, exposure to 10 μM XK469 caused dramatic accumulations of tetraploid cells (4N DNA-containing) within 24 h of treatment (Fig. 5G), which were sustained for at least an additional 48 h (Fig. 5, H and I). Cultures treated with higher concentrations of XK469 initially had a greater percentage of cells with 4N DNA contents (Fig. 5, J and M). The higher concentrations of XK469 also gave rise to a population having 8N DNA contents. This later population was obvious within 48 to 72 h of treatment with either 20 or 40 μM XK469 (Fig. 5, K, L, N, and O).
Fig. 5.
Short term effects of XK469 and XK472 on Melan-a DNA contents. Approximately 24 h after plating Melan-a cultures were treated with solvent (A-C), 40 μM XK472 (D-F), or 10 (G-I), 20 (J-L), or 40 μM (M-O) XK469. Cultures were harvested 1, 2, and 3 days after treatment for analyses of DNA contents by FACS. Data represent 2 × 10⁴ gated events. Gating was set to eliminate the counting of cell debris. Similar results were obtained in a second experiment.
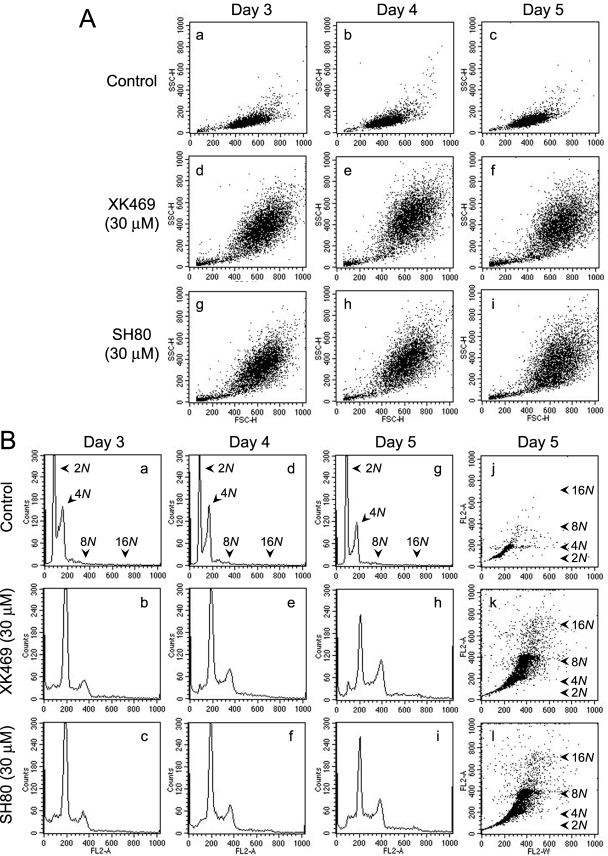
The plots in Fig. 5, L and O, suggested that there may be populations in XK469-treated cultures having DNA contents >8N. Unfortunately, the gating conditions we employed excluded such cells from our analyses. To explore this possibility, we altered the FACS settings to ensure that we analyzed for such cells. We also lengthened the incubation period with drugs. In agreement with our morphological observations, FACS analyses of forward (FSC-H channel) and side scatter (SSC-H channel) indicated that Melan-a cells exposed to either 30 μM XK469 or SH80 were larger and more granular than control cultures (Fig. 6A). Standard histogram plots of cell numbers versus DNA contents indicated the time-dependent loss of 4N cells and the accumulation of 8N cells in XK469- and SH80-treated cultures (Fig. 6B, a-i). The histograms also suggest the time-dependent accumulation of cells having greater than 8N DNA contents (Fig. 6B, e, f, h, and i). This latter cell population is more obvious when the data are plotted in a format in which single cells are represented as dots (Fig. 6B, j-l). Both XK469 and SH80 promoted the development of cells having 16N DNA contents. Selective regating of acquired data, based upon differences in size and density/granularity (e.g., forward and 90° side scatter, respectively) or DNA contents, indicated a direct correlation between size/granularity and DNA contents (analyses not shown).
Fig. 6.
XK469 and SH80 effects on Melan-a size, granularity, and DNA contents after protracted exposure. Approximately 24 h after plating, Melan-a cultures were treated with solvent, 30 μM XK469, or 30 μM SH80. Cultures were harvested 3, 4, or 5 days after treatment for analyses of granularity (SSC-H channel, y-axis) and size (FSC-H channel, x-axis) by FACS (A) and DNA contents by FACS (B). DNA analyses are depicted in either histogram (B, a-i) or dot plot (B, j-l) format. Data represent 2 × 10⁴ gated events. Similar data were obtained in a second experiment.
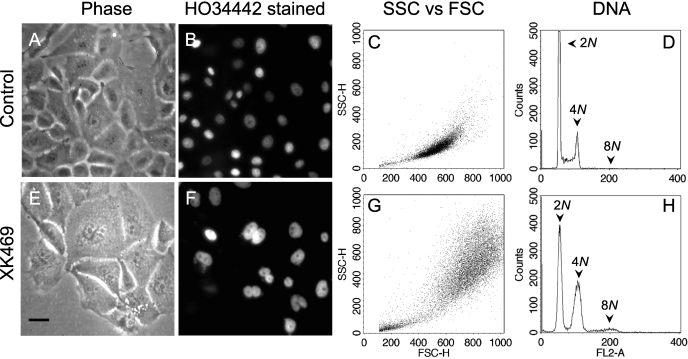
XK469 Suppression of Cytokinesis in MCF10A and 1c1c7 Cells. Concentration-response studies indicated that 30 μM XK469 suppressed the proliferation of the normal human mammary cell line MCF10A, without being significantly toxic over a 96-h treatment period (J. J. Reiners, unpublished data). After 3 days of XK469 treatment, MCF10A cells were larger, as assessed either visually (compare Fig. 7, A versus E) or by FACS analyses of forward versus side scatter (compare Fig. 7, C versus G). Although no binucleated cells were observed in solvent-treated cultures (Fig. 7, A and B), ∼28% of the cells in XK469-treated cultures were binucleated (Fig. 7, E and F; percentage based on analyses of 250 cells). FACS analyses of DNA contents demonstrated the absence of an S phase population and the accumulations of tetraploid and octoploid populations in XK469-treated cultures (Fig. 7, D versus H). Results similar to those reported in Fig. 7 also occurred in MCF10A cultures treated with 30 μM SH80 (J. J. Reiners, unpublished data).
Fig. 7.
XK469-mediated suppression of cytokinesis in MCF10A cultures. Cultures were treated with either solvent (A-D) or 30 μM XK469 (E-H) for 3 days, at which time some cultures were stained with HO33342 and photographed using phase (A and E) or fluorescence (B and F) microscopy. Other cultures were released from the culture dishes and analyzed by FACS for size and granularity (C and G) and DNA contents (D and H). Analyses presented in C, D, G, and H are of 2 × 10⁴ gated events. Black bar in E, 100 μm.
Analyses of cultured murine hepatoma 1c1c7 and human hepatoma HepG2 cells revealed that 30 μM XK469 almost completely suppressed the proliferation of the former but had no effects on the proliferation of the latter cell line. In the case of 1c1c7 cultures, ∼35% of the cells were polynucleated (≥2 nuclei per cell; n = 218 cells) within 72 h of XK469 exposure (as assessed by phase and fluorescence microscopy of HO33342-stained cells; J. J. Reiners, unpublished data). In contrast, 30 μM XK469 had no observable effects on HepG2 cytokinesis.
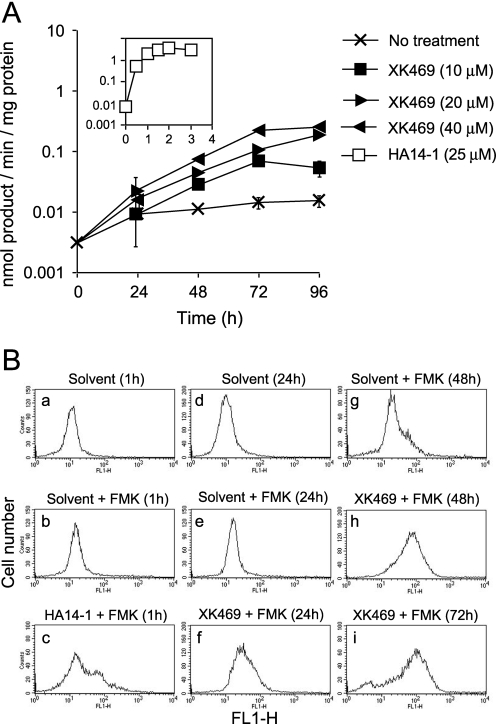
Caspase Activation. Concentrations of XK469 and SH80 ≥ 10 μM were cytotoxic to Melan-a cultures (Fig. 2, D and F). XK469- and SH80-induced toxicity required >48 h to manifest itself. Cells that eventually died released from the substratum, subsequently shrunk in size, and assumed a crinkly surface, with occasional small blebs. Such features are suggestive of cells undergoing apoptosis. Concentrations of XK469 sufficient to kill ∼30% of the culture within 72 to 96 h of treatment elevated DEVDase-specific activities (a measure of procaspase-3/7 activation) ∼25-fold (Fig. 8A). By way of comparison, we also analyzed the effects of the proapoptotic small-molecule Bcl-2 antagonist HA14-1 (Wang et al., 2000). A concentration of HA14-1 sufficient to induce cell shrinkage and pronounced blebbing in ≥90% of the culture within 2 h elevated DEVDase-specific activities ∼200-fold (Fig. 8A, insert).
Fig. 8.
XK469 activation of procaspases. A, Melan-a cultures were treated with various concentrations of XK469 or 25 μM HA14-1 (insert) for the indicated lengths of time before being harvested for analyses of DEVDase activities. Analyses represent means ± S.D. of triplicate analyses. Treatments are noted in the figure. Similar data were obtained in a second experiment. B, Melan-a cultures were treated with 25 μM HA14-1 for 45 min or 30 μM XK469 for different lengths of time before being processed for FAM-VAD-FMK staining, as described under Materials and Methods. In these studies, the solvent control consists of untreated samples that received, at the time of staining, a volume of DMSO comparable with the FAM-VAD-FMK addition. Data represent 2 × 10⁴ gated events.
To more broadly survey for caspase activation, we used flow cytometry to monitor the staining of cells with the fluorescence-labeled pan caspase-inhibitor FAM-VAD-FMK (Fig. 8B). This inhibitor reacts with all forms of activated caspases and is quite specific provided the agent is used in the low micromolar range. The staining profiles of cultures treated with solvent alone versus solvent plus FAM-VAD-FMK were very similar (compare Fig. 8, Ba with Bb and Bd with Be). Cultures treated with 25 μM HA14-1 and analyzed 1 h after treatment (a time sufficient for near-maximal DEVDase activation) exhibited subpopulations of cells having increased FAM-VAD-FMK staining (compare Fig. 8B, b with c). Relative to solvent-treated controls, Melan-a cultures exposed to 30 μM XK469 for 24 h exhibited a small increase in FAM-VAD-FMK staining (compare Fig. 8B, e with f). However, FAM-VAD-FMK staining dramatically increased in the next 24 h (compare Fig. 8B, f with h) and remained elevated thereafter (compare Fig. 8B, h with i). Hence, the kinetics of DEVDase activation and FAM-VAD-FMK staining (both monitors of procaspase activation) paralleled one another.
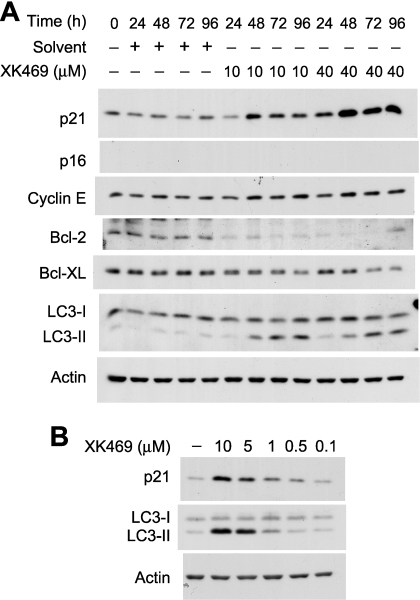
Analyses of Autophagy and Senescence. We recently reported that L1210 murine leukemia cells undergo autophagy after exposure to XK469 (Kessel et al., 2007). The posttranslational conversion of the cleavage product of microtubule-associated protein light chain 3 to LC3-II can be monitored by Western blot analyses and is considered a diagnostic marker of cells undergoing autophagy (Mizushima and Yoshimori, 2007). Dramatic accumulations of LC3-II occurred within 48 h of XK469 exposure in a concentration-dependent fashion (Fig. 9, A and B). In particular, LC3-II accumulation occurred with concentrations as low as 0.5 μM and plateaued at ∼10 μM. Hence, XK469 induced autophagy at concentrations that were cytostatic, as well as cytotoxic.
Fig. 9.
Western blot analyses of autophagy, cell cycle, and Bcl-2 proteins. Melan-A cultures were treated with 10 or 40 μM XK469 for different lengths of time (A) or with 0.1 to 10 μM XK469 for 2 days (B) before being harvested for subsequent Western blot analyses. Analyses are of 25 μg protein/lane. Similar results were obtained in a second experiment.
Bcl-2 is a negative regulator of both apoptosis (Thomadaki and Scorilas, 2006) and autophagy (Pattingre et al., 2005). Bcl-2 contents plummeted within 24 h of either 10 or 40 μM XK469 treatment (Fig. 9A). Bcl-XL contents also decreased after XK469 treatment, but to a lesser extent, and only after 48 h of treatment (Fig. 9A).
Within 3 days of treatment with either ≥20 μM XK469 or SH80, most Melan-a cells had assumed the sand dollar morphology. Refeeding with drug-free media after 5 days of exposure to either quinoxaline derivative did not reverse the morphology of the cells or prevent a majority of them from undergoing subsequent cell death. In particular, cells with the sand dollar morphology maintained the phenotype throughout 15 days of additional culture in drug-free medium (J. J. Reiners, unpublished data). At the onset of these refeeding studies, most cells were trypan blue impermeable but incapable of proliferation upon replating at clonal density. With passing time, the numbers of attached cells with the sand dollar morphology continuously decreased. Detachment of individual cells was preceded by extensive vacuolization and the development of trypan blue permeability (J. J. Reiners, unpublished data).
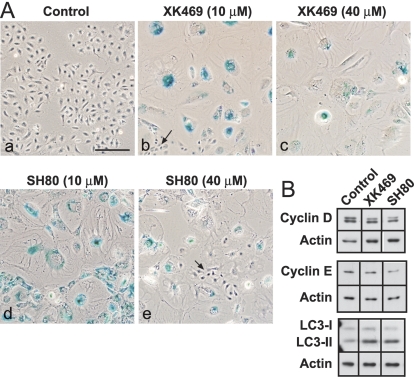
The flattened, vacuolated morphology of XK469/SH80-treated cultures was suggestive of cells that had undergone senescence. The induction of senescence in melanocytes often entails the up-regulated expression of p16 and the down-regulated expressions of G1 phase cyclins (Bandyopadhyay and Medrano, 2000; Bandyopadhyay et al., 2001; Bennett and Medrano, 2002). Whereas p16 was not detected in control cells, cyclin E was readily detected (Fig. 9A). Exposure to 40 μM XK469 for up to 96 h did not change the expression patterns of either protein (Fig. 9A). In contrast, p21 contents increased in a concentration-dependent fashion in XK469-treated cultures during the first 96 h (Fig. 9, A and B) and correlated with the degree to which proliferation was suppressed (compare Fig. 2, A and C, with Fig. 9A). Finally, attempts were made to detect senescent cells by staining for β-galactosidase activity at pH 6.0. We observed no pH 6-related β-galactosidase staining in control cultures (Fig. 10Aa) or in Melan-a cultures analyzed after 5 days of 40 μM XK469 treatment (J. J. Reiners, unpublished data). However, senescence-associated β-galactosidase was readily apparent in cultures treated with XK469 or SH80 for 5 days and subsequently stained 14 to 15 days after additional culture in drug-free medium (Fig. 10A). The acquisition of senescence-associated β-galactosidase staining was accompanied by reductions in cyclin D1 and cyclin E contents (Fig. 10B). However, we were unable to detect the accumulation of p16 (J. J. Reiners, unpublished data). Senescent Melan-a cells exhibited pronounced accumulations of the autophagosome protein LC3-II (Fig. 10B).
Fig. 10.
XK469- and SH80-induced senescence. Melan-A cultures were treated 1 day after plating with 10 or 40 μM of either XK469 or SH40. After 5 days of treatment cultures were washed and refed with drug-free, fresh medium. Cultures were subsequently refed with drug-free medium every 4th day. A, XK469- and SH80-treated cultures were washed and fixed for β-galactosidase staining 16 and 17 days after termination of treatment, respectively. Control cells were passaged in parallel in drug-free medium and photographed 3 days after plating. Bar in a, 200 μm. Arrows in b and e point to normal cells that escaped cytostatic/cytotoxic effects of the drugs and that subsequently proliferated. β-Galactosidase activity is indicated by blue staining. B, cultures were treated as described above with 40 μM XK469 or SH80 and harvested for Western blot analyses 14 days after cessation of treatment. Analyses are of 25 μg protein/lane. Each row in B was derived from the same gel scan that had been “cut and pasted” so as to reorder the lanes.
Discussion
The cytostatic activities of XK469 and SH80 have been partially attributed to their abilities to induce G2/M arrest (Ding et al., 2001; Lin et al., 2002a,b; Ling et al., 2004; Kessel et al., 2007). With the exception of a study reporting that XK469 arrests H116 human colon carcinoma cells in prophase (Lin et al., 2002b), nothing else has been published related to the identities of the tetraploid populations accumulating in XK469/SH80-treated cultures. The binuclear status of the tetraploid populations observed in the current study indicates that XK469/SH80-treated Melan-a cultures proceed through telophase but do not undergo cytokinesis. XK469/SH80-mediated suppression of cytokinesis was not unique to Melan-a cells. Binucleated cells were also observed in MCF10A and 1c1c7 cultures after exposures to concentrations of XK469 or SH80 sufficient to induce tetraploidy. Furthermore, a recent report by Kessel et al. (2007) included pictures of XK469- and SH80-treated HO33342-stained murine leukemia L1210 cultures that were multinucleated. We subsequently have reanalyzed XK469- and SH80-treated L1210 cells by FACS using gating parameters that include polyploid cells. When appropriately gated, we can easily detect an octoploid population in XK469-treated L1210 cultures (J. J. Reiners, unpublished data). Hence, suppression of cytokinesis may be a general property of XK469/SH80.
Analyses of RNA interference knockdown libraries, classic genetic analyses, and proteomic analyses of the midbody have identified proteins and signaling pathways critical to the regulation and cellular execution of cytokinesis (Huh et al., 2003; Kamath et al., 2003; Eggert et al., 2004; Skop et al., 2004). High-throughput screening of small-molecule libraries has identified a limited number of agents that suppress cytokinesis via their targeting of actin, myosin II, Aurora B kinase, or Polo-like kinase 1 (McInnes et al., 2005; Santamaria et al., 2007; Andersen et al., 2008). Currently, we do not know the mechanism by which XK469 or SH80 suppress cytokinesis. However, under no circumstance did we ever observe the development of any vestige of a cleavage furrow in any of the cell lines examined. The lack of this morphological feature suggests that XK469/SH80 may be modulating critical events occurring at the central spindle.
Although XK469 suppressed cytokinesis in three of the four cell lines we tested, the immediate fate of the binucleated tetraploid populations varied from cell type to cell type. For example, although many tetraploid Melan-a cells underwent minimally a second round of replication within 72 to 96 h of treatment, a comparable effect was not observed in MCF10A cultures. For many years, it was believed that there existed a checkpoint in G1 at which tetraploid binucleated cells arrested to prevent the possible propagation of cells with increased probability for aneuploidy (Andreassen et al., 2001). However, recent studies have established that the arrest attributed to the putative G1 tetraploid checkpoint reflects collateral effect(s) of the agents used to suppress cytokinesis, as opposed to being a response to tetraploidy per se (Uetake and Sluder, 2004). Hence, differences in XK469-induced collateral effects may be the basis for the cell type responses observed in our studies. Although speculative, the G1 cdk inhibitor p21 may be a mediator of the collateral effects. The degree to which p21 expression is up-regulated by XK469 varies markedly from cell type to cell type (Ding et al., 2001).
Melan-a cells are not immortal and undergo senescence upon continuous passaging in culture. Passage-associated senescence of nontreated cells was associated with cell flattening, enlargement, and accumulation of multiple nuclei (P. A. Mathieu and J. J. Reiners, unpublished observations). For the studies reported herein, we employed low-passage cultures in our treatment protocols. Exposure to ≥10 μM XK469 or SH80 seemed to hasten the onset of senescence, as monitored by senescence-associated β-galactosidase staining, reductions in G1 phase cyclins, loss of proliferative capacity, and morphology. The basis for the XK469/SH80-induced acceleration of Melan-a senescence is not known. However, it may be related to effects upon cytokinesis because passage-associated senescence of nontreated cells was also associated with the accumulation of multiple nuclei. We have not tested the ability of XK469/SH80 to induce senescence in other cell types.
XK469 is cytotoxic to a variety of cell lines and seems capable of inducing both apoptotic and autophagic death. For example, ovarian tumor cells (Ding et al., 2002) and a line derived from a Waldenström's macroglobulinemia tumor (Mensah-Osman et al., 2003) die after XK469 treatment with characteristics consistent with apoptosis. In contrast, L1210 cells treated with a cytotoxic concentration of XK469 die as a consequence of processes related to the development of autophagy (Kessel et al., 2007). In this latter study, autophagic death was not a default reaction because of a defect in apoptosis because cotreatment of XK469-treated L1210 cultures with a proapoptotic agent caused the rapid induction of apoptosis. In the current study, XK469-treated Melan-a cultures exhibited the characteristics of cells undergoing both autophagy and apoptosis. The observed precipitous loss of Bcl-2 in XK469-treated cultures should facilitate both the development of apoptosis and autophagy. With respect to the latter, studies from Levine's laboratory have shown that Bcl-2 overexpression suppresses stress-induced autophagy via its interaction with Beclin/Atg8 (Pattingre et al., 2005). Conversely, antisense knockdown of Bcl-2 in HL-60 has been reported to induce autophagy (Saeki et al., 2000), and siRNA-mediated knockdown of Bcl-2 dramatically enhanced stress-induced autophagy in HeLa cultures (Pattingre et al., 2005). In the case of the current study, we speculate that apoptosis is primarily responsible for the killing observed during the first 5 days of treatment. Dying cells had an apoptotic morphology, and the kinetics of caspase activation paralleled the appearance of dying cells. Although the kinetics of LC3-II accumulation (a marker of autophagy) also paralleled the initial appearance of dying cells, weak and strongly cytotoxic concentrations of XK469 yielded similar accumulations of LC3-II. The initial autophagic response may be a stress response and acting in a prosurvival fashion, as has been observed in other studies (Abedin et al., 2007; Katayama et al., 2007; Elliott and Reiners, 2008). The role that autophagy plays in the death/survival of senescent cells originating from cultures treated weeks earlier with XK469/SH80 is not known. However, what is clear is that the senescent population exhibited morphological and biological properties of autophagic cells and died with nonapoptotic morphological features.
XK469 initially attracted attention in the cancer field because of its ability to arrest/kill a variety of drug-resistant solid tumor types, both in culture and in xenograft studies (Corbett et al., 1998; Hazeldine et al., 2001; Hazeldine et al., 2005). It was initially believed that the drug's cytotoxicity was mediated via inhibition of topoisomerase IIβ (Gao et al., 1999). However, at least one published study discounts this mechanism (Mensah-Osman et al., 2002). In the current study, we have identified two novel activities of XK469/SH80: the ability to suppress cytokinesis and accelerate the onset of senescence. The former activity may be the basis for the noted accumulation of tetraploid populations in a variety of XK469/SH80-treated tumor cell lines (Ding et al., 2001; Lin et al., 2002a,b; Ling et al., 2004; Kessel et al., 2007). Of note, however, are our findings that the effects on cytokinesis occurred in both pseudonormal and tumorigenic cell types over a similar range of concentrations. Because our survey of cell types was limited, additional studies are necessary to ascertain whether some tumor types exhibit selective sensitivity to the quinoxaline derivatives. Such information is critical to the therapeutic use of the agents.
M.K. was supported by the National Institutes of Health National Institute of Environmental Health Sciences [Grant T32-ES012163]. This project used the services of the Imaging and Cytometry Facility Core, supported by the National Institutes of Health National Institute of Environmental Health Sciences [Grant P30-ES06639].
doi:10.1124/jpet.108.144808.
ABBREVIATIONS: XK469, 2-{4-[(7-chloro-2-quinoxalinyl)oxy]phenoxy}propionic acid; SH80, 2-{4-[(7-bromo-2-quinolinyl)oxy]phenoxy}-propionic acid; XK472, ethyl 2-{4-[(6-chloro-2-quinoxalinyl)oxy]phenoxy}propionate; HO33342, Höechst dye HO33342; HA14-1, ethyl 2-amino-6-bromo-4-(1-cyano-2-ethoxy-2-oxoethyl)-4H-chromene-3-carboxylate; AMC, 7-amino-4-methylcoumarin; PBS, phosphate-buffered saline; SSC, side light scatter; FSC, forward light scatter; FAM-VAD-FMK, carboxyfluorescein derivative of valine-alanine-aspartic acid-fluoromethyl ketone; FACS, fluorescence-activated cell sorting; LC3-II, phosphatidylethanolamine-modified LC3-I.
References
- Abedin MJ, Wang D, McDonnell MA, Lehmann U, and Kelekar A (2007) Autophagy delays apoptotic death in breast cancer cells following DNA damage. Cell Death Differ 14 500-510. [DOI] [PubMed] [Google Scholar]
- Andersen CB, Wan Y, Chang JW, Riggs B, Lee C, Liu Y, Sessa F, Villa F, Kwiatkowski N, Suzuki M, et al. (2008) Discovery of selective aminothiazole aurora kinase inhibitors. ACS Chem Biol 3 180-192. [DOI] [PubMed] [Google Scholar]
- Andreassen PR, Lohez OD, Lacroix FB, and Margolis RL (2001) Tetraploid state induces p53 dependent arrest of non-transformed mammalian cells in G1. Mol Biol Cell 12 1315-1328. [DOI] [PMC free article] [PubMed] [Google Scholar]
- Bandyopadhyay D and Medrano EE (2000) Melanin accumulation accelerates melanocyte senescence by a mechanism involving p16INKa/CDK4/pRB and E2F1. Ann N Y Acad Sci 35 317-729. [DOI] [PubMed] [Google Scholar]
- Bandyopadhyay D, Timchenko N, Suwa T, Hornsby PJ, Campisi J, and Medrano EE (2001) The human melanocyte, a model system to study the complexity of cellular aging and transformation in non-fibroblastic cells. Exp Gerontol 36 1265-1275. [DOI] [PubMed] [Google Scholar]
- Bennett DC, Cooper PJ, and Hart IR (1987) A line of non-tumorigenic mouse melanocytes, syngeneic with the B16 melanoma and requiring a tumour promoter for growth. Int J Cancer 39 414-418. [DOI] [PubMed] [Google Scholar]
- Bennett DC and Medrano EE (2002) Molecular regulation of melanocyte senescence. Pigment Cell Res 15 242-250. [DOI] [PubMed] [Google Scholar]
- Caruso JA, Mathieu PA, Joiakim A, Leeson B, Kessel D, Sloane BF, and Reiners JJ Jr (2004) Differential susceptibilities of murine hepatoma 1c1c7 and Tao cells to the lysosomal photosensitizer NPe6: influence of aryl hydrocarbon receptor on lysosomal fragility and protease contents. Mol Pharmacol 65 1016-1028. [DOI] [PubMed] [Google Scholar]
- Corbett TH, LoRusso P, Demchick L, Simpson C, Pugh S, White K, Kushner J, Polin L, Meyer J, Czarnecki J, et al. (1998) Preclinical antitumor efficacy of analogues of XK469: sodium 2-{4-[(7-chloro-2-quinoxalinyl)oxy]phenoxy}proprionate. Invest New Drugs 16 129-139. [DOI] [PubMed] [Google Scholar]
- Dengjel J, Schoor O, Fischer R, Reich M, Kraus M, Muller M, Kreymborg K, Altenberend F, Brandenburg J, Kalbacher H, et al. (2005) Autophagy promotes MHC class II presentation of peptides from intracellular source proteins. Proc Natl Acad Sci U S A 102 7822-7827. [DOI] [PMC free article] [PubMed] [Google Scholar]
- Ding Z, Parchment RE, LoRusso PM, Zhou JY, Li J, Lawrence TS, Sun Y, and Wu GS (2001) The investigational new drug XK469 induces G2/M cell cycle arrest by p53-dependent and -independent pathways. Clin Cancer Res 7 3336-3342. [PubMed] [Google Scholar]
- Ding Z, Zhou JY, Wei WZ, Baker VV, and Wu GS (2002) Induction of apoptosis by the new anticancer drug XK469 in human ovarian cancer cell lines. Oncogene 21 4530-4538. [DOI] [PubMed] [Google Scholar]
- Eggert US, Kiger AA, Richter C, Perlman ZE, Perrimon N, Mitchison TJ, and Field CM (2004) Parallel chemical genetic and genome-wide RNAi screens identify cytokinesis inhibitors and targets. PLoS Biol 2 2135-2143. [DOI] [PMC free article] [PubMed] [Google Scholar]
- Elliott A and Reiners JJ Jr (2008) Suppression of autophagy enhances the cytotoxicity of the DNA-damaging aromatic amine p-anilinoaniline. Toxicol Appl Pharmacol 232 169-179. [DOI] [PMC free article] [PubMed] [Google Scholar]
- Gao H, Huang KC, Yamasaki EF, Chan KK, Chohan L, and Snapka RM (1999) XK469, a selective topoisomerase IIβ poison. Proc Natl Acad Sci U S A 96 12168-12173. [DOI] [PMC free article] [PubMed] [Google Scholar]
- Guo M, Mathieu PA, Linebaugh B, Sloane BF, and Reiners JJ Jr (2002) Phorbol ester activation of a proteolytic cascade capable of activating latent transforming growth factor-beta. J Biol Chem 277 14829-14837. [DOI] [PubMed] [Google Scholar]
- Hazeldine ST, Polin L, Kushner J, Paluch J, White K, Edelstein M, Palomino E, Corbett TH, and Horwitz JP (2001) Design, synthesis and biological evaluation of analogues of the antitumor agent, 2-{4-[(7-chloro-2-quinoxalinyl)oxy]-phenoxy}propionic acid (XK469). J Med Chem 44 1758-1776. [DOI] [PubMed] [Google Scholar]
- Hazeldine ST, Polin L, Kushner J, White K, Corbett TH, and Horwitz JP (2005) Synthetic modification of the 2-oxypropionic acid moiety in 2-{4-[(7-chloro-2-quinoxalinyl)oxy]phenoxy}propionic acid (XK469), and consequent antitumor effects. Bioorg Med Chem 13 3910-3920. [DOI] [PubMed] [Google Scholar]
- Huh WK, Falvo JV, Gerke LC, Carroll AS, Howson RW, Weissman JS, and O'Shea EK (2003) Global analysis of protein localization in budding yeast. Nature 425 686-691. [DOI] [PubMed] [Google Scholar]
- Kamath RS, Fraser AG, Dong Y, Poulin G, Durbin R, Gotta M, Kanapin A, Le Bot N, Moreno S, Sohrmann M, et al. (2003) Systematic functional analysis of the Caenorhabditis elegans genome using RNAi. Nature 421 231-237. [DOI] [PubMed] [Google Scholar]
- Katayama M, Kawaguchi T, Berger MS, and Pieper RO (2007) DNA damaging agent-induced autophagy produces a cytoprotective adenosine triphosphate surge in malignant glioma cells. Cell Death Differ 14 548-558. [DOI] [PubMed] [Google Scholar]
- Kessel D, Reiners JJ Jr, Hazeldine ST, Polin L, and Horwitz JP (2007) The role of autophagy in the death of L1210 leukemia cells initiated by the new antitumor agents, XK469 and SH80. Mol Cancer Ther 6 370-379. [DOI] [PMC free article] [PubMed] [Google Scholar]
- Kessel D, Vicente MG, and Reiners JJ Jr (2006) Initiation of apoptosis and autophagy by photodynamic therapy. Lasers Surg Med 38 482-488. [DOI] [PMC free article] [PubMed] [Google Scholar]
- Lin H, Liu XY, Subramanian B, Nakeff A, Valeriote F, and Chen BD (2002a) Mitotic arrest induced by XK469, a novel antitumor agent, is correlated with the inhibition of cyclin B1 ubiquitination. Int J Cancer 97 121-128. [DOI] [PubMed] [Google Scholar]
- Lin H, Subramanian B, Nakeff A, and Chen BD (2002b) XK469, a novel antitumor agent, inhibits signaling by the MEK/MAPK signaling pathway. Cancer Chemother Pharmacol 49 281-286. [DOI] [PubMed] [Google Scholar]
- Ling ZH, Du H, Yuan CQ, Ma SD, Zheng L, and Ding ZH (2004) Effect of XK469 and Adriamycin on the growth of H460 cells in vitro and its mechanism. Di Yi Jun Yi Da Xue Xue Bao 24 775-778. [PubMed] [Google Scholar]
- McInnes C, Mezna M, and Fischer PM (2005) Progress in the discovery of polo-like kinase inhibitors. Curr Top Med Chem 5 181-197. [DOI] [PubMed] [Google Scholar]
- Mensah-Osman EJ, Al-Katib AM, Dandashi MH, and Mohammad RM (2002) 2-[4-(7-chloro-2-quinoxalinyloxy)phenoxy]-propionic acid (XK469) inhibition of topoisomerase IIβ is not sufficient for therapeutic response in human Waldenström's macroglobulinemia xenograft model. Mol Cancer Ther 1 1315-1320. [PubMed] [Google Scholar]
- Mensah-Osman E, Al-Katib A, Dandashi M, and Mohammad R (2003) XK469, a topo IIβ inhibitor, induces apoptosis in Waldenström's macroglobulinemia through multiple pathways. Int J Oncol 23 1637-1644. [PubMed] [Google Scholar]
- Mizushima N and Yoshimori T (2007) How to interpret LC3 immunoblotting. Autophagy 3 542-545. [DOI] [PubMed] [Google Scholar]
- Münz C (2006) Autophagy and antigen presentation. Cell Microbiol 8 891-898. [DOI] [PubMed] [Google Scholar]
- Pattingre S, Tassa A, Qu X, Garuti R, Liang XH, Mizushima N, Packer M, Schneider MD, and Levine B (2005) Bcl-2 antiapoptotic proteins inhibit Beclin 1-dependent autophagy. Cell 122 927-939. [DOI] [PubMed] [Google Scholar]
- Reiners JJ Jr, Clift R, and Mathieu P (1999) Suppression of cell cycle progression by flavonoids: dependence on the aryl hydrocarbon receptor. Carcinogenesis 20 1561-1566. [DOI] [PubMed] [Google Scholar]
- Saeki K, Yuo A, Okuma E, Yazaki Y, Susin SA, Kroemer G, and Takaku F (2000) Bcl-2 down-regulation causes autophagy in a caspase-independent manner in human leukemic HL60 cells. Cell Death Differ 7 1263-1269. [DOI] [PubMed] [Google Scholar]
- Santamaria A, Neef R, Eberspächer U, Eis K, Husemann M, Mumberg D, Prechtl S, Schulze V, Siemeister G, Wortmann L, et al. (2007) Use of the novel Plk1 inhibitor ZK-thiazolidinone to elucidate functions of Plk1 in early and late stages of mitosis. Mol Biol Cell 18 4024-4036. [DOI] [PMC free article] [PubMed] [Google Scholar]
- Skop AR, Liu H, Yates J 3rd, Meyer BJ, and Heald R (2004) Dissection of the mammalian midbody proteome reveals conserved cytokinesis mechanisms. Science 305 61-66. [DOI] [PMC free article] [PubMed] [Google Scholar]
- Thomadaki H and Scorilas A (2006) BCL2 family of apoptosis-related genes: functions and clinical implications in cancer. Crit Rev Clin Lab Sci 43 1-67. [DOI] [PubMed] [Google Scholar]
- Uetake Y and Sluder G (2004) Cell cycle progression after cleavage failure: mammalian somatic cells do not possess a “tetraploidy checkpoint.” J Cell Biol 165 609-615. [DOI] [PMC free article] [PubMed] [Google Scholar]
- van der Bruggen P and Van den Eynde BJ (2006) Processing and presentation of tumor antigens and vaccination strategies. Curr Opin Immunol 18 98-104. [DOI] [PubMed] [Google Scholar]
- Wang JL, Liu D, Zhang ZJ, Shan S, Han X, Srinivasula SM, Croce CM, Alnemri ES, and Huang Z (2000) Structure-based discovery of an organic compound that binds Bcl-2 protein and induces apoptosis of tumor cells. Proc Natl Acad Sci U S A 97 7124-7129. [DOI] [PMC free article] [PubMed] [Google Scholar]


