

SUMMARY
The integrin collagen receptor locus on human chromosome 5q11.2 includes the integrin genes ITGA1 and ITGA2, and the cell cycle regulation gene PELO, embedded within ITGA1 intron 1. ITGA1 contains a CArG box that is bound by serum response factor (SRF), while PELO contains two Sp1 binding elements. A comparison of mRNA levels in megakaryocytic (MK) and non-megakaryocytic (non-MK) cell lines and an analysis of the transcriptional activity of promoter-LUC reporter gene constructs in transfected cells revealed that ITGA1 is selectively suppressed in the MK lineage. Sodium bisulfite genomic sequencing established that a CpG-rich ITGA1 promoter region (−209/+115) is fully methylated at 19 CpG sites in MK cells that do not express α1β1, but completely demethylated in expressing cells. In vitro methylation of ITGA1 suppresses transcription, while treatment of megakaryocytic cells with 5-aza-2′-deoxycytidine, but not Trichostatin A, resulted in de novo expression of ITGA1. During thrombopoietin-induced in vitro differentiation of primary human cord blood mononuclear cells into megakaryocytes, we observed rapid, progressive CpG methylation of ITGA1, but not PELO or ITGA2. Thus, selective CpG methylation of the ITGA1 promoter is a specific feature of α1β1 regulation that coincides with the initiation of megakaryocyte differentiation.
Keywords: integrin, pelota, collagen, megakaryocyte, gene, differentiation
INTRODUCTION
The human genes for integrin subunits α1 (ITGA1) and α2 (ITGA2) are located adjacent to each other on chromosome 5 (5q11.2), where ITGA1 lies 32 kb upstream from the 5′ regulatory region of ITGA2 (Figure 1A). Together with phylogenetic evidence [1], the tandem location of these genes and a nearly perfect conservation of exon boundaries suggest that ITGA2 was derived from the ancestral ITGA1 by duplication. No other pair of integrin subunit genes is more closely associated within the human genome. Both α1β1 and α 2β1 are receptors for collagen and laminin that are present in most tissues, but are expressed in a cell-specific manner. A prominent exception are cells of megakaryocyte lineage, in which α 1β1 is not expressed.
FIGURE 1.

(A) The human ITGA1-PELO-ITGA2 locus is situated on chromosome 5q11.2 ITGA1 is separated from ITGA2 by only 32 Kb. The locus is demarcated by the expressed sequence tag (EST) D5S202 at the 5′ end, D5S623 in the center and D5S2037 at the 3′ end. (B) The human PELO gene is embedded within intron 1 of ITGA1. Human PELO consists of two translated exons (Exons 2 and 3) that encode the 385 amino acid protein, pelota. An untranslated Exon 1 starts 11.1kb downstream from the beginning of ITGA1 intron 1.
The transcriptional regulation of ITGA1 has been characterized only in the chicken [2,3] where serum response factor (SRF) is a prominent enhancer recognizing a CArG box sequence within the proximal promoter. In this report, we show that this CArG-like sequence is highly conserved and the most prominent similarity between human ITGA1 and chicken Itga1 5′ regulatory region sequences. In vitro experiments using lucirease reporter constructs indicate that it likely plays a significant role in the enhancement of ITGA1 transcription.
The human gene PELO is entirely embedded within the large intron 1 (69 Kb) of ITGA1 (Figure 1B). It consists of two translated exons: the first exon (958 base pairs) begins approximately 12.1 kb downstream from the beginning of ITGA1 intron 1 and contains the ATG start codon; the second exon (626 base pairs) ends 47.4 kb upstream from the beginning of ITGA1 exon 2. The relationship, if any, of PELO to ITGA1 and ITGA2 is unknown. PELO, which encodes the protein pelota, was originally discovered in Drosophila melanogaster [4]. The gene is also expressed in mice [5] and humans [6], and homologs have been identified in Archaebacteria [7], yeast [8] and plants (Arabidopsis thaliana) [9]. In Drosophila, pelo mutations result in cell cycling abnormalities, reflected in spermatogenetic arrest, female sterility, and disturbances in the patterning of the eye [4]. The mutation of the PELO-related yeast gene dom34 results in disturbances of mitotic and meiotic cell cycling [8]. These findings suggest that pelota is involved in cell cycle regulation. In this study, we show that PELO transcription is largely controlled by Sp1, which is a ubiquitous transcription factor.
The selective suppression of ITGA1 within the megakaryocyte lineage must result from locally-restricted modifications that specifically affect ITGA1 transcription, since the physically proximal genes ITGA2 and PELO are not affected. Methylation of cytosines within the dinucleotide sequence CpG is a common mechanism of transcriptional suppression in vertebrates [10], which can be involved in the establishment and maintenance of cell type-specific gene expression [11], since methylation patterns of tissue-specific genes are unequivocally different from tissue to tissue [12]. In this study, we show that CpG methylation plays a role in coordinated ITGA1 regulation during human megakaryocyte differentiation.
METHODS
Sequence Analysis
DNA sequences were obtained using an Applied Biosystems ABI Prism Model 377 DNA Sequencer (Perkin-Elmer Applied Biosystems, Inc., Foster City, CA) by personnel in the DNA Core Laboratory of the Department of Molecular and Experimental Medicine, The Scripps Research Institute.
Monoclonal Antibodies
The gene PELO, obtained by polymerase chain reaction (PCR) using Hela cDNA as template, was cloned into the pET28a expression vector (Novagen, San Diego, CA) that allows fusion of the protein with an N-terminal 6XHis tag using NdeI and EcoRI restriction sites. This plasmid was used to transform Escherichia coli BL21 (DE3) (Invitrogen, Carlsbad, CA). Purification of the protein was accomplished by affinity chromatography with Ni-NTA agarose resin (Qiagen Corporation, Valencia, CA) following the manufacturer’s instructions. The eluate was then dialyzed against phosphate-buffered saline (PBS) and pH 7.4, for approximately 20 hours at 4°C. Protein in the final preparation was quantified by the Bradford method. Immunization of mice and hybridoma fusion were performed by the Antibody Core Lab of The Scripps Research Institute. Briefly, four Balb/C mice were immunized intraperitoneally with 50 μg of the recombinant protein pelota mixed with RIBI’s adjuvant system (Monophosphoryl-lipid A + Trehalose dicorynomycolate adjuvant (Sigma Aldrich, St. Louis, MO)). This was followed by three intraperitoneal injections of pelota mixed with RIBI’s adjuvant system. Three days before fusion, the mouse with the highest titer of serum antibodies specific for pelota, by an indirect ELISA, was boosted with 20 μg of the protein intravenously. Primary hybridomas were screened for specific antibodies by indirect ELISA with the immunogen as antigen. Supernatants showing the highest titer were screened ability to bind to pelota by western blot. Positive hybridomas were then subcloned twice by limiting dilution.
Western blot assays
Nuclear and cytoplasmic extracts were prepared as described by Geneste and al. (1996). Total cells lysate was prepared in 0.04 M Tris HCl (pH 7.5), 0.15 M NaCl, 1 % Triton X-100 (Sigma Aldrich), and the protease inhibitor cocktail Complete EDTA free (Roche Applied Biosystems, Indianapolis, IN). Briefly, 20 μg of nuclear or cytoplasmic protein were loaded into the wells of a 4–12 % linear gradient polyacrylamide gel and subjected to electrophoresis in the presence of sodium dodecyl sulfate (SDS-PAGE), as previously described [13]. The separated proteins were then transferred electrophoretically to a nitrocellulose membrane. Membranes were blocked with 5 % (w/v) bovine serum albumin (Sigma Aldrich) in 1.5 M NaCl, 0.2 M Tris, 0.1 % (v/v) Tween 20, pH 7.6 (TBS-T) and immersed in a solution containing 0.8 μg/ml monoclonal mouse anti-pelota antibody 1A3 or GAPDH (Ambion, Austin, TX) for 2 hours at room temperature. After three washes of 15 min each in TBS-T with gentle agitation, the membranes were immersed in a solution containing the secondary Horseradish peroxidase (HRP)-conjugated anti-mouse IgG antibody (Invitrogen) diluted 1/3500 and incubated for 1 hour at ambient temperature. After three additional washes of 15 min each in TBS-T, bound antibody was visualized by chemiluminescence.
Cultured Human Cell Lines
The Dami cell line (a subclone of HEL) was a generous gift from Dr. David Wilcox (Medical College of Wisconsin, Milwaukee, WI). The megakaryocyte cell line CHRF-288-11 [14] was a gift from Dr. M.A. Lieberman (Cincinnati, OH). The human cell lines K562, HEL, C8161, HeLa and HEK293 were purchased from the American Type Culture Collection (Manassas, VA). For treatment with 5-aza-2′-deoxycitidine (5-aza-dC; Sigma, St. Louis, MO), cells were split to 105 cells/ml and cultured in the presence of 10μM 5-aza-dC in DMSO for 48 hours. The final concentration of DMSO was 0.1 % (v/v). Control cells were cultured in the presence of an identical 0.1% DMSO alone for 48 h. For treatment with Trichostatin A (TSA; Sigma), cells were split to 105 cells/ml and cultured in the presence of 50 nM TSA for 48 h. Control cells were cultured in the presence of an equivalent volume of buffer alone.
RT-PCR
RNA was extracted using the TRIZOL reagent (GIBCO BRL, Gaithersburg, MD) according to the manufacturer’s instructions. Total RNA was reverse transcribed using Superscript II reverse transcriptase (GIBCO BRL), and random hexanucleotides as primers at 48°C for 50 min. After reverse transcription, samples were subjected to amplification with Taq DNA polymerase(Qiagen), using pairs of oligonucleotide primers as follows:
ITGA1 forward, 5′-GCTGGCTCCTCACTGTTGTT -3′;
ITGA1 reverse, 5′-CTCCATTTGGGTTGGTGACT -3′;
ITGA2 forward, 5′-TGCTGGTTGAAAGACGTTCACATG -3′;
ITGA2 reverse, 5′-TATAACTCCTGTTGGTACTTCGGC-3′;
PELO forward, 5′-GCGCCACATACACTTTGATG -3′;
PELO reverse, 5′-GGCTAGCCACAGTAGGGTCA-3′;
HPRT forward, 5′-AGTGATGATGAACCAGGT-3′;
HPRT reverse, 5′-GGCTTTGTATTTTGCTTTTC-3′
Primer extension
10 picomoles of the primer GSP8 (ACGCTTTTCACATCCCAGAC) were end labeled and purified using QIAquick Nucleotide Removal Kit (Qiagen). 15μg of total RNA was incubated with 106cpm of GSP8 in a 25μl reaction containing 0.1M KCl, 40mM Tris-HCl ( pH 8.3), and 1mM EDTA at 90 °C for 10min and then 65 °C for 30 min and, finally, 37°C for 18hr. The hybridization mixture was added to 25μl of 0.8mM dNTPs, 15mM MgCl2, 20mM dithiothreitol, and then extended with 200 units of Superscript II reverse transcriptase at 42°C for 60min. The cDNA was precipitated, resuspended in the loading buffer, resolved in a 6% acrylamide/7M urea gel, and visualized with autoradiography.
5′ RACE
5′RACE was performed on 5μg samples of total RNA using the GIBCO BRL 5′RACE System according to the manufacturer’s instructions. In the case of ITGA1 mRNA, reverse transcription was primed with A1GSP4 (CTGACGTCAGAACAGATTCCAGT). The product of this first strand synthesis was tailed with dCTP and amplified using the abridged anchor primer and the nested primer GSP5 (CTCCATTTGGGTTGGTGACT). The product obtained was re-amplified using the abridged universal amplification primer and further nested primer GSP8 (ACGCTTTTCACATCCCAGAC). The reaction product was gel-purified and cloned into pGEM-T easy (Promega). Eleven different plasmid clones containing the desired product were sequenced. In the case of PELO mRNA, the same procedure was employed using the PELO3 (CCTCTTCAGAACTGGAATCACCC) to prime reverse transcription, PELO 4 (CCCCAGTCAACTGGCTGAGCTG) as the first nested primer, and PELO 7 (CTTCCCCAGCAGCTTTAGTGTC) as the last nested primer. Six different plasmid clones containing the desired product were sequenced.
Plasmid constructions and transfection of cell lines
To study the transcription of the ITGA1 gene, we constructed a series of reporter plasmids containing segments of the 5′-flanking region of the ITGA1 gene extending from −981, −397, −216, −53, +315 through +455. These fragments were amplified by polymerase chain reaction with XhoI sites at 5′-and 3′-ends using genomic DNA as template. These products were ligated into the polylinker site upstream of the luciferase reporter gene in the pGL2-basic plasmid. The same approach was used to generate a series of reporter pGL2b plasmids containing segments of the 5′-flanking region of the PELO gene extending from ′811, −433, −172, −119 and +138 to +180. Dami cells were maintained in Iscove’s Modified Dulbecco’s Medium (IMDM; GIBCO/BRL, Burlington, ON, Canada) supplemented with 10% horse serum at 37°C under 5% CO2. Transfections were performed with the Effectene transfection reagent (Qiagen, Mississauga, ON, Canada) according to the manufacturer’s indications.
EMSA
An optimal number of Dami cells (1 × 10⁸) were washed twice in PBS (centrifugation at 1800 × g for 10 minutes) and then lysed in 0.5 ml of 0.5% (vol/vol) Nonidet P-40 in 25 mM HEPES, 50 mM KCl, pH 7.9, containing 1 mM phenylmethylsulfonylfluoride (PMSF), 100 mM dithiothreitol (DTT), 10 mg/ml leupeptin, and 20 mg/ml aprotonin (lysis buffer). The nuclei were pelleted and rinsed once in lysis buffer without Nonidet P-40 (centrifugation at 10,000 × g for 1 minute). By vigorous micropipetting, nuclei were then physically disrupted in 25 mM HEPES, 500 mM KCl, pH 7.9, containing 10 % (vol/vol) glycerol, 1 mM PMSF, 100 mM DTT, 10 mg/ml leupeptin, and 20 mg/ml aprotonin (extraction buffer). When nuclei were sufficiently emulsified, the mixtures were centrifuged at 10 000 × g for 5 minutes, and the supernatants were collected. The concentration of nuclear proteins in the supernatants was determined by the method of Bradford [15]. Double-stranded DNA probes (Table 1) were end-labeled with α32P–deoxycytidine triphosphate using Klenow DNA polymerase [16]. Five to ten mg nuclear protein were mixed with labeled DNA (5 × 10⁴ cpm) in 10 ml of 25 mM HEPES, 50 mM KCl, 0.5 mM EDTA, pH 7.9, containing 10% (vol/vol) glycerol, 0.5 mM PMSF, and 0.5 mM DTT (binding buffer) and incubated at ambient temperature for 1 hour. In reactions using competitor DNA, a molar excess (as indicated) of the unlabeled competitor DNA fragment was used. In antibody-based supershift experiments, 3 mg of rabbit polyclonal anti-Sp1 or anti-Serum Response Factor (Santa Cruz Biotechnology, Inc., Santa Cruz, CA) were preincubated with the nuclear extract for 15 minutes at ambient temperature before addition of the α32P-labeled DNA probe. The reaction products were separated by polyacrylamide gel electrophoresis using 4% acrylamide/Bis (19:1) in 10.5 X Tris-borate-EDTA buffer (TBE; Invitrogen, Carlsbad, CA). Protein complexes were visualized by autoradiography.
Table 1.
EMSA Oligonucleotide Probes
Bisulfite treatment of DNA samples
One μg genomic DNA was denatured in 50 μL 0.2 M NaOH at 37°C for 20 minutes and then mixed with 30 μL 10 mM hydroquinone (Sigma, St Louis, MO) and 520 μL 3 M sodium bisulfite (pH 5.0) (Sigma). Reactants were incubated at 55°C for 16 hours. Bisulfite-modified DNA was purified using the Wizard purification resin and a Vacuum Manifold (Promega) and eluted into 50 μL water. After addition of 5.5 μL of 3 M NaOH (final 0.3 M), samples were let stand at 37°C for 20 minutes, then precipitated in ethanol and dissolved in 20 μL of water. A fragment of genomic DNA encompassing the CpG island of ITGA1 (−235 to +152) was amplified by PCR using the following primers: forward, 5′-GGATGGAAGGGGGGATT-3′; and reverse, 5′-TCTCTAAAATCTCACTAACAA-3′. In the case of ITGA2, the CpG island −251 to +35 was amplified with the primer pair: forward, 5′-CAGGGCAGGAAAGCCTGCCAGG-3′; and reverse, 5′-AAGCTGTCCAGAGGGCTTCTCTCC-3′. For PELO, the CpG island −424 to +57 was amplified with the primer pair: forward, 5″-GGGCCAAATCTGCACTTCTGAGAG-3; and reverse, 5′-AGCACTTCCTCTATCCTTTCCTCTCTCAGTCTCC-3′. In the case of established cell lines, PCR products were directly sequenced; when primary mononuclear or CD41-enriched cells were studied, the PCR products were gel purified using QIAquick Gel Extraction kit (Qiagen) and cloned into pGEM-T easy vector (Promega).
In vitro methylation of plasmid DNA
ITGA1 promoter reporter constructs (15 μg) were treated with 20 units of Sss I methylase (New England Biolabs, Inc., Beverly, MA) for 3 h with 160 μM S-adenosylmethionine (New England Biolabs). Methylation status was verified by digestion with Hpa I or Msp I. Methylated constructs were transfected into Dami cells and assayed for luciferase activity.
Serum-free liquid culture system for in vitro analysis of megakaryocytopoiesis
Culture was carried out as previously described, with modification [17]. Briefly, venous cord blood from the umbilical vessels of healthy, full-term infants was collected immediately after delivery and mixed with one quarter volume of 6% hydroxyethyl starch. Erythrocytes were allowed to settle at room temperature for 30 to 45 min. Mononuclear cells (MNC) in the supernatant were then isolated using a Ficoll-Hypaque density gradient, washed, and resuspended for culture, as previously described [18]. The culture system consisted of 1 × 10⁶ MNC/ml in Iscove’s modified Dulbecco’s Medium (Irvine Scientific, Irvine, CA), supplemented with 1% BSA, 75 μM α-thioglycerol, 40 μg/ml each of linoleic acid, lecithin, and cholesterol, 1% Nutridoma Hu (Roche Boehringer Mannheim, Indianapolis, IN), and 30ng/ml of recombinant human thrombopoietin (rhTPO) (288-TPN-005, R&D Systems, Minneapolis, MN). The total number of suspension cells in culture was determined using a CELL-DYN®1600 multi-parameter hematology analyzer (Abbott Laboratories, Abbott Park, IL). The day 8 cells were used for the CD41+ cell purification.
Flow cytometric analysis of human megakaryocytes
The yield of megakaryocytic cells in culture was quantified by a 2-color flow cytometric technique. The day-8 cultured cells were harvested, washed with cold Ca++- and Mg++-free PBS containing 3% bovine serum albumin (BSA) (fraction V, Sigma Chemical) and 5 mM ethylenediaminetetraacetic acid (EDTA) to block nonspecific binding. After washing, 1 × 10⁶ cells from each aliquot were labeled with 1 μg IgG1 FITC-labeled antihuman CD41 (P2) mAb diluted in 100 μL PBS with BSA and EDTA. Nonspecific antibody binding was monitored with the use of an FITC-labeled murine IgG1 isotype control. After incubation in the dark for 30 minutes at 4°C with gentle mixing, cells were washed with PBS, resuspended in 0.1% sodium citrate containing50 μg/mL propidium iodide (PI) plus 100 μg/mL DNAse-free RNAse (Sigma Chemical), and incubated again on ice in the dark for 20 minutes. Following staining, cells were immediately analyzed by FACSCalibur flow cytometer (Becton Dickinson Immunocytometry Systems). At least 50 000 cells were acquired for each sample and analyzed by CellQuest software. CD41+PI+ cells were considered to be megakaryocytic cells. Selected cell samples were also stained with another murine anti-CD41 mAb (5B12) to verify the results obtained with the use of mAb P2. Megakaryocyte buffer [19] containing sodium citrate, BSA, and PGE1 was also used in selected samples to verify that the CD41 staining results were not buffer dependent.
Isolation of CD41+ cells using Dynabeads Pan Mouse IgG and CD41
CD 41+ cells were isolated using Dynabeads Pan Mouse IgG (Dynal Biotech, Inc., Lake Success, NY) and murine anti-CD41 mAb (clone 5B12, DAKO Corporation, Carpentaria, CA), according to the manufacturer’s instruction (Dynal Biotech, Inc.). Briefly, Dynabeads Pan Mouse IgG and murine anti-CD41 mAb (0.5–l μg anti-CD41 mAb/l07 beads) were incubated at 4°C for 30 min and washed. 4×10⁷ cultured cells were then incubated for 30 minutes at 4°C with the anti-CD41coated beads, and bead-rosetted cells separated magnetically.
Isolation of DNA from mononuclear cells and enriched CD41+ cells
DNA from cord blood MNC or CD41+-enriched cells was purified using the Puregene DNA isolation kit (Gentra Systems, Minneapolis, MN), according to the manufacturer’s instruction.
RESULTS
Characterization of the ITGA1 and PELO 5′ regulatory region
Using 5′RACE, we determined the transcription start site of ITGA1 and PELO in Dami cells. Sequencing of eleven ITGA1 cDNA clones revealed several closely spaced sites, with the major product starting 400bp upstream from the translation initiation site (FIGURE 2). To confirm these results, we performed primer extension analysis with the antisense oligonucleotide GSP8 that starts 195b upstream from the translation initiation site. Primer extension identified a product whose size matched the transcription initiation sites determined by 5′RACE.
FIGURE 2.

ITGA1 5′ regulatory region and proximal promoter sequence (−300/+414). Nucleotide sequence numbering (from NM_181501) is shown to the left of text lines relative to the transcription start site (*). Exon 1 is indicated by uppercase lettering, and the ATG start codon is double underlined. 5′-regulatory, noncoding sequence is indicated by lowercase lettering. The segment employed for bisulfite DNA sequencing experiments is underlined, and each CpG site within that segment is indicated by bold text and numbered consecutively above the text line. A sequence (+25/+52) that is nearly identical (89%) between chicken [2] and human DNA is highlighted in gray, and the position of a CArG box within that sequence is indicated above the text line.
Sequencing of six PELO cDNA clones indicates the presence of a transcription start site 231 bp upstream from the ATG start codon, in close agreement with the findings of Shamsadin et al. [6] (FIGURE 3). Within the proximal 5′ regulatory/promoter region, there are two Sp1 binding elements (CCCCGCCTC at −136/−128; and CCCCGCCCC at +130/+139).
FIGURE 3.

PELO 5′ regulatory region and proximal promoter sequence (−500/+246). Nucleotide sequence numbering (from NM_015946) is shown to the left of text lines relative to the transcription start site (*). Exon 1 is indicated by uppercase lettering, and the ATG start codon is double underlined. 5′-regulatory, noncoding sequence is indicated by lowercase lettering. The segment employed for bisulfite DNA sequencing experiments is underlined, and each of 33 CpG sites within that segment is indicated by bold text. Two Sp1 binding sites are highlighted in gray: Sp1 A at −137/−128 and Sp1 B at +130/+139.
CpG-rich islands were distinguishable in the proximal 5′-regulatory region of each of the three genes relevant to this study: ITGA1, PELO, and ITGA2. In ITGA1 (FIGURE 2), the segment −210/+105 (relative to the transcription start site) contains 19 CpG dinucleotides (bold and numbered). This segment was amplified from genomic DNA with flanking PCR primers (underlined) ranging from −235/+152. The CpG rich region of the PELO gene was more extensive (FIGURE 3), with 33 CpG dinucleotides spanning the segment from −354/+23. This CpG-rich region was amplified within a larger segment ranging from −424/+57.
Deletion analysis of the 5′-flanking sequences of ITGA1
Since the human ITGA1 promoter has not yet been characterized, we completed a basic analysis of the 5′-flanking region that is required for promoter activity. Luciferase reporter constructs were generated in pGL2-basic (pGL2b), and transient transfections were performed in Dami cells. Baseline activity was established by transfection of the pGL2b vector without an insert (FIGURE 4A). The full-length ITGA1 5′-regulatory sequence (−981 to +455) generated a 42-fold increase over baseline activity, while the reverse of this sequence (−981 rev) was inactive, as expected. Truncation of the regulatory region at −397 resulted in approximately a 30% increase in activity, suggesting the presence of a modest suppressor region between −981 and −397. Further truncation at −216 or −53 generated only a modest decrease in activity relative to the full-length construct (9% and 13%, respectively). The greatest difference was observed with truncation at +315 whereupon activity decreased by 84%. These results suggest that basal ITGA1 promoter elements reside within the sequence from −53 to +315.
FIGURE 4.

Deletion analysis of the proximal 5′-regulatory region of A) ITGA1 or B) PELO.
A) A series of reporter plasmids containing fragments of the 5′-region of human ITGA1 extending from −981, −397, −216, −53, or +315 and through +455 were inserted upstream from the LUC reporter gene in pGL2basic (pGL2b) and transfected into Dami cells. Baseline activity was measured with the pGL2basic (pGL2b) vector alone. Co-transfection of the PRL-TK plasmid was used to normalize for transfection efficiency. Each vertical bar represents the mean +/− 1 SD for three independent experiments. For each construct depicted on the abscissa, relative luciferase activity is indicated on the ordinate. −981 rev represents the entire 5′-sequence from −981 to +455 inserted in the reverse orientation.
B) A series of reporter plasmids containing fragments of the 5′-region of human PELO extending from −811, −433, −172, −119, or +138 and through +180 were inserted upstream from the LUC reporter gene in pGL2basic (pGL2b) and transfected into Dami cells. Baseline activity was measured with the pGL2basic (pGL2b) vector alone. Each vertical bar represents the mean +/− 1 SD for four independent experiments. For each construct depicted on the abscissa, relative luciferase activity is indicated on the ordinate. −811 rev represents the entire 5′-sequence (−811/+180) inserted in the reverse orientation.
Analysis of the 5′-flanking sequences of PELO
The transcriptional activity of the 5′ regulatory region of PELO was analyzed next (FIGURE 4B). Maximal activity was obtained with the sequence −172 through +180. The upstream sequence from −172 to −811 had a modest suppressive influence reflected by 25–30% decrease in activity. Further truncation at −119 and +138 resulted in significant decreases in activity of 67% and 88%, respectively. These results indicate that two separate regions, −172 to −120 and −119 to +137, make significant contributions to basal promoter activity. Each of these regions contains an Sp1 recognition sequence (Cf. FIGURE 3).
EMSA
In a comparison of the 5′ regulatory region sequences (−1000/+400) of human ITGA1 (NM_181501) and chicken Itga1 [2], the most conserved sequence (25/28 bp or 89% identity) is that at ITGA1 +25/+52, which encompasses the CArG box element at +35/+43, a cis element that is bound by serum response factor (SRF). The EMSA probe with ITGA1 CArG box that we designed for this study (Table 1) represents that full homologous sequence. It is not certain that SRF or any of its analogs is expressed in cells of the megakaryocyte lineage. Thus, we utilized a nuclear extract from HEK293 cells, known to express SRF, as the source. To represent a bona fide CArG box sequence, we employed an ACTA1 promoter sequence containing a CArG box (CCAAATATGG) (Table 1). In a representative gel mobility shift assay (FIGURE 5A), it is clear that SRF is bound to the CArG box at +24/+43 in human ITGA1 (lane 1) and supershifted by anti-SRF (lane 3), but not anti-Sp1 (lane 2). Complex formation can be blocked by an excess of the unlabelled ACTA1 promoter CArG box sequence as an inhibitor, in a dose dependent manner (lanes 4–6). Lanes 2 and 3 in (A) are inserted slices from separate experiments, each of which included identical positive and negative controls.
FIGURE 5.

Binding of nuclear proteins to oligonucleotides containing (A) the ITGA1 CArG-like site (residues +35/+43) or (B) the PELO Sp1 site A (residues −146/−119) or site B (residues +121/+148). (A) Nuclear extracts were prepared from HEK293 cells and incubated with the radiolabeled ITGA1 CArG box oligonucleotide probe (Table 1) either in the absence of antiserum (lanes 1, 4, 5 and 6) or following incubation with anti-Sp1 (lane 2) or anti-SRF (lane 3). Additional aliquots of the extract were incubated with the radiolabeled ITGA1 CArG box oligonucleotide probe in the presence of 1, 5 or 20 μg/ml of unlabelled ACTA1 CArG oligonucleotide (Table 1), as a competitor oligonucleotide (lanes 4–6, respectively). Arrow to the left of the gel indicates SRF complex; asterisk to the right of the gel denotes the supershifted complex. (B) Nuclear extracts were prepared from Dami cells and incubated with radiolabeled PELO oligonucleotide probes (Table 1) corresponding to Sp1 site A (lanes 1, 3 and 5) or Sp1 site B (lanes 2, 4 and 6) either in the absence of antiserum (lanes 1 and 2) or following incubation with anti-Sp1 (lanes 3 and 4) or anti-SRF (lanes 5 and 6). The positions of Sp1/Sp3 complexes I, II, and III [20] are indicated to the left of the gel. Asterisk to the right of the gel denotes supershifted complexes. Lanes 2 and 3 in (A) and lane 5 in (B) are inserted slices from separate experiments, each of which included identical positive and negative controls,
In the case of PELO (FIGURE 5B), it is clear that Sp1 does bind to both the Sp1 site A and Sp1 site B promoter sequences. In a representative gel mobility shift assay, using a nuclear extract from Dami cells, three major complexes are formed in the presence of either Sp1 A (lane 1) or Sp1 B (lane 2) and are designated I, II and III, from the slowest to fastest mobility. As described in our previous study [20] and based on differential precipitation with polyclonal anti-Sp1 or anti-Sp3, complexes I and III are formed predominantly by the binding of Sp3, with some contribution of Sp1, while complex II is formed predominantly by Sp1. In prior studies of the ITGA2 Sp1/Sp3 binding element at −52 [20], we showed that complex II was predominantly supershifted by anti-Sp1 antibodies. As seen in lanes 3 and 4, complex II is once again predominantly supershifted by the presence of anti-Sp1 antibodies. As a negative control, polyclonal anti-SRF failed to shift the mobility of either the Sp1 A sequence (lane 5) or the Sp1 B sequence (lane 6). Additional results (not shown) confirmed that anti-Sp3 antibodies bind to and shift the mobility of complexes I and III, and to a lesser extent, complex II. Lane 5 in (B) is an inserted slice from separate experiment, performed with identical positive and negative controls.
Cell line-specific expression of ITGA, ITGA2 and PELO
To determine whether the activity of the ITGA1-PELO-ITGA2 locus can be modified in the erythromegakaryocytic (MK) lineage, we compared the levels of corresponding mRNAs, by semi-quantitative RT-PCR, in MK cell lines (HEL, K562, Dami, and CHRF-288-11) versus non-MK cell lines (C8161 and HeLa), before and after induction with phorbol-myristate (PMA). As shown visually in FIGURE 6 and summarized graphically in FIGURE 7, the expression of ITGA1, ITGA2 and PELO mRNAs is different for each cell line studied. Generally, the levels of ITGA1 or ITGA2 mRNA were markedly higher in the non-MK cell lines C8161 and HeLa (FIGURE 6) compared to the MK cell lines. At the opposite end of the spectrum was the MK cell line CHRF-288-11, in which there is no detectable ITGA1 mRNA.
FIGURE 6.
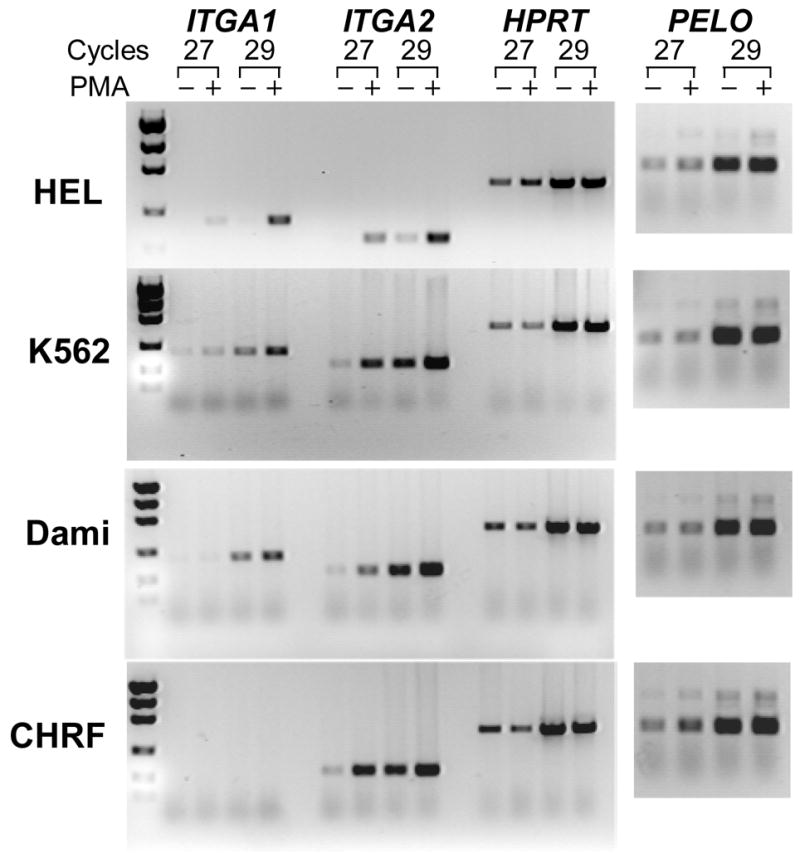
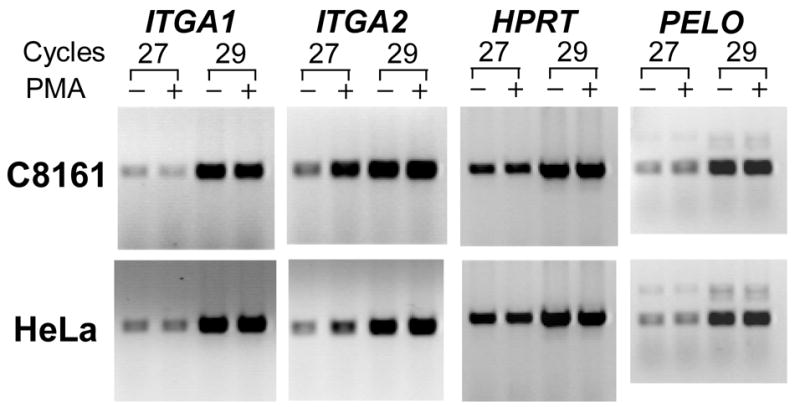
The expression of ITGA1, ITGA2, PELO and the housekeeping gene HPRT in human cell lines. (A) The level of mRNA in each cell line was measured semi-quantitatively using limiting cycle RT-PCR. For each of the four mRNAs, the cDNA product obtained after 27 or 29 cycles was separated by agarose gel electrophoresis and visualized with ethidium bromide. Comparisons were made between cells cultured in the presence (+) of 5 nmol/L phorbol myristate (PMA) or an equal volume of DMSO (−) for 24 hours. Total RNA was reverse transcribed and the cDNA obtained was used for PCR amplification. Both the megakaryocytic (MK) cell lines HEL, K562, Dami, and CHRF-288-11 and the non-MK cell lines C8161 and HeLa were studied.
FIGURE 7.

Quantitation of the fold-increase in mRNA expression induced by PMA. From the results depicted in FIGURE 6 for each of the six cells lines indicated on the abscissa, the density of ethidium-bromide stained DNA bands was measured by optical scanning, and the fold-increase in density in PMA-treated samples relative to non-PMA treated samples was calculated. The results are the mean +/− 1 SD of three independent experiments. The increase in mRNA (band density) following PMA treatment is plotted on the ordinate. A value of 1 represents no increase; while a value of 2 represents a one hundred percent increase or doubling of the density. Levels of ITGA1 mRNA are indicated by black vertical bars; ITGA2 mRNA, by white bars, and PELO mRNA by gray bars.
Additional differences were seen in response to PMA treatment. In C8161 or HeLa, PMA induction had a negligible effect on the levels of ITGA1 mRNA, while ITGA2 mRNA increased 2–fold and 3–fold, respectively. The same treatment increased the levels of both transcripts in the three of the MK cell lines, HEL, K562 and Dami (FIGURE 7). In HEL, the increase in ITGA1 mRNA was nearly 12-fold; for K562 or Dami, 2-fold. The increase in ITGA2 mRNA was also greatest in HEL (9-fold), and substantial but less in K562 (4-fold) or Dami (3-fold). Once again, CHRF-288-11 cells were unique in that PMA treatment had absolutely no effect on ITGA1 mRNA level, while ITGA2 mRNA was increased by 5-fold.
The level of PELO transcripts was more consistent between the various cell lines studied. There seemed to be no real distinction between MK and non-MK cells, in that the levels of PELO mRNA were practically identical in all six cell lines, and PMA treatment had little if any effect in Dami, CHRF-288-11, C8161 or HeLa. Only in HEL and K562 was there a marginal increase in PELO mRNA (roughly 2-fold in each case).
Relative pelota content
The relative amount of pelota protein in representative cell lines was determined by western blot using our murine anti-pelota monoclonal antibody (FIGURE 8). Using equal amounts of total cell protein as the source, a comparable amount of pelota was detected in Dami, CHRF288-11, K562, and HeLa cells (FIGURE 8A ). The relative level of pelota protein, by visual inspection (highest to lowest), was K562 > HeLa >Dami > CHRF288-11. In additional assays, pelota protein was partitioned nearly equally between cytoplasmic and nuclear extracts from K562, Dami or CHRF288-11 cells (FIGURE 8B).
FIGURE 8.
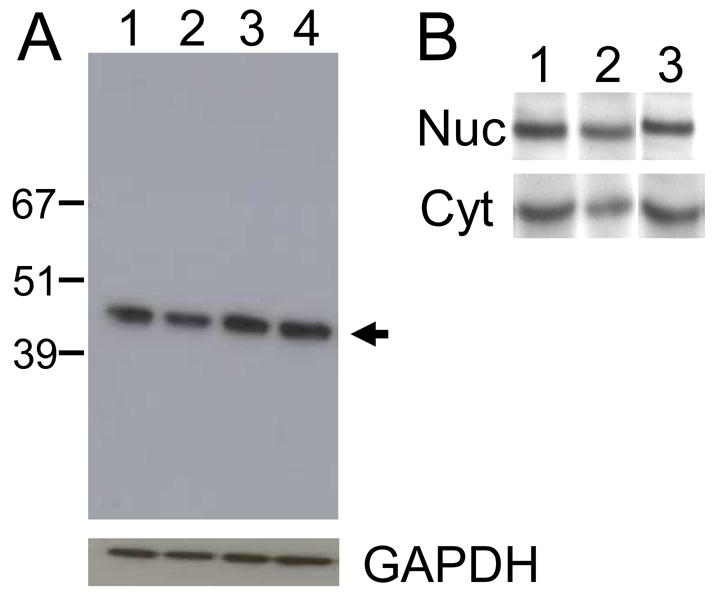
Cellular content of pelota. (A) The relative total cell content of pelota was determined by western blot. Equal amounts of total cell protein (15 μg) from (lane 1) Dami cells, (lane 2) CHRF288-11 cells, (lane 3) K562 cells, or (lane 4) HeLa cells were separated by SDS-polyacrylamide gel electrophoresis and transferred to a nitrocellulose membrane. The position of representative molecular weight marker proteins is indicated to the left of the gel. Pelota was visualized by the binding of murine monoclonal anti-pelota antibody 1A3, and its position is indicated by the arrow to the right of the gel. (B) Legend as in A except that nuclear protein (Nuc) and cytoplasmic protein (Cyt) were separated prior to SDS-PAGE. The cell lines employed were: (lane 1) Dami, (lane 2) CHRF288-11, and (lane 3) K562.
Repression of ITGA1 promoter activity by in vitro methylation
To determine whether methylation of the 5′ regulatory region of ITGA1 is sufficient to silence its expression, the ITGA1 promoter inserts within reporter constructs were methylated in vitro using Sss I, an enzyme that methylates every CpG dinucleotide. As shown in FIGURE 9, the luciferase activity in Dami cells transfected with an unmethylated construct was 32.3- fold higher than that in cells transfected with the in vitro methylated counterpart. This result confirms that methylation of CpG dinucleotides in the proximal 5′-regulatory region of the ITGA1 gene can repress transcriptional activity even in cells that express endogenous ITGA1.
FIGURE 9.

Inhibition of ITGA1 promoter activity by in vitro methylation. The ITGA1 promoter construct (−397/+455) and pGL2b vector alone (control) were methylated in vitro with SssI methylase and transfected into Dami cells. Co-transfection of PRL-TK plasmid was used to normalize for transfection efficiency. The relative Luciferase activity for each transiently transfected cell preparation was measured and is plotted on the ordinate The activity of each of four constructs (abscissa) is compared: pGL2b; methylated pGL2b (Met-pGL2b); ITGA1 promoter (−397); and methylated ITGA1 promoter (Met-397).
Induction of ITGA1 expression by 5-Aza-dC in CHRF-288-11 cells
If the methylation of the ITGA1 promoter is the cause of inactivation, treatment with a demethylating reagent should reverse this inhibition. When CHRF-288-11 cells were treated with 10 μM 5-aza-dC for 24 or 48 hours, the de novo expression of ITGA1 mRNA by RT-PCR became evident (FIGURE 10A). This result was confirmed by flow cytometry (FIGURE 10B), using FITC-labeled murine monoclonal anti-human CD49b (integrin α1) (BD Pharmingen, Franklin Lakes, NJ). To the contrary, treatment of CHRF-288-11 cells with 50 nM TSA for 48 hours had no effect on the repression of ITGA1 mRNA (FIGURE 10C). These results would argue that the more accessible chromatin architecture favorable to transcription that would result from treatment with TSA does not overcome the inhibition of ITGA1 transcription and that methylation of DNA per se is the cause of the repression of this gene.
FIGURE 10.

Expression of ITGA1 mRNA in CHRF288-11 cells after the treatment with 5-aza-deoxyCytidine (5-AZA) or Trichostatin A (TSA). (A) The cDNA product amplified by RT-PCR after 30, 32 or 36 cycles is depicted for cells were (a) untreated or treated with (b) 0.01 % (v/v) DMSO for 24 hrs; (c) 5μM 5-AZA for 24 hrs; (d) DMSO for 48 hrs; (e) 5-AZA for 48 hrs; (e) TSA for 48 hrs; or (f) 5-AZA plus TSA for 48 hrs. The arrow in the right hand margin denotes the position of the expected ITGA1 cDNA product. (B) The surface expression of integrin α1 at 48 hours after treatment with 5-AZA (gray curve) is shifted to the right relative to that obtained for cells treated with DMSO (black curve), as measured by flow cytometry using monoclonal anti-α 1 antibody.
Methylation status of the CpG dinucleotides in the promoter region of ITGA1, PELO, ITGA2, and GP6 in established cell lines
Since the 5′ regulatory region of ITGA1 contains 19 CpG sites (FIGURE 2), we next used bisulfite sequencing to analyze the methylation status of these CpG sites in region −235/+105 (the underlined sequence in FIGURE 1). Primers were designed that are complementary to sequences flanking this region and lacking CpG dinucleotides, in order to permit amplification of all genomic sequences, regardless of the status of methylation. Genomic DNA from Dami cells is completely unmethylated at all 19 CpG sites, while genomic DNA from CHRF-288-11 cells is fully methylated at all 19 CpG sites. The specificity of the CpG methylation status of ITGA1 is further highlighted by an absolute lack of CpG methylation of either PELO (−354/+23; underlined in FIGURE 2) or ITGA2 (−228/+9; not shown) in all cell lines studied, including CHRF-288-11 cells.
These results establish that the expression of ITGA1 correlates with the CpG methylation status of the proximal 5′-regulatory region of the gene. Established cell lines, however, are not always an accurate model for cell differentiation, and aberrant methylation of CpG islands in genomic DNA from established cell lines has been encountered. To obtain a more accurate evaluation of a role for CpG methylation in expression of these genes during megakaryocyte differentiation, we turned to the study of primary human megakaryocytes.
CpG methylation in primary human megakaryocytes
To investigate the methylation status of the ITGA1 promoter in primary cells, we isolated mononuclear cells (MNCs) from human cord blood, selected the CD41+ cells, and cultured these in the presence of recombinant human TPO (rhTPO) for 8days. The methylation status of ITGA1, PELO and ITGA2 CpG-rich promoter regions was then compared between the rhTPO-stimulated CD41+ cells and the MNC from which they were derived.
In the case of established cell lines, the bisulfite sequencing approach is simplified by the fact that the genomic DNA is homogeneous, therefore direct sequencing of PCR amplified DNA is possible. With primary human megakaryocyte differentiation in vitro, this is not the case. In the initial MNC population, megakaryocytes and progenitors may represent no more than 5 % of the total cell population. Even after induction for 8 days with rhTPO, the CD41-enriched population contains a significant proportion of CD41-negative or CD41-low cells that can constitute up to 30–50% of the population. Consequently, we first subcloned the PCR amplified DNA prior to sequencing. Upon sequence analysis, the percentage of clones with methylated CpG sites is statistically a reflection of the percentage of cells with methylated sites. This permits us to estimate the frequency of methylation at each CpG site in the initial genomic DNA prior to cloning.
The results a representative comparison are summarized in tabular form in FIGURE 11. With respect to the ITGA1 status in genomic DNA from cord blood mononuclear cells (MNC) (FIGURE 11A), only 3 of 26 clones (11.5%) showed significant methylation at any of the 19 CpG sites. Assuming that this is a reasonable reflection of the proportion of cells with methylated DNA, these results would argue that no more than 11.5% of cells within the MNC population are committed to the MK lineage and that the ITGA1 promoter in these cells has been CpG methylated. The results of flow cytometry assays determined the number of CD41+ cells in the MNC samples to be 2 +/− 0.7 % (n = 4). The contrasting results in the CD41-enriched cell population were remarkable. After induction with rhTPO, (FIGURE 11B), a majority of DNA clones (13 of 22, or 59.1%) were now methylated at at least 16 of 19 CpG sites. This proportion reflects very well the proportion of CD41+ cells in these enriched populations, based on flow cytometry (63 +/− 3.8%; n = 4). In the case of either PELO (21 clones) or ITGA2 (24 clones), ≥3% of the promoter region CpG sites in any single clone were methylated, and these were randomly distributed in either the MNC population or the CD41-enriched population (not shown).
FIGURE 11.


Methylation status of the ITGA1 promoter CpG-rich region of (A) cord blood mononuclear cells (MNC) or (B) CD41+ cells, enriched by culture in the presence of recombinant human thrombopoietin (rhTPO). In each grid, each CpG site is represented by a column that is numbered at the top, while individual cloned DNA sequences are represented by a row that is numbered to the left. Methylated CpG sites are indicated as filled squares, and unmethylated sites as open squares. Numbers at the top correspond to the same CpG sites shown in Figures 2 or 11. Mononuclear cells (MNCs) from human cord blood were isolated and cultured in the presence of rhTPO for 8days. CD41+ cells were selected, and genomic DNA was isolated, bisulfite treated, and amplified by PCR, targeting the ITGA1 CpG-rich region. In MNC (A), 2 of 26 clones (#5 and #20) showed complete methylation of each of 19 sites, while a third clone (#11) showed methylation at sites 1 through 14 (3/26 = 11%); in the CD41+ enriched cells derived from these progenitors (B), 13 of 22 clones (59%) showed methylation of at least 16 of the 19 sites.
These results confirm that megakaryocyte differentiation coincides with an increased and selective CpG methylation of the ITGA1 promoter.
DISCUSSION
Compared to other members of the integrin family, there is a good deal of information regarding the structure of the integrin ITGA2 5′-regulatory region and the nature of the elements most responsible for transcriptional control of this gene [13,20–24]. Transcription is largely driven by Sp1 which binds to two tandem recognition sequences in the proximal promoter. On the other hand, surprisingly little has been published regarding the transcriptional control of ITGA1 in mammalian cells. However, the promoter of chicken ITGA1 has been characterized [2,3], and serum response factor (SRF) binding to a CArG box was shown to be essential for transcriptional activation in differentiated smooth muscle cells.
Our study represents the first characterization of the human ITGA1 promoter. We find that transcription starts 400bp upstream from the translation initiation site, which is located 33bp upstream from a CArG box (CCCTTTAAGG) that is identical in sequence to that found in chicken Itga1. Promoter analysis reveals that the bulk of the promoter activity is present in the sequence between −53 and +315, which includes this highly conserved sequence at +25/+52 (89% identity between humans and chickens) that encompasses this CArG box. A functional CArG box is defined as one in which the 10-bp consensus can deviate by no more than 1 bp across the CArG element (e.g., CCSWWWWWGG) yielding 1216 potential sequences that can be bound by SRF [25]. Since it is not yet established whether cells of the megakaryocyte lineage (such as Dami cells) express SRF, we employed a nuclear extract from HEK293, known to express SRF [26], as its source. By EMSA and supershift assays, we confirmed that SRF does bind to the CArG box sequence in ITGA1. Moreover, the binding of SRF to the ITGA1 CArG box sequence is inhibited by the unrelated and evolutionarily conserved CArG box sequence from the human skeletal muscle α-actin gene ACTA1. These results suggest that mechanisms governing the expression of ITGA1 are comparable in chicken and human cells. The same may be true of other integrin genes that bear a functional CArG box. Indeed, the murine integrin α5 gene Itga5 also bears a functional CArG box in its 5′ regulatory region, as validated by EMSA [25].
The gene PELO, originally discovered in Drosophila melanogaster [4], is embedded entirely within the very large intron 1 (69 Kb) of ITGA1, by inspection of the compiled human chromosome 5 genomic sequence NT_023081. Our findings in this study represent the initial characterization of the PELO 5′ regulatory region and promoter in any species. The notable presence of two Sp1 binding sites and our validation that these sites able to bind to Sp1 are findings that are consistent with the role of Sp1 in the regulation of genes relevant to cell cycle controls.
Embedded genes, such as PELO, are not frequently encountered in the human genome. Other examples are the factor VIII-associated gene located within intron 22 of human coagulation factor VIII [27], the G-protein-coupled receptor gene U16 situated within intron 17 of the human retinoblastoma susceptibility gene [28], and the three genes EV12A, EV12B, and Omgp located within intron 27b of the gene NF1 [29–31]. The biological relationship between such embedded genes and the “host” genes remains an area of active investigation, but little is known about differential expression of the embedded and host genes. Since there is a nuclear localization signal in human and mouse pelota, it has been suggested that pelota could act as transcription factor or a carrier to transport other transcription factors into the nucleus. The influence of the embedded gene PELO on the expression of ITGA1, and vice versa, warrants closer scrutiny.
Methylation at CpG dinucleotides in genomic DNA is one of the predominant epigenetic mechanisms of transcriptional regulation in vertebrates [32]. We have analyzed the methylation status of CpG islands in the proximal 5′-regulatory region of ITGA1 and find that genomic DNA from expressive cells, such as Dami, is devoid of methylated CpG sites, whereas genomic DNA from non-expressive cells, such as CHRF-288-11, is methylated at all CpG sites. The relationship between CpG methylation and silencing of ITGA1 in CHRF-288-11 cells was very intriguing because the CpG-rich segments within the 5-regulatory regions of the proximal genes PELO and ITGA2 are completely unmethylated. This indicates that ITGA1 methylation is not a simple consequence of global hypermethylation but a specific event that may be restricted to cells of the megakaryocytic lineage.
Since CHRF-288-11 cells are considered to bear a phenotype that is more like mature megakaryocytes than any other erythro-megakaryocytic cell line [33], we hypothesized that ITGA1 is specifically methylated as a requisite step in the differentiation of progenitors into megakaryocytes. However, it is also evident that in some cases CpG methylation can be a feature of established cell lines without functional counterpart in primary cell of the same lineage. For example, although CpG methylation of the proximal human Toll-like receptor (TLR)2 promoter in cell lines such as U937 correlated with TLR2 repression, the promoter was completely unmethylated in primary cells, regardless of the transcriptional activity of the gene[34].
A better test of our hypothesis would derive from an analysis of CpG methylation status in primary human megakaryocytes in culture. To address this question, we employed our previously reported in vitro culture method, in which the differentiation of human cord blood MNC into megakaryocytes is driven by recombinant thrombopoietin. Comparing the precursor MNC population to the CD41-enriched (megakaryocyte-enriched) population obtained after 8 days in culture, we monitored the methylation status of the CpG islands within the 5′-regulatory regions of ITGA1, PELO and ITGA2. The results confirmed our hypothesis and showed convincingly that ITGA1 becomes hypermethylated and repressed during the differentiation of primary human megakaryocytes. In a previous study, we have reported that the converse is true of the megakaryocyte-specific gene GP6, which becomes progressively hypomethylated and expressed under identical differentiation conditions [35].
In some cases, CpG methylation per se is not the direct cause of transcriptional repression. For example, when methylated in vitro, the osteocalcin (OC) promoter DNA is still recognized by the key regulators Runx/Cbfa and the vitamin D receptor complex [36]. In that case, CpG methylation does not affect either basal or vitamin D-enhanced OC promoter activity in transfected cells. However, we confirmed that direct CpG methylation of ITGA1 promoter constructs resulted in repression of transcriptional activity when transfected into expressive cells, such as Dami. Moreover, the treatment of non-expressive cells, such as CHRF-288-11, with the demethylating agent 5-aza-dC resulted in de novo expression of ITGA1 by these cells, a finding that supports a causal role for CpG methylation in the suppression of ITGA1.
One of the common mechanism by which CpG methylation can causes suppression involves proteins that bind to methylated CpG sites, such as the MBD protein family, including MBD1, MBD2, MBD3, and MeCP2. These proteins recruit and associate with histone deacetylases (HDAC) to promote hypo-acetylation of histones in the immediate vicinity, resulting in increased packing of chromatin and transcriptional repression. Inhibition of HDAC with Trichostatin A (TSA) can be used to evaluate the contribution of such MeCP2-like proteins to transcriptional regulation initiated by CpG methylation. For example, Schwab and Illges [37] found that TSA treatment induces de novo expression of CD21 in early B lymphocytes, although the CD21 CpG island remains fully methylated and transcription would otherwise be repressed. In our studies, TSA treatment failed to reverse the suppression of ITGA1 transcription in CHRF-288-11 cells, a finding that argues for a direct CpG methylation-mediated suppression of transcription by alternate mechanisms. There is precedent for such direct effects of CpG methylation on promoter activity without then influence of histone acetylation and binding. For example, CpG methylation inhibits proenkephalin gene expression by directly interfering with the binding of the positively acting transcription factor, AP-2, essential for maximal basal activity [38]. Moreover, methylation of E2F elements derived from the dihydrofolate reductase, E2F1, and cdc2 promoters prevents the binding of all E2F family members, including E2F1 through E2F5 [39]
A role for CpG methylation in the differentiation of other cell lineages has been documented. During differentiation of primary diploid rat osteoblasts in culture, expression of the osteocalcin (OC) gene increases proportionally to the decrease in CpG methylation of the OC promoter [36]. As already mentioned, in immature B lymphocytes (pro-, pre- and intermediate B lymphocytes), CD21 is not expressed, and a CpG island within the CD21 promoter is fully methylated. In CD21-expressing mature B lymphocytes, plasma B lymphocytes and non-lymphoid cells, the CD21 CpG island is demethylated [37]. With the differentiation of CD4+ T lymphocytes into the Th1 and Th2 lineages, DNase I hypersensitive sites (DHS) appear at IL-4 and IL-13, and CpG demethylation ensues exclusively at the Th2-specific DHS [40]. Lastly, certain genes with restricted expression to hematopoietic cells, such as the genes for myeloperoxidase [41], globin [42], c-fms [43], and the G-CSF receptor [44]are regulated by methylation in a lineage- and differentiation –dependent manner.
The ITGA1-PELO-ITGA2 locus on chromosome 5 is unique in that it represents the closest proximity of two integrin genes in the human genome and a rare example of an embedded gene, PELO, which happens to play a pivotal role in cell cycle regulation. Despite their proximity, these genes are regulated by diverse mechanisms. ITGA1 is transcriptionally activated by SRF or SRF-like proteins, while PELO and ITGA2 are positively regulated predominantly by Sp1. During differentiation into the megakaryocyte lineage, the expression of ITGA1 is completely suppressed by a mechanism that results in the full methylation of CpG sites within the proximal promoter region. At the same time, PELO and ITGA2 proximal promoters remain completely unmethylated, and the genes continue to be expressed. Future studies will be directed at the characterization of the precise mechanisms involved in this lineage-restricted and highly selective gene silencing.
Acknowledgments
We thank Dr. Jerry Ware (The Scripps Research Institute, La Jolla, CA) for his advice and support during these studies and Diana Rozenshteyn for her technical assistance. This study was supported by NHLBI Grant HL075821 awarded to T. J. Kunicki. This is manuscript MEM-18831 from The Scripps Research Institute.
Footnotes
Publisher's Disclaimer: This is a PDF file of an unedited manuscript that has been accepted for publication. As a service to our customers we are providing this early version of the manuscript. The manuscript will undergo copyediting, typesetting, and review of the resulting proof before it is published in its final citable form. Please note that during the production process errors may be discovered which could affect the content, and all legal disclaimers that apply to the journal pertain.
References
- 1.Hughes AL. Evolution of the Integrin alpha and beta Protein Families. J Mol Evol. 2001;52:63. doi: 10.1007/s002390010134. [DOI] [PubMed] [Google Scholar]
- 2.Obata H, Hayashi K, Nishida W, Momiyama T, Uchida A, Ochi T, Sobue K. Smooth muscle cell phenotype-dependent transcriptional regulation of the alpha1 integrin gene. J Biol Chem. 1997;272:26643. doi: 10.1074/jbc.272.42.26643. [DOI] [PubMed] [Google Scholar]
- 3.Nishida W, Nakamura M, Mori S, Takahashi M, Ohkawa Y, Tadokoro S, Yoshida K, Hiwada K, Hayashi K, Sobue K. A triad of serum response factor and the GATA and NK families governs the transcription of smooth and cardiac muscle genes. J Biol Chem. 2002;277:7308. doi: 10.1074/jbc.M111824200. [DOI] [PubMed] [Google Scholar]
- 4.Eberhart CG, Wasserman SA. The pelota locus encodes a protein required for meiotic cell division: an analysis of G2/M arrest in Drosophila spermatogenesis. Development. 1995;121:3477. doi: 10.1242/dev.121.10.3477. [DOI] [PubMed] [Google Scholar]
- 5.Shamsadin R, Adham IM, Engel W. Mouse pelota gene (Pelo): cDNA cloning, genomic structure, and chromosomal localization. Cytogenet Genome Res. 2002;97:95. doi: 10.1159/000064059. [DOI] [PubMed] [Google Scholar]
- 6.Shamsadin R, Adham IM, von Beust G, Engel W. Molecular cloning, expression and chromosome location of the human pelota gene PELO. Cytogenet Cell Genet. 2000;90:75. doi: 10.1159/000015667. [DOI] [PubMed] [Google Scholar]
- 7.Ragan MA, Logsdon JM, Jr, Sensen CW, Charlebois RL, Doolittle WF. An archaebacterial homolog of pelota, a meiotic cell division protein in eukaryotes. FEMS Microbiol Lett. 1996;144:151. doi: 10.1111/j.1574-6968.1996.tb08522.x. [DOI] [PubMed] [Google Scholar]
- 8.Davis L, Engebrecht J. Yeast dom34 mutants are defective in multiple developmental pathways and exhibit decreased levels of polyribosomes. Genetics. 1998;149:45. doi: 10.1093/genetics/149.1.45. [DOI] [PMC free article] [PubMed] [Google Scholar]
- 9.Caryl AP, Lacroix I, Jones GH, Franklin FCH. An arabidopsis homologue of the Drosophila meiotic gene Pelota. Sex Plant Reprod. 2000;12:310. [Google Scholar]
- 10.Lu Q, Ray D, Gutsch D, Richardson B. Effect of DNA methylation and chromatin structure on ITGAL expression. Blood. 2002;99:4503. doi: 10.1182/blood.v99.12.4503. [DOI] [PubMed] [Google Scholar]
- 11.Futscher BW, Oshiro MM, Wozniak RJ, Holtan N, Hanigan CL, Duan H, Domann FE. Role for DNA methylation in the control of cell type specific maspin expression. Nat Genet. 2002;31:175. doi: 10.1038/ng886. [DOI] [PubMed] [Google Scholar]
- 12.Uhl J, Klan N, Rose M, Entian KD, Werz O, Steinhilber D. The 5-lipoxygenase promoter is regulated by DNA methylation. J Biol Chem. 2002;277:4374. doi: 10.1074/jbc.M107665200. [DOI] [PubMed] [Google Scholar]
- 13.Jacquelin B, Rozenshteyn D, Kanaji S, Koziol JA, Nurden AT, Kunicki TJ. Characterization of Inherited Differences in Transcription of the Human Integrin alpha 2 Gene. J Biol Chem. 2001;276:23518. doi: 10.1074/jbc.M102019200. [DOI] [PubMed] [Google Scholar]
- 14.Fugman DA, Witte DP, Jones CLA, Aronow BJ, Lieberman MA. In vitro establishment and characterization of a human megakaryoblastic cell line. Blood. 1990;75:1252. [PubMed] [Google Scholar]
- 15.Bradford MM. A rapid and sensitive method for the quantitation of microgram quantities of protein utilizing the principle of protein-dye binding. Anal Biochem. 1976;72:248. doi: 10.1016/0003-2697(76)90527-3. [DOI] [PubMed] [Google Scholar]
- 16.Sambrook J, Fritsch EF, Maniatis T. Extraction, Purification and Analysis of Messenger RNA From Eukaryotic Cells. In: Nolan C, editor. Molecular Cloning - Book 1. Cold Spring Harbor Laboratory Press; New York: 1987. pp. 7.1–7.87. [Google Scholar]
- 17.Chang M, Nakagawa PA, Williams SA, Schwartz MR, Imfeld KL, Buzby JS, Nugent DJ. Immune thrombocytopenic purpura (ITP) plasma and purified ITP monoclonal autoantibodies inhibit megakaryocytopoiesis in vitro. Blood. 2003;102:887. doi: 10.1182/blood-2002-05-1475. [DOI] [PubMed] [Google Scholar]
- 18.Chang M, Suen Y, Lee SM, Baly D, Buzby JS, Knoppel E, Wolpe S, Cairo MS. Transforming growth factor-beta 1, macrophage inflammatory protein-1 alpha, and interleukin-8 gene expression is lower in stimulated human neonatal compared with adult mononuclear cells. Blood. 1994;84:118. [PubMed] [Google Scholar]
- 19.Tomer A, Friese P, Conklin R, Bales W, Archer L, Harker LA, Burstein SA. Flow cytometric analysis of megakaryocytes from patients with abnormal platelet counts. Blood. 1989;74:594. [PubMed] [Google Scholar]
- 20.Jacquelin B, Tarantino MD, Kritzik M, Rozenshteyn D, Koziol JA, Nurden AT, Kunicki TJ. Allele-dependent transcriptional regulation of the human integrin alpha 2 gene. Blood. 2001;97:1721. doi: 10.1182/blood.v97.6.1721. [DOI] [PubMed] [Google Scholar]
- 21.Zutter MM, Santoro SA, Painter AS, Tsung YL, Gafford A. The human α 2 integrin gene promoter. Identification of positive and negative regulatory elements important for cell-type and developmentally restricted gene expression. J Biol Chem. 1994;269:463. [PubMed] [Google Scholar]
- 22.Zutter MM, Painter AA, Staatz WD, Tsung YL. Regulation of integrin α 2 gene expression in cells with megakaryocytic features: A common theme of three necessary elements. Blood. 1995;86:3006. [PubMed] [Google Scholar]
- 23.Zutter MM, Ryan EE, Painter AD. Binding of phosphorylated Sp1 protein to tandem Sp1 binding sites regulates alpha2 integrin gene core promoter activity. Blood. 1997;90:678. [PubMed] [Google Scholar]
- 24.Zutter MM, Painter AD, Yang X. The megakaryocyte/platelet-specific enhancer of the alpha 2 beta 1 integrin gene: Two tandem AP1 sites and the mitogen-activated protein kinase signaling cascade. Blood. 1999;93:1600. [PubMed] [Google Scholar]
- 25.Sun Q, Chen G, Streb JW, Long X, Yang Y, Stoeckert CJ, Jr, Miano JM. Defining the mammalian CArGome. Genome Res. 2006;16:197. doi: 10.1101/gr.4108706. [DOI] [PMC free article] [PubMed] [Google Scholar]
- 26.Gonzalez Bosc LV, Layne JJ, Nelson MT, Hill-Eubanks DC. Nuclear factor of activated T cells and serum response factor cooperatively regulate the activity of an alpha-actin intronic enhancer. J Biol Chem. 2005;280:26113. doi: 10.1074/jbc.M411972200. [DOI] [PubMed] [Google Scholar]
- 27.Levinson B, Kenwrick S, Lakich D, Hammonds G, Jr, Gitschier J. A transcribed gene in an intron of the human factor VIII gene. Genomics. 1990;7:1. doi: 10.1016/0888-7543(90)90512-s. [DOI] [PubMed] [Google Scholar]
- 28.Herzog H, Darby K, Hort YJ, Shine J. Intron 17 of the human retinoblastoma susceptibility gene encodes an actively transcribed G protein-coupled receptor gene. Genome Res. 1996;6:858. doi: 10.1101/gr.6.9.858. [DOI] [PubMed] [Google Scholar]
- 29.Cawthon RM, O’Connell P, Buchberg AM, Viskochil D, Weiss RB, Culver M, Stevens J, Jenkins NA, Copeland NG, White R. Identification and characterization of transcripts from the neurofibromatosis 1 region: the sequence and genomic structure of EVI2 and mapping of other transcripts. Genomics. 1990;7:555. doi: 10.1016/0888-7543(90)90199-5. [DOI] [PubMed] [Google Scholar]
- 30.Cawthon RM, Andersen LB, Buchberg AM, Xu GF, O’Connell P, Viskochil D, Weiss RB, Wallace MR, Marchuk DA, Culver M. cDNA sequence and genomic structure of EV12B, a gene lying within an intron of the neurofibromatosis type 1 gene. Genomics. 1991;9:446. doi: 10.1016/0888-7543(91)90410-g. [DOI] [PubMed] [Google Scholar]
- 31.Viskochil D, Cawthon R, O’Connell P, Xu GF, Stevens J, Culver M, Carey J, White R. The gene encoding the oligodendrocyte-myelin glycoprotein is embedded within the neurofibromatosis type 1 gene. Mol Cell Biol. 1991;11:906. doi: 10.1128/mcb.11.2.906. [DOI] [PMC free article] [PubMed] [Google Scholar]
- 32.El Osta A, Wolffe AP. DNA methylation and histone deacetylation in the control of gene expression: basic biochemistry to human development and disease. Gene Expr. 2000;9:63. doi: 10.3727/000000001783992731. [DOI] [PMC free article] [PubMed] [Google Scholar]
- 33.den Dekker E, Gorter G, Heemskerk JW, Akkerman JW. Development of platelet inhibition by cAMP during megakaryocytopoiesis. J Biol Chem. 2002;277:29321. doi: 10.1074/jbc.M111390200. [DOI] [PubMed] [Google Scholar]
- 34.Haehnel V, Schwarzfischer L, Fenton MJ, Rehli M. Transcriptional regulation of the human toll-like receptor 2 gene in monocytes and macrophages. J Immunol. 2002;168:5629. doi: 10.4049/jimmunol.168.11.5629. [DOI] [PubMed] [Google Scholar]
- 35.Kanaji S, Kanaji T, Jacquelin B, Chang M, Nugent DJ, Komatsu N, Moroi M, Izuhara K, Kunicki TJ. Thrombopoietin initiates demethylation-based transcription of GP6 during megakaryocyte differentiation. Blood. 2005;105:3888. doi: 10.1182/blood-2004-08-3109. [DOI] [PMC free article] [PubMed] [Google Scholar]
- 36.Villagra A, Gutierrez J, Paredes R, Sierra J, Puchi M, Imschenetzky M, Wijnen AA, Lian J, Stein G, Stein J, Montecino M. Reduced CpG methylation is associated with transcriptional activation of the bone-specific rat osteocalcin gene in osteoblasts. J Cell Biochem. 2002;85:112. [PubMed] [Google Scholar]
- 37.Schwab J, Illges H. Regulation of CD21 expression by DNA methylation and histone deacetylation. Int Immunol. 2001;13:705. doi: 10.1093/intimm/13.5.705. [DOI] [PubMed] [Google Scholar]
- 38.Comb M, Goodman HM. CpG methylation inhibits proenkephalin gene expression and binding of the transcription factor AP-2. Nucleic Acids Res. 1990;18:3975. doi: 10.1093/nar/18.13.3975. [DOI] [PMC free article] [PubMed] [Google Scholar]
- 39.Campanero MR, Armstrong MI, Flemington EK. CpG methylation as a mechanism for the regulation of E2F activity. Proc Natl Acad Sci U S A. 2000;97:6481. doi: 10.1073/pnas.100340697. [DOI] [PMC free article] [PubMed] [Google Scholar]
- 40.Santangelo S, Cousins DJ, Winkelmann NE, Staynov DZ. DNA methylation changes at human Th2 cytokine genes coincide with DNase I hypersensitive site formation during CD4(+) T cell differentiation. J Immunol. 2002;169:1893. doi: 10.4049/jimmunol.169.4.1893. [DOI] [PubMed] [Google Scholar]
- 41.Lubbert M, Miller CW, Koeffler HP. Changes of DNA methylation and chromatin structure in the human myeloperoxidase gene during myeloid differentiation. Blood. 1991;78:345. [PubMed] [Google Scholar]
- 42.Enver T, Zhang JW, Anagnou NP, Stamatoyannopoulos G, Papayannopoulou T. Developmental programs of human erythroleukemia cells: globin gene expression and methylation. Mol Cell Biol. 1988;8:4917. doi: 10.1128/mcb.8.11.4917. [DOI] [PMC free article] [PubMed] [Google Scholar]
- 43.Felgner J, Kreipe H, Heidorn K, Jaquet K, Heuss R, Zschunke F, Radzun HJ, Parwaresch MR. Lineage-specific methylation of the c-fms gene in blood cells and macrophages. Leukemia. 1992;6:420. [PubMed] [Google Scholar]
- 44.Felgner J, Heidorn K, Korbacher D, Frahm SO, Parwaresch R. Cell lineage specificity in G-CSF receptor gene methylation. Leukemia. 1999;13:530. doi: 10.1038/sj.leu.2401386. [DOI] [PubMed] [Google Scholar]