

1. Introduction
Diffusion-controlled polymeric drug delivery systems are used extensively in many pharmaceutical applications [1,2]. In monolithic devices with uniform initial drug disbursement, first-order diffusion kinetics are often observed, where the drug release rate is initially high and then tapers off rapidly. In many applications, release rates approaching zero-order behavior, or a near constant rate of release, would be beneficial. To eliminate the burst effect and tailor release profiles in polymeric devices, researchers have investigated a variety of approaches, including alternative geometries [3,4], rate controlling membranes [5–8], and surface degrading polymers [9–12].
One alternative method is the construction of multilaminate polymeric devices with spatially varying properties. Several researchers have demonstrated control of release rate profiles both theoretically and experimentally by constructing matrices with initially nonuniform concentration profiles [13–18]. Specifically, Lu and Anseth demonstrated the potential of photopolymerizations to construct poly(2-hydroxyethyl methacrylate) (PHEMA) multilaminates with nonuniform initial solute distributions [15]. Photopolymerizations are advantageous in that they proceed very rapidly at room temperature and can be performed in an aqueous environment or in the absence of solvent. These mild reaction conditions enable the safe encapsulation of biological agents, such as living cells [19–23], DNA [24,25], and therapeutic agents [26] with complete spatial and temporal control of the reaction. An additional level of control over release rates can be gained by varying diffusional properties between layers of a multilaminate device. Furthermore, by varying spatial properties within a device, simultaneous release of multiple therapeutics at different rates can be attained.
In crosslinked polymers, such as hydrogels, diffusional properties can be controlled by varying the crosslink density of the network. For example, 2-hydroxyethyl methacrylate (HEMA) requires a crosslinking molecule with functionality greater than 2, such as diethylene glycol dimethacrylate (DEGDMA), to form networks. Here, we are following the convention that vinyl groups in a chain polymerization have a functionality of two, so DEGDMA has a functionality of four. By varying the ratio of HEMA to DEGDMA, one can systematically control the network properties, and thus control the rate of transport of a given solute [15]. For greater variations in diffusional properties, different materials could be utilized with even greater differences in structure.
Multilaminates with combinations of spatially varying diffusion and loading have been explored theoretically using rigorous optimization techniques to design devices with desirable release profiles [18,27]. However, little has been reported with respect to the experimental investigation of such devices, and these studies have been limited to following cumulative release profiles. The objective of this study was to construct PHEMA/poly(ethylene glycol) (PEG) hydrogel multilaminates via photopolymerization and to characterize these devices experimentally and theoretically. These matrix materials were selected, in part, due to their long histories of use in biomedical applications, including drug delivery. Using low molecular weight fluorescent dyes as model drug molecules, devices with spatially varying loading and diffusional properties were constructed with the goal of tuning the overall release rate. Traditionally, release and uptake experiments are characterized by simply quantifying solute concentrations in the release/uptake media. To gain greater insight into the evolving concentration profiles within these devices, confocal laser scanning microscopy (CLSM) was utilized to image model drug distributions within the polymeric matrices during release experiments. Previously, CLSM was demonstrated as an effective tool for non-destructively characterizing molecular transport in monolithic hydrogel networks in pseudo-real-time [28]. Specifically, PHEMA multilaminates with spatially varying initial loading profiles, PHEMA-PEG multilaminates with spatially varying diffusional properties, and multicomponent release from multilaminates were investigated with respect to their ability to release low molecular weight (approximately 400–600 Da) drug molecules. In this work, theoretical modeling was performed and compared to experimental work to analyze any divergences from expected behavior as predicted by Fickian theory. Modeling also provided insight into the design and construction of devices to yield desired drug delivery responses.
2. Materials and methods
2.1. Materials
2-hydroxyethyl methacrylate (HEMA) was obtained from Acros Organics and poly(ethylene glycol) 550 dimethacrylate (PEG550DMA) was obtained from Sigma-Aldrich. Diethylene glycol dimethacrylate (DEGDMA) was purchased from Polysciences, Inc. (Warrington, PA). The photoinitiator 2,2-dimethoxy-2-phenylacetophenone (DMPA) was obtained from Ciba Specialty Chemicals. The model release solutes in this study, Texas Red sulfonyl chloride (TxR, MW = 625 Da) and 2′,7′-difluorofluorescein [Oregon Green 488 (OG488), MW = 368 Da] were obtained from Invitrogen. All chemicals were used as received.
2.2. Equilibrium swelling experiments
Equilibrium swelling experiments were performed by placing poly(PEG550DMA) and PHEMA disks (n = 3–5, diameter ~10 mm, thickness ~0.4 mm) in DI-H2O until constant masses were attained. The disks were then patted dry and the swollen masses were recorded. Dry masses were measured after drying the disks in a vacuum oven for several days. The equilibrium mass swelling ratio, q, was calculated by dividing the swollen mass by the dry mass for each sample.
2.3. Construction of multilaminates
HEMA monomer solutions were created by combining 65 wt% monomer with 35 wt% deionized water and 0.1 wt% DMPA. The HEMA monomer component contained 1–10 wt% DEGDMA. PEG macromer solutions were created by combining PEG550DMA (65 wt%) with 0.1 wt% DMPA in deionized water. Hydrogels of both PHEMA and PEG550DMA exhibit minimal swelling post-polymerization when cured in 35 wt% water, which is an important property that provides excellent compatibility and adhesion between layers. Furthermore, the minimal swelling in the gels post-polymerization eliminates the confounding effects of water uptake and the complexity of moving boundaries during release experiments. Multilaminates were constructed by photopolymerizing monomer solutions between glass microscopy slides using #2 cover slips (0.19–.25 mm thick) and squares cut from standard transparencies (~0.11 mm thick) as spacers. All photopolymerizations were performed at 4 °C using a Blak-Ray UV lamp (365 nm, ~20 mW/cm2). After the first layer was sufficiently polymerized, additional spacers were added between the slides, and the void created above the first layer was filled in with the second monomer solution. Subsequently, the mold was exposed to UV light and the process was repeated until the device was completed. Curing times of 7 and 10 min for HEMA and PEG550DMA, respectively, were confirmed with differential scanning calorimetry to ensure complete reactions. A 10 mm stainless steel punch was used to create polymer disks that had high diameter to thickness aspect ratios to ensure 1-D diffusion.
2.4. Determination of dye diffusion coefficients
To calculate effective diffusion coefficients for the dye molecules in each matrix material, disks of each material were swelled in 5 μM dye solutions for sufficient time to attain equilibrium. High diameter-to-thickness aspect ratio (10 mm: 0.4 mm) disks were used to approximate one-dimensional diffusion in the z-direction by assuming radial diffusion to be negligible. Release studies were performed by placing each dye-loaded polymer disk in a vial containing 10 mL of DI-H2O under constant gentle shaking. The disks were placed in fresh solvent at predetermined time points to approximate sink conditions. Studies were carried out until probe release was no longer detectable. The probe quantity released in the vials was monitored using fluorescence intensity that was calibrated to probe concentration with a Wallac Victor2 1420 Multilabel Counter using 485/535 and 550/620 nm bandpass filters for the excitation/emission of OG488 and TxR, respectively. All release experiments were performed at room temperature in triplicate.
To estimate diffusion coefficients, the following equation from Crank [29] for diffusion from a planar geometry with spatially uniform loading releasing into a sink was fit to experimental data using non-linear least squares regressions with the MATLAB Curve Fit Toolbox [28].
| (1) |
In this expression, Mt/M∞ represents the cumulative fractional release, D is the dye diffusion coefficient, t is the time elapsed during release, and l is one-half of the total thickness of the sample.
2.5. Release studies
For release studies, dyes were mixed with polymer precursor solutions and these solutions were photopolymerized to encapsulate dye molecules with spatial control. The release studies were carried out as described in the determination of dye diffusion coefficients. At predetermined time points, 3-dimensional image stacks, spanning the thickness of the dye release disks, were captured using a Zeiss Pascal LSM 5 confocal microscope (Carl Zeiss, Thornwood, NY). OG488 was excited using the 488 nm line of an argon ion laser, and the fluorescence was collected using a 505 nm long-pass filter. Texas Red was excited with a 543 nm helium-neon laser, and fluorescence was collected with a 560 nm long-pass filter. Each image stack required approximately 2–4 min to capture. Images were captured as 512 × 512 pixels with a pixel size of 1.8 μm and as slices 5–10 μm thick. Improved z-resolution could be achieved, but was sacrificed to shorten imaging times and minimize photobleaching. Image stacks were analyzed using ImageJ software, which is distributed by the National Institutes of Health. Dye concentration was found to have a linear relationship with emission intensity for the range of concentrations used in these studies. As discussed in detail previously, there are many concerns when quantifying fluorescent dye emission, including photobleaching and signal attenuation [28]. In this work, relatively photostable fluorescent dyes, reduced laser intensities, short imaging times, and limited sample thicknesses were all utilized to minimize deleterious effects during the imaging process.
2.6. Theoretical modeling of concentration profiles and release behavior
To predict concentration and release profiles in laminated devices with uniform and nonuniform initial loading, and for comparison with experimentally observed behavior, a theoretical model was developed based on one-dimensional Fickian diffusion. A diagram of a model release system is shown in Figure 1, where Cn and Dn correspond to the initial drug concentration and the dye diffusion coefficient in the nth layer, respectively. In the case of uniform network structure, D1 = D2 = … = Da. The disk has a layers and a total thickness of L. The initial concentration profile is defined as f(z). Interfacial effects between layers of multilaminates were initially assumed to be negligible in this work. In addition, binding of the dyes to the polymer gel, as well as dye-dye interactions were assumed to be negligible. Starting with Fick’s second law of diffusion, an exact solution can be obtained (eq 3) to describe the transient concentration profile in the disk via separation of variables using the boundary condition of surface concentrations equal to zero by assuming sink conditions (C = 0, for z = 0 and z = L, t ≥ 0), and assuming a constant diffusion coefficient [29].
Fig. 1.
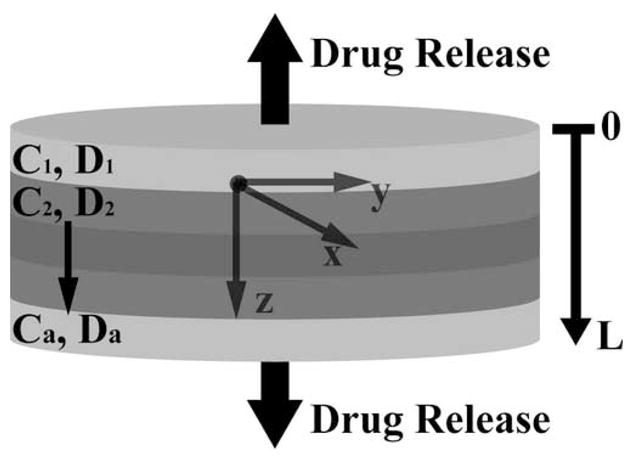
Schematic of drug release from multilaminate devices with nonuniform initial loading and spatially dependent diffusional properties, where the total thickness = L. For uniform diffusional properties, D1 = D2 = … = Da.
| (3) |
In this series of equations, λn = nπ/L. The final solution is then obtained by substituting the initial concentration profile for f(z′) in eq 3 and integrating from 0 to L. Here, the concentration profile f(z′) is for a multilaminated disk of thickness L, containing ‘a’ layers, where Cr is the initial concentration in each layer.
| (4) |
The drug flux (J(z,t)), or release rate, at each surface is calculated by differentiating eq 4 with respect to position at 0 and L. The total release rate is then given by the summation of the two surface fluxes.
| (5) |
The cumulative fractional release, Mt/M∞, was obtained by integrating the flux at both surfaces with respect to time using MATLAB.
In the case of spatially dependent diffusivity resulting from spatial differences in network structure, theoretical drug concentration and release profiles must be determined numerically, as the problem does not have an analytical solution. In this work, the method of lines was utilized [30]. In this technique, the partial differential equation was converted into a set of ordinary differential equations (ODEs) by discretizing the spatial derivatives using finite differences, as shown in equation 6. In this equation, the subscript i represents the spatial coordinate and Δzn is the node spacing in the nth layer. The set of ODEs was then solved with respect to time using MATLAB, again using sink conditions and the initial loading profile as boundary and initial conditions, respectively. In conjunction with spatially varying diffusion, this numerical method was also adapted to allow for the analysis of systems with spatially varying loading. Fractional release was calculated by spatially integrating the concentration profiles over time.
| (6) |
3. Results and discussion
3.1. Network Characterization
In hydrogels, rates of diffusion are dependent on several factors, particularly solute size, the volume fraction of water in the gel, and the network physical structure. In this work, materials with similar water content were desired to facilitate adhesion between layers. As the size of a given therapeutic molecule to be delivered is generally fixed, this leaves network structure as the main variable for controlling diffusion rates in these systems. To this end, network structure was varied by changing the percentage of crosslinking molecule, DEGDMA, that was added to HEMA, as well as modifying the material composition completely, using PEG550DMA.
To compare the structural and swelling properties of the polymer networks, equilibrium mass swelling ratios (q) were measured and converted to equilibrium volume swelling ratios (Q) using the densities of PEG, HEMA, and water [31]. In addition, the initial carbon-carbon double bond ([DB]o) and crosslinking double bond ([XL]o) concentrations for the monomer formulations were calculated. All of the double bonds in HEMA, DEGDMA, and PEGDMA contribute to the initial total double bond concentration, while only one of the double bonds on DEGDMA and PEGDMA are considered as crosslinkable double bonds. These structural properties are summarized in Table 1 for PHEMA with various crosslinking densities and PEG550DMA, as well as the diffusional properties based on eqn 1. While equilibrium swelling ratios in PHEMA decreased only slightly from 1.7 to 1.5 by systematically increasing crosslinker concentration from 1 to 10 wt% (approximately 0.5–5.6 mole %), the diffusion coefficient of OG488 in PHEMA decreased approximately 6-fold. Intuitively, increasing the crosslinking density in a gel hinders diffusion by increasing the number of obstructions and decreasing chain mobility.
Table 1.
Network and diffusional properties for specified HEMA and PEG networks formed from 35 wt% aqueous solutions.
| Monomer Composition | Q | [DB]o (mol/L) | [XL]o (mol/L) | DOG488 (cm2/s × 1010) | DTxR (cm2/s × 1010) |
|---|---|---|---|---|---|
| HEMA/1 wt% (0.5 mol%) DEGDMA | 1.7 ± 0.1 | 5.31 | 0.03 | 8.2 ± 1.4 | --- |
| HEMA/3 wt% (1.6 mol%) DEGDMA | 1.6 ± 0.0 | 5.32 | 0.09 | 7.8 ± 0.6 | --- |
| HEMA/5 wt% (2.7 mol%) DEGDMA | 1.6 ± 0.0 | 5.33 | 0.14 | 3.1 ± 1.2 | 2.7 ± 0.4 |
| HEMA/10 wt% (5.6 mol%) DEGDMA | 1.5 ± 0.0 | 5.35 | 0.29 | 1.3 ± 0.6 | --- |
| PEG550DMA | 1.6 ± 0.1 | 0.98 | 0.49 | 30 ± 3.3 | 22 ± 5.0 |
Interestingly, PEG550DMA, which possessed a similar Q-value to PHEMA with 5 wt% DEGDMA (Q = 1.6), yielded diffusion coefficients approximately one order of magnitude higher for both TxR and OG488. Crosslinked PHEMA and PEG550DMA are very different structurally. While the former consists of long chains of HEMA repeat units with the occasional crosslink due to the presence of DEGDMA, every PEG550DMA macromolecule has the potential to form a crosslink. As shown in Table 1, this leads to a much higher concentration of potential crosslinkable double bonds in PEG550DMA, suggesting that PEG has the potential to form a more tightly crosslinked network with lower diffusional properties, contrary to the observed behavior. However, this analysis ignores several other factors which contribute to the physical properties of these systems. First, diethylene glycol dimethacrylate is a known impurity in HEMA monomer solutions, which could significantly increase the effective crosslinking density in PHEMA gels [32]. Additionally, the long chains in PHEMA would be susceptible to physical entanglement, further impeding solute diffusion. Finally, and perhaps most importantly, polymer-solvent interaction parameters (χ) for PHEMA, as calculated by equation 2, are significantly higher than for PEG [15].
| (2) |
In this expression, ν2,s is the volume fraction of polymer relative to water in the swollen hydrogel, which is equivalent to 1/Q. Over a range of 1–10 wt% DEGDMA, calculated χ values range from 0.85–0.92, while PEG has a reported χ parameter of 0.426 [33]. The high χ values for PHEMA indicate that water is a relatively poor solvent for HEMA. This has been proposed as the main reason PHEMA gels demonstrate nearly constant swelling properties independent of crosslinking density and the initial water concentration [34,35]. The higher degree of solvation in PEG550DMA networks enables greater chain flexibility, and thus significantly faster solute diffusion is observed despite a higher theoretical concentration of crosslinking molecules.
Due to comparable swelling characteristics and the ability to maximize control of release rates because of significant differences in diffusional properties, PHEMA with 5% crosslinker and PEG550DMA were selected as the compositions to construct multilaminates. For consistency, PHEMA with 5 wt% crosslinker was also utilized in all experiments involving multilaminates with spatially uniform diffusivity. The diffusion coefficients listed in Table 1 were used in all theoretical calculations unless noted otherwise. Additionally, differences in partition coefficients between PHEMA and PEG550DMA were found to be statistically insignificant for both OG488 and TxR as determined by equilibrium loading during release experiments using ANOVA with α = 0.05.
3.2. Characterizing release from multilaminates with spatially uniform network structure
One of the primary concerns in creating multilaminate devices is the continuity of diffusion between layers. Interfacial anomalies may occur due to inefficient adhesion and/or interpenetrating networks. In addition to interfacial problems, several other issues may arise during the processing of multilaminate devices which may cause variations from expected release behavior. For instance, diffusion rates have a squared dependence on the path length of diffusion, so slight variations in layer thickness may cause significant changes in release profiles. In addition, diffusion between layers during processing may lead to discrepancies from intended loading. While monitoring release profiles indicates if a device is performing as predicted by theoretical principles, it does little to explain any incongruities in such behavior. CLSM provides a non-destructive tool to investigate the diffusion mechanism within a device in real time and to readily identify any unexpected obstacles.
In previous work, it was reported that interfacial effects were negligible in PHEMA multilaminates by comparing release profiles from monolithic and two-layer multilaminate devices [15]. To confirm these findings, release studies were performed with a three-layer PHEMA device and a monolithic device, both 0.48 mm in thickness and loaded with 10 μM OG488. Verifying previous results, the release profiles for the two devices were nearly identical throughout the entire release with no statistical differences measured, which suggests there was negligible resistance to diffusion between layers of the multilaminate PHEMA device.
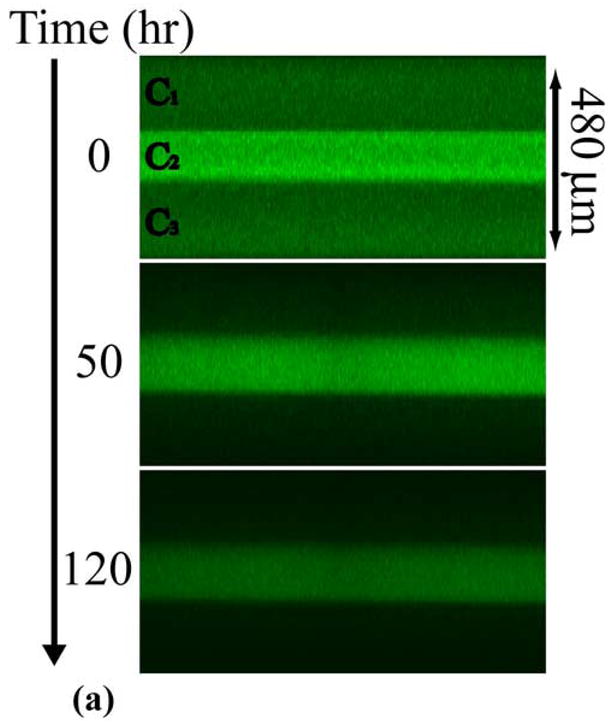
Photopolymerization of multilaminates provides a facile method for precise control of initial solute distributions by varying loading between layers. The ability to control release rates in multilaminates by varying initial solute distributions has been well documented [15–18]. To demonstrate CLSM characterization of a multilaminate device with spatially nonuniform loading and spatially uniform diffusional properties, a three layer PHEMA device was constructed. The device possessed an initial OG488 distribution of C1 = 1 μM, C2 = 3.5 μM, and C3 = 10 μM. The cross-sectional profiles of dye distribution during release are shown in Figure 2. The images are shown in false color to better illustrate the evolution of the distribution from three distinct layers initially, to a smooth profile after several days of release. The profiles were quantified through image analysis and estimated diffusion coefficients were substituted into the Fickian diffusion solutions to calculate concentration and release profiles. In Figure 3a, time dependent experimental and theoretical normalized dye concentrations are plotted with respect to spatial position in the sample. The dye concentrations are normalized to the highest dye concentration observed in the device. With time, the profile evolved from the nonuniform initial shape to a smooth parabolic profile centered in the device as dye was released faster from the bottom surface relative to the top due to the driving force associated with the initial concentration gradient.
Fig. 2.
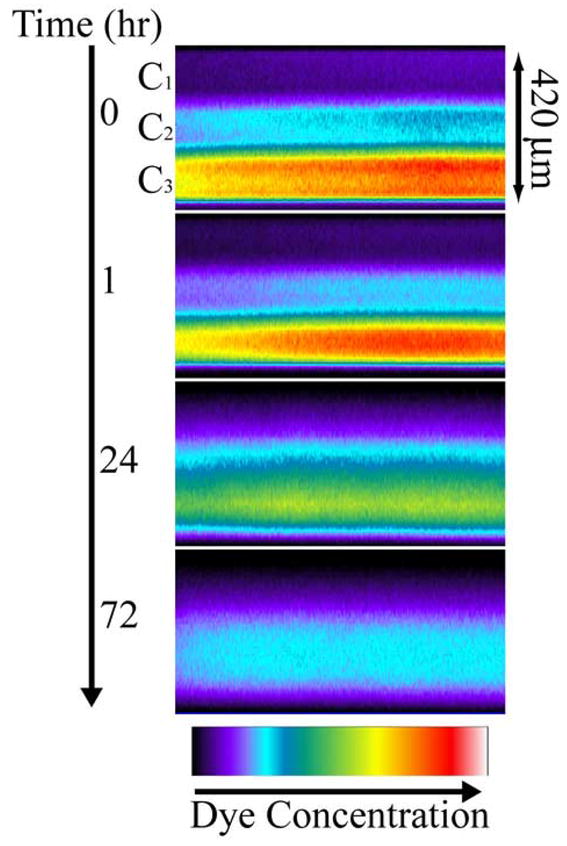
Time series of false color cross-sectional x-z planes for release of OG488 from a 3-layer PHEMA device with the following initial loading profile: C1 = 1 μM, C2 = 3.5 μM, and C3 = 10 μM.
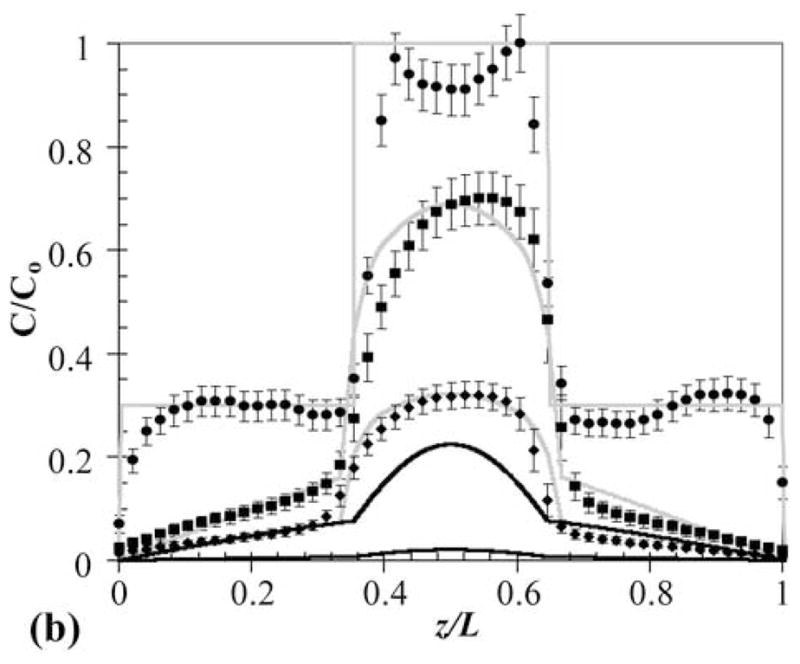
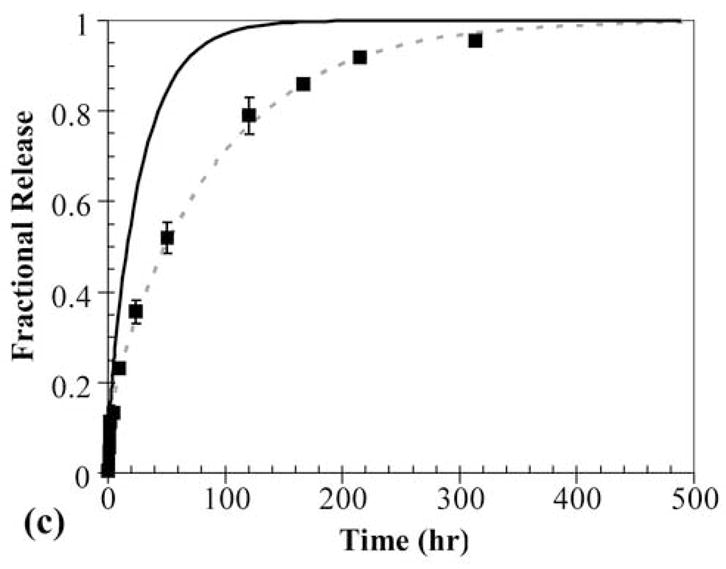
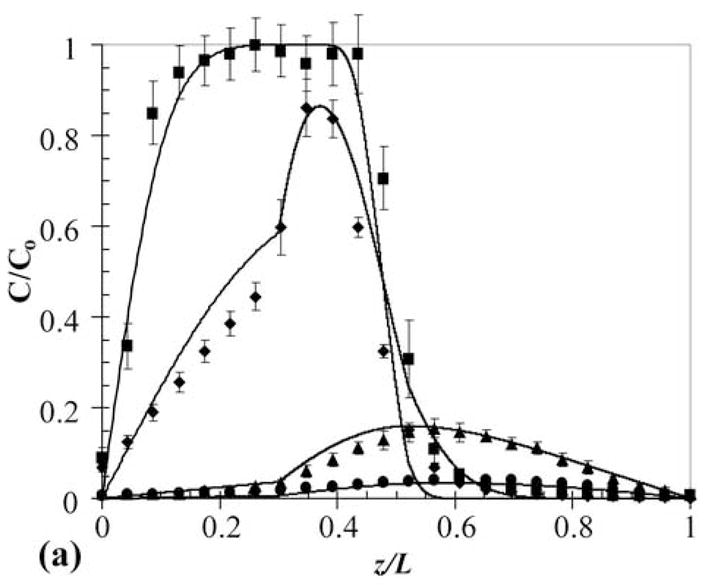
Fig. 3.
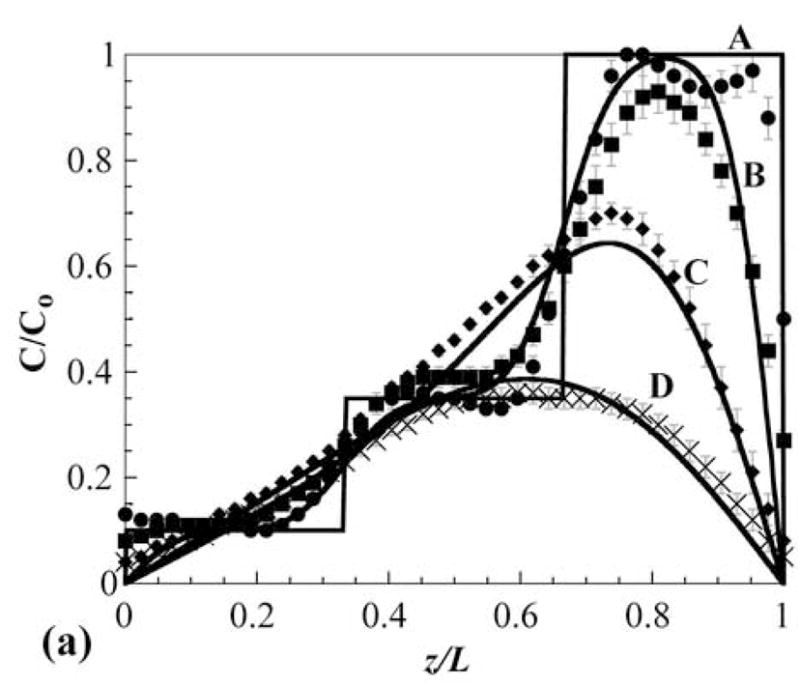
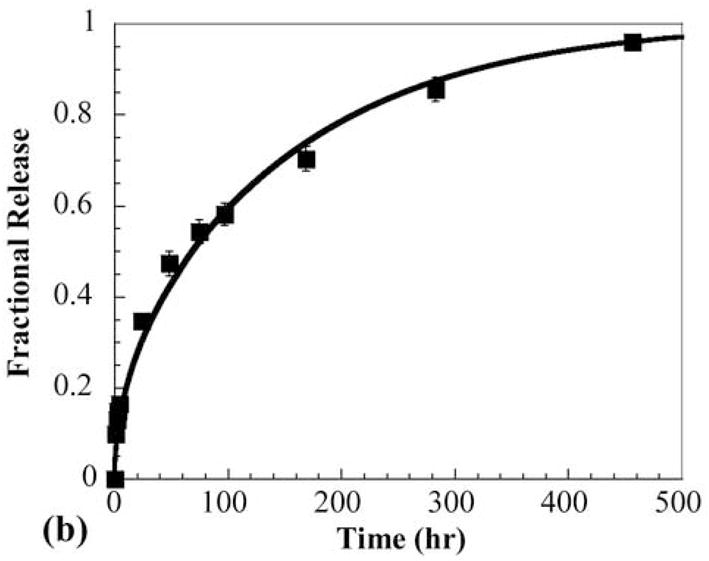
(a) Experimental (markers) and theoretical (solid lines) concentration profiles for release of OG488 from PHEMA multilaminate: A = 0 hr, B = 3 hr, C = 24 hr, D = 72 hr. z/L represents the dimensionless distance from the top of the disk, where 0 is the top surface and 1 is the bottom surface. The steps in concentration in A denote the layers. (b) Corresponding experimental (markers) and theoretical (line) cumulative fractional release profiles with the y-axis normalized to the total dye initially loaded in the disk. Error bars represent standard deviation.
In general, the experimental profiles exhibit very close agreement to those theoretically predicted. The biggest discrepancy is seen in the initial profiles, where the experimental profile differs from the theoretical primarily at the layer interfaces and the top and bottom edges of the sample. This is can be attributed to several factors. First, though the sample was imaged as soon after production as possible, the initial setup and imaging process took several minutes. This time allowed for some diffusion to occur before imaging, so the first experimental image is not truly a zero time point. Additionally, the device was cured at very close to the equilibrium water content of PHEMA. During processing, some water evaporation may occur, which would result in slight water gradients within the matrix. These gradients would affect the optical properties of the polymer, particularly at interfaces and edges, resulting in difficulty accurately quantifying dye distributions initially. After the device is placed in water, the water content quickly equilibrates, enabling more effective imaging, as seen in later time points. The time scale of swelling is much faster than dye diffusion and the magnitude of swelling was minimal, thus it was ignored in the theoretical approach. Discrepancies may also be magnified with depth due to signal attenuation and photobleaching.
The corresponding experimental and theoretical cumulative fractional release profiles plotted with respect to release time are shown in Figure 3b. The excellent agreement exhibited between experimental and theoretical profiles further suggests that interfaces between layers have minimal effect on the diffusion mechanism of multilaminate PHEMA devices.
3.3. Characterizing release from composite multilaminates with spatially varying network structure
Systematically varying the diffusional properties of multilaminate devices has been theoretically proposed as an additional method to control release profiles when combined with spatially nonuniform initial loading. To investigate this conjecture, several composite devices consisting of various combinations of PEG550DMA and PHEMA were constructed, including three-layer PEG-PHEMA-PEG and PHEMA-PEG-PHEMA devices. Without exception, the rates of release observed from these devices were significantly slower than theoretically predicted by Fickian diffusion models. To focus the discussion, the investigation of one such device is described in detail.
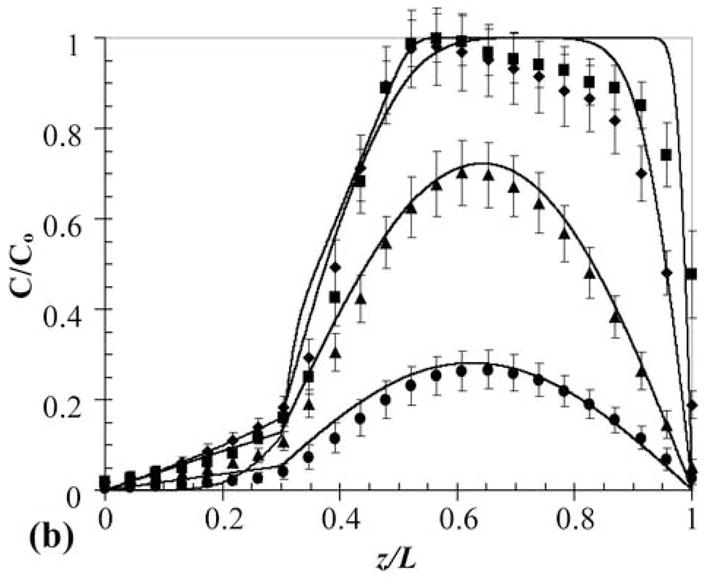
Specifically, a three-layer PEG-PHEMA-PEG device was constructed with layer thicknesses of 170-140-170 μm and OG488 loading of 3-10-3 μM, respectively. A time series of cross-sectional x-z planar images of the device is shown in Fig. 4a. These images show three distinct layers, with clear differences in initial dye distributions between layers. With time, the release of dye appears continuous between layers, with no apparent barriers to diffusion. However, when the profiles are quantified, as shown in Fig. 4b, observed dye release is much slower than theoretically predicted. In this plot, black lines represent theoretical predictions for the three-layer device using diffusion coefficients from Table 1, and the markers represent experimentally measured profiles. Deviations between the initial theoretical and experimental profiles are due to reasons discussed previously. At the 50 hr time point, the normalized concentration at the center of the device was measured to be approximately 0.7, while it was theoretically predicted to be approximately 0.2. Similarly, at the 120 hr time point, the experimentally observed normalized concentration was approximately 0.3, while the theoretically predicted concentration was 0.02. The cumulative fractional release profiles, shown in Fig. 4c, demonstrate a similar trend. The initial theoretical profile (solid black line), predicts much faster release than the observed experimental profile (markers).
Fig. 4.
(a) Time series of cross-sectional series x-z planes for release of OG488 from a 3-layer PEG-PHEMA-PEG device with the following initial loading profile: C1 = 3 μM, C2 = 10 μM, and C3 = 3 μM. (b) Corresponding experimental (markers) and theoretical (original, black lines, and adjusted, gray lines) concentration profiles for release of OG488 from multilaminate: ● = 0 hr, ■ = 50 hr, ◆ = 120 hr. The top black line represents the 50 hr time point and the bottom black line represents the 120 hr time point. The 0 hr original prediction lies directly under the adjusted prediction. (c) Corresponding experimental (markers) and theoretical (lines) cumulative fractional release profiles with the y-axis normalized to the total dye initially loaded in the disk. The solid black line represents the original theoretical prediction and the dashed gray line represents the adjusted prediction. Error bars represent standard deviation.
One possible explanation for the observed behavior is that interfaces between layers may be slowing diffusion. The interfaces are not acting as impermeable barriers, as the concentration profiles in Figs. 4a and 4b demonstrate continuity of diffusion between layers, but diffusion may be hindered due to differences in network structure. These differences may be the result of interpenetrating networks formed during construction of the device. After the first PEG layer was polymerized, the HEMA monomer solution was placed on top. Before complete gelling of the second layer, some of the monomer solution probably penetrated the first polymer layer. When this interfacial region cured, an interpenetrating PEG-PHEMA network formed with a higher crosslink density than in either homopolymer layer. A similar process likely occurred during the formation of the third layer.
To test this hypothesis, the device was modeled as a 5-layer multilaminate, with the 2nd and 4th layers representing the interfacial regions. Each of these layers was 30 μm thick with DOG488 = 3.3 × 10⁻¹¹ cm2/s. These parameters were selected to minimize deviations between the theoretical profiles and experimental data. The adjusted theoretical normalized concentration profiles and cumulative release profiles are shown in Figs. 4b and 4c. The adjusted concentration profiles in Fig. 4b are very similar in shape and magnitude to the experimentally measured profiles, suggesting that the interfacial regions are hindering dye release. Similarly, the adjusted cumulative release profile in Fig. 4c follows the experimental profile very closely, further supporting the interfacial impedance theory.
While interfacial layers could be used to further direct drug release rates, the ability to control and even eliminate these regions is an important consideration. To increase the viscosity of the monomer solutions and possibly limit penetration into cured layers, the devices could be constructed in the absence of water. The glassy polymer layers would also be more resistant to monomer diffusion. Since the time scale of swelling is on the order of a few hours in comparison to several days for the time scale of release, forming the devices in the bulk state may be the best option for prefabrication. The glassy polymer devices would also immobilize the internal drug distribution during storage. The devices would then swell and become rubbery when placed in an aqueous environment. Furthermore, a higher degree of control of interfacial layers could be attained by grafting layers together using living radical polymerization techniques [36].
3.4. Multicomponent release
Multilaminate composites provide a method to simultaneously deliver two different therapeutics at different rates and with unique release profiles from a single device. This technique would be valuable in cases where a time staggered drug regime is effective, or when two drugs work synergistically in tandem. Furthermore, in hydrogels used in tissue engineering applications, this approach could be used for temporal control of growth factor release to induce cell responses. To demonstrate this capability and to develop a general understanding of release from such devices, a two-layer PEG550DMA-PHEMA device was constructed with 100 μM OG488 loaded in the PEG layer and 80 μM TxR in the PHEMA layer. One advantage of CLSM as an investigative tool is the ability to monitor multiple fluorescent species concurrently. A time series of cross-sectional x-z planar images of the device during release is shown in Fig. 5. Initially, distinct green and red layers are visible. With time, the OG488 is released quickly from the PEG550DMA and is visibly imperceptible after 24 hr. The TxR is released much slower from the PHEMA layer and is still visible after 72 hr. However, as with the three-layer composite, when quantified the experimental concentration profiles (Fig. 6a and Fig. 6b) demonstrate a significantly slower rate of release than theoretical concentration profiles (not shown) would suggest when modeled as a two-layer device. This again suggests that an interfacial region may be inhibiting dye release. Additionally, overlap of the OG488 and TxR profiles was seen in the initial time points, indicating diffusion had occurred between layers during processing. This phenomenon is also visible in the quantified experimental concentration profiles for OG488 in Figure 6a, as the dye quickly diffuses out of the PEG layer, leaving an unexpected peak in the profile at 2 hrs where overlap of the matrices has occurred. With time, the peak smoothes out, forming a parabolic profile in the PHEMA layer, while minimal dye remains in the PEG layer. The experimental and theoretical cumulative release profiles shown in Fig. 6c further support the presence of an interfacial layer. Experimental profiles for both OG488 and TxR exhibited significantly slower release than initially theoretically predicted.
Fig. 5.
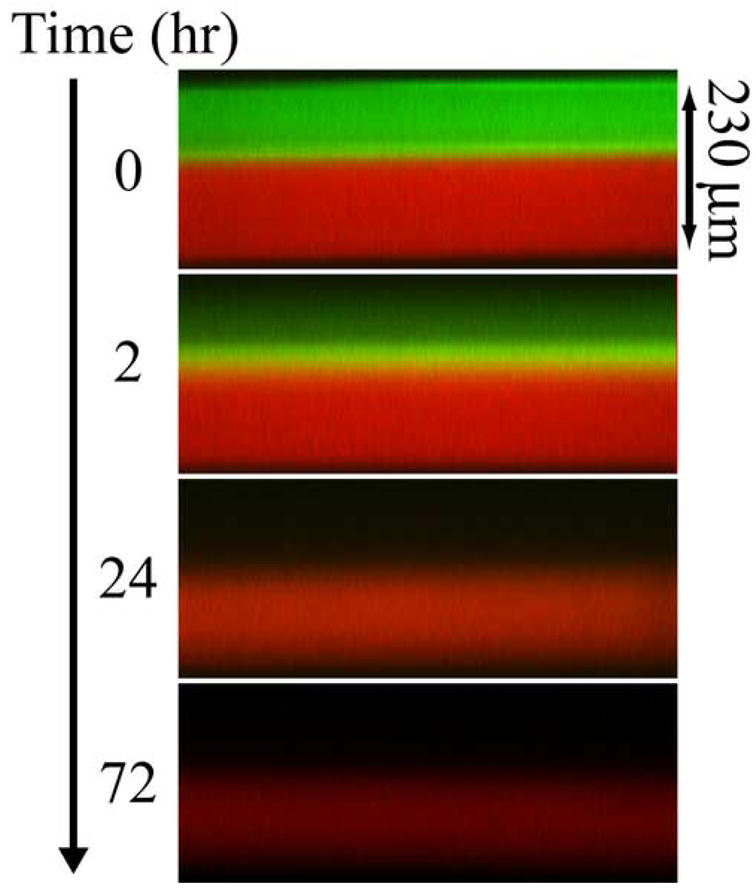
Time series of cross-sectional x-z planes for release of OG488 and TxR from a 2-layer PEG-PHEMA composite device.
Fig. 6.

Experimental (markers) and adjusted theoretical (lines) concentration profiles for release of OG488 (a) and TxR (b) from PEG550DMA-PHEMA 2-layer multilaminate: ■ = 0 hr, ◆ = 2 hr, ▲ = 24 hr, ● = 72 hr. Solid markers and black lines represent TxR and hollow markers and gray lines represent OG488. (c) Corresponding experimental (markers) and theoretical (lines) cumulative fractional release profiles with the y-axis normalized to the total dye initially loaded in the disk. Gray signifies TxR, while black signifies OG488. Solid lines are the original theoretical profiles, and dashed lines represent the adjusted profiles. Error bars represent standard deviation.
To account for the hypothesized interfacial layer, an adjusted model was developed for the increased interfacial diffusion coefficient and the dye diffusion that occurred during construction of the device. The device was modeled as a three-layer multilaminate with a 50 μm interfacial layer. In the interfacial layer, DTxR = 1.7 × 10⁻¹⁰ cm2/s and DOG488 = 1.8 × 10⁻¹⁰ cm2/s. These parameters were selected to minimize deviations between the theoretical profiles and experimental data. The normalized concentration profiles for both OG488 and TxR for the adjusted model are plotted with the experimentally observed profiles in Fig. 6a. Overall, the adjusted theoretical profiles describe the experimentally observed behavior quite well. The biggest discrepancies are seen in the 0 and 2 hr profiles for TxR. This is mostly attributed to signal attenuation with depth due to the relatively high dye concentrations used. Additionally, the adjusted theoretical cumulative release profiles are plotted in Fig. 6c with the experimentally observed profiles and the original model predictions. These adjusted model predictions also describe the experimentally observed behavior well for both OG488 and TxR. In addition to eliminating the interfacial layer using previous suggestions, an impermeable layer could be added between the two layers to completely eliminate any interactions to gain better control of release behavior.
4. Conclusions
Using low molecular weight fluorescent dyes as model drugs, photopolymerized multilaminate controlled release hydrogel devices with spatially varying loading and structural properties were characterized by imaging dye distributions with CLSM and monitoring release rates. Theoretical models based on Fickian diffusion were developed for comparison and for the future purpose of assisting in the design and construction of devices to obtain desired release profiles. In multilaminate devices composed of only PHEMA, dye diffusion was continuous between layers and no interfacial hindrances were observed. In composite devices composed of PHEMA and PEG550DMA, though dye diffusion was continuous between layers, the release and concentration profiles indicated slower diffusion than predicted. A mechanism of interpenetrating networks formed at the interfaces to impede diffusion was proposed to explain the observed behavior. When the interfacial layers were accounted for in theoretical models, experimental behavior was adequately described theoretically. Finally, a multilaminate composite device was constructed to demonstrate concurrent release of two components at significantly different rates. These experiments may find utility in designing drug delivery matrices, as well as cell-constructs for the regeneration of complex tissues.
Acknowledgments
This work was supported by a grant from the NIH (DE12998), a GAANN fellowship to AWW from the US Department of Education, and funding to SLS from the University of Colorado Undergraduate Research Opportunities Program. The authors thank Dr. W. Fred Ramirez and Christopher Brotherton for many helpful discussions on numerically solving partial differential equations and MATLAB.
Footnotes
Publisher's Disclaimer: This is a PDF file of an unedited manuscript that has been accepted for publication. As a service to our customers we are providing this early version of the manuscript. The manuscript will undergo copyediting, typesetting, and review of the resulting proof before it is published in its final citable form. Please note that during the production process errors may be discovered which could affect the content, and all legal disclaimers that apply to the journal pertain.
References
- 1.Narasimhan B, Mallapragada SK, Peppas NA. Release Kinetics, Data Interpretation. In: Mathiowitz E, editor. Encyclopedia of Controlled Drug Delivery. New York, NY: John Wiley & Sons; 1999. p. 921. [Google Scholar]
- 2.Peppas NA, Bures P, Leobandung W, Ichikawa H. Hydrogels in pharmaceutical formulations. Eur J Pharm Biopharm. 2000;50(1):27–46. doi: 10.1016/s0939-6411(00)00090-4. [DOI] [PubMed] [Google Scholar]
- 3.Conte U, Maggi L, Colombo P, La Manna A. Multi-layered hydrophilic matrixes as constant release devices (Geomatrix systems) J Controlled Release. 1993;26(1):39–47. [Google Scholar]
- 4.Narasimhan B, Langer R. Zero-order release of micro- and macromolecules from polymeric devices: the role of the burst effect. J Controlled Release. 1997;47(1):13–20. [Google Scholar]
- 5.Lee ES, Kim SW, Kim SH, Cardinal JR, Jacobs H. Drug release from hydrogel devices with rate-controlling barriers. J Membrane Sci. 1980;7(3):293–303. [Google Scholar]
- 6.Knoch A, Merkle HP. Polymeric laminates for transdermal delivery. II: In vitro release and release mechanism. Acta Pharm Technol. 1987;33(4):202–7. [Google Scholar]
- 7.Bodmeier R, Paeratakul O. Drug release from laminated polymeric films prepared from aqueous latexes. J Pharm Sci. 1990;79(1):32–6. doi: 10.1002/jps.2600790109. [DOI] [PubMed] [Google Scholar]
- 8.Sajeev C, Saha RN. Formulation and comparative evaluation of controlled release diclofenac tablets prepared by matrix-embedding technique, membrane barrier technique, and combination of the two. Drug Dev Res. 2001;53(1):1–8. [Google Scholar]
- 9.Langer R, Peppas NA. New Drug Delivery Systems. BMES Bulletin. 1992;16(3):3–7. [Google Scholar]
- 10.Goepferich A. Bioerodible implants with programmable drug release. J Controlled Release. 1997;44(23):271–281. [Google Scholar]
- 11.Quick DJ, Macdonald KK, Anseth KS. Delivering DNA from photocrosslinked, surface eroding polyanhydrides. J Controlled Release. 2004;97(2):333–343. doi: 10.1016/j.jconrel.2004.03.001. [DOI] [PubMed] [Google Scholar]
- 12.Berkland C, Kipper MJ, Narasimhan B, Kim K, Pack DW. Microsphere size, precipitation kinetics and drug distribution control drug release from biodegradable polyanhydride microspheres. J Controlled Release. 2004;94(1):129–141. doi: 10.1016/j.jconrel.2003.09.011. [DOI] [PubMed] [Google Scholar]
- 13.Lee PI. Initial Concentration Distribution as a Mechanism for Regulating Drug Release from Diffusion Controlled and Surface Erosion Controlled Matrix Systems. J Controlled Release. 1986;4:1–7. [Google Scholar]
- 14.Zhou Y, Wu XY. Finite element analysis of diffusional drug release from complex matrix systems. I. Complex geometries and composite structures. J Controlled Release. 1997;49(2–3):277–288. doi: 10.1016/s0168-3659(97)00159-4. [DOI] [PubMed] [Google Scholar]
- 15.Lu S, Anseth KS. Photopolymerization of multilaminated poly(HEMA) hydrogels for controlled release. J Controlled Release. 1999;57(3):291–300. doi: 10.1016/s0168-3659(98)00125-4. [DOI] [PubMed] [Google Scholar]
- 16.Lu S, Ramirez WF, Anseth KS. Photopolymerized, multilaminated matrix devices with optimized nonuniform initial concentration profiles to control drug release. J Pharm Sci. 2000;89(1):45–51. doi: 10.1002/(SICI)1520-6017(200001)89:1<45::AID-JPS5>3.0.CO;2-8. [DOI] [PubMed] [Google Scholar]
- 17.Charalambopoulou GC, Kikkinides ES, Papadokostaki KG, Stubos AK, Papaioannou AT. Numerical and experimental investigation of the diffusional release of a dispersed solute from polymeric multilaminate matrixes. J Controlled Release. 2001;70(3):309–319. doi: 10.1016/s0168-3659(00)00357-6. [DOI] [PubMed] [Google Scholar]
- 18.Georgiadis MC, Kostoglou M. On the optimization of drug release from multi-laminated polymer matrix devices. J Controlled Release. 2001;77(3):273–285. doi: 10.1016/s0168-3659(01)00510-7. [DOI] [PubMed] [Google Scholar]
- 19.Bryant SJ, Anseth KS. The effects of scaffold thickness on tissue engineered cartilage in photocrosslinked poly(ethylene oxide) hydrogels. Biomaterials. 2001;22(6):619–626. doi: 10.1016/s0142-9612(00)00225-8. [DOI] [PubMed] [Google Scholar]
- 20.Burdick JA, Anseth KS. Photoencapsulation of osteoblasts in injectable RGD-modified PEG hydrogels for bone tissue engineering. Biomaterials. 2002;23(22):4315–4323. doi: 10.1016/s0142-9612(02)00176-x. [DOI] [PubMed] [Google Scholar]
- 21.Elisseeff J, McIntosh W, Anseth K, Riley S, Ragan P, Langer R. Photoencapsulation of chondrocytes in poly(ethylene oxide)-based semi-interpenetrating networks. J Biomed Mater Res. 2000;51(2):164–171. doi: 10.1002/(sici)1097-4636(200008)51:2<164::aid-jbm4>3.0.co;2-w. [DOI] [PubMed] [Google Scholar]
- 22.Liu VA, Bhatia SN. Three-Dimensional Photopatterning of Hydrogels Containing Living Cells. Biomed Microdevices. 2002;4(4):257–266. [Google Scholar]
- 23.Nguyen KT, West JL. Photopolymerizable hydrogels for tissue engineering applications. Biomaterials. 2002;23(22):4307–4314. doi: 10.1016/s0142-9612(02)00175-8. [DOI] [PubMed] [Google Scholar]
- 24.Quick DJ, Anseth KS. Gene Delivery in Tissue Engineering: A Photopolymer Platform to Coencapsulate Cells and Plasmid DNA. Pharm Res. 2003;20(11):1730–1737. doi: 10.1023/b:pham.0000003368.66471.6a. [DOI] [PubMed] [Google Scholar]
- 25.Quick DJ, Anseth KS. DNA delivery from photocrosslinked PEG hydrogels: encapsulation efficiency, release profiles, and DNA quality. J Controlled Release. 2004;96(2):341–351. doi: 10.1016/j.jconrel.2004.01.021. [DOI] [PubMed] [Google Scholar]
- 26.Burdick JA, Mason MN, Hinman AD, Thorne K, Anseth KS. Delivery of osteoinductive growth factors from degradable PEG hydrogels influences osteoblast differentiation and mineralization. J Controlled Release. 2002;83(1):53–63. doi: 10.1016/s0168-3659(02)00181-5. [DOI] [PubMed] [Google Scholar]
- 27.Lu S, Ramirez WF, Anseth KS. Modeling and optimization of drug release from laminated polymer matrix devices. AIChE J. 1998;44(7):1689–1696. [Google Scholar]
- 28.Watkins AW, Anseth KS. Investigation of Molecular Transport and Distributions in Poly(ethylene glycol) Hydrogels with Confocal Laser Scanning Microscopy. Macromolecules. 2005;38(4):1326–1334. [Google Scholar]
- 29.Crank J. The Mathematics of Diffusion. New York: Oxford University Press; 1975. [Google Scholar]
- 30.Constanides A, Mostoufi N. Numerical Methods for Chemical Engineers with MATLAB Applications. Upper Saddle River, NJ: Prentice Hall; 1999. p. 560. [Google Scholar]
- 31.Peppas NA, Barr-Howell BD. Characterization of the Cross-linked Structure of Hydrogels. In: Peppas NA, editor. Hydrogels in Medicine and Pharmacy. Boca Raton, FL: CRC Press; 1986. pp. 27–56. [Google Scholar]
- 32.Lou X, Van Coppenhagen C. Mechanical characteristics of poly(2-hydroxyethyl methacrylate) hydrogels crosslinked with various difunctional compounds. Polym Int. 2001;50(3):319–325. [Google Scholar]
- 33.Merrill EW, Dennison KA, Sung C. Partitioning and diffusion of solutes in hydrogels of poly(ethylene oxide) Biomaterials. 1993;14(15):1117–26. doi: 10.1016/0142-9612(93)90154-t. [DOI] [PubMed] [Google Scholar]
- 34.Refojo MF, Yasuda H. Hydrogels from 2-hydroxyethyl methacrylate and propylene glycol monoacrylate. J Appl Polym Sci. 1965;9(7):2425–35. [Google Scholar]
- 35.Peppas NA, Moynihan HJ, Lucht LM. The structure of highly crosslinked poly(2-hydroxyethyl methacrylate) hydrogels. J Biomed Mater Res. 1985;19(4):397–411. doi: 10.1002/jbm.820190405. [DOI] [PubMed] [Google Scholar]
- 36.Hutchison JB, Haraldsson KT, Good BT, Sebra RP, Luo N, Anseth KS, Bowman CN. Robust polymer microfluidic device fabrication via contact liquid photolithographic polymerization (CLiPP) Lab Chip. 2004;4(6):658–662. doi: 10.1039/b405985a. [DOI] [PubMed] [Google Scholar]