

Abstract
Stroke is the world’s third leading cause of death. One cause of stroke, intracranial aneurysm, affects ~2% of the population and accounts for 500,000 hemorrhagic strokes annually in midlife (median age 50), most often resulting in death or severe neurological impairment1. The pathogenesis of intracranial aneurysm is unknown, and because catastrophic hemorrhage is commonly the first sign of disease, early identification is essential. We carried out a multistage genome-wide association study (GWAS) of Finnish, Dutch and Japanese cohorts including over 2,100 intracranial aneurysm cases and 8,000 controls. Genome-wide genotyping of the European cohorts and replication studies in the Japanese cohort identified common SNPs on chromosomes 2q, 8q and 9p that show significant association with intracranial aneurysm with odds ratios 1.24-1.36. The loci on 2q and 8q are new, whereas the 9p locus was previously found to be associated with arterial diseases, including intracranial aneurysm2-5. Associated SNPs on 8q likely act via SOX17, which is required for formation and maintenance of endothelial cells6-8, suggesting a role in development and repair of the vasculature; CDKN2A at 9p may have a similar role9. These findings have implications for the pathophysiology, diagnosis and therapy of intracranial aneurysm.
Siblings of intracranial aneurysm probands are at ~fourfold increased risk of hemorrhage from intracranial aneurysm, suggesting a genetic component to risk10. Genome-wide linkage studies of familial cases11 and rare apparently mendelian kindreds have not thus far identified robustly replicable loci, and no underlying mutations have been identified12-14. Similarly, examination of candidate genes in small case-control studies has failed to produce replicable results12.
These considerations motivate the use of GWAS to identify common variants that contribute to intracranial aneurysm. We carried out a multistage intracranial aneurysm GWAS in three cohorts: a Finnish cohort of 920 cases and 985 controls, a Dutch cohort of 781 cases and 6,424 controls and a Japanese cohort of 495 cases and 676 controls (see Supplementary Methods online).
The study design consisted of a first stage of genome-wide genotyping of the European cohorts on the Illumina platform, careful matching of cases and controls, and identification of intervals harboring SNPs that surpassed a significance threshold of 5 × 10⁻⁷ for association with intracranial aneurysm2. This discovery phase had 80% power to detect common alleles that confer a genotype relative risk (GRR) of 1.31 and 50% power to detect a GRR of 1.25 (assuming an additive model in log-odds scale). Replication of association of SNPs in these intervals was tested in the Japanese cohort, setting P < 0.05 for significant replication. The replication study had 80% and 66% power to replicate SNPs with GRRs of 1.31 and 1.25, respectively. The utility of using a genetically diverse population for replication has been demonstrated by recent studies15, thereby extending association results to a broad segment of the world’s population.
Discovery phase genotypes were processed using rigorous quality controls; because Dutch controls and some Finnish controls were genotyped separately on Illumina chips of varying SNP density, particular attention was paid to ensuring consistent genotyping performance and excluding nonrandom genotyping error within and across cohorts (Supplementary Methods and Supplementary Tables 1 and 2 online). To control for population stratification, we genetically matched cases and controls from each cohort16, resulting in a dataset in which cases and controls are similarly distributed along axes of significant principal components (Supplementary Table 1).
We tested for association between each SNP and intracranial aneurysm by using the Cochran-Armitage trend test in each cohort and combined the results using the Mantel extension test. The distribution of test statistics for association of SNPs with intracranial aneurysm in the combined cohort is shown in Figure 1a. The genomic inflation factor (λ) was 1.043 and 1.136 for the Finnish and Dutch, respectively, and 1.114 combined, indicating well-matched populations17 (Fig. 1a); further logistic regression including principal components as covariates2 did not significantly change λ (Supplementary Fig. 1 online), nor did exclusion of SNPs with call rates <99% in any case or control cohort (Supplementary Methods); in contrast, because genomic inflation factor increases with sample size18, the large Dutch control sample was a major contributor to λ (Supplementary Methods). The association results reveal a number of SNPs whose P values exceed those expected under the null hypothesis; these persist after correction for λ (Fig. 1b). The P values across each chromosome are shown in Figure 1c. Four intervals (on 1q, 2q, 8q and 9p) harbored SNPs that surpassed the threshold for genome-wide significance; these include multiple SNPs with correlated P values and comprise 15 of the 16 SNPs with P < 10-6 (Fig. 1c). Associated SNPs in each interval have very high call rates in every cohort and none violate HWE in any cohort (Supplementary Table 2). The first three loci have not previously shown association with intracranial aneurysm or other diseases, whereas SNPs on 9p are in the block of linkage disequilibrium (LD) that has previously been shown to be associated with myocardial infarction2-4, abdominal aortic aneurysm and intracranial aneurysm5. Both Finnish and Dutch cohorts contributed to the significance of each locus, the risk alleles were identical and their odds ratios were not significantly different between cohorts (Table 1).
Figure 1.
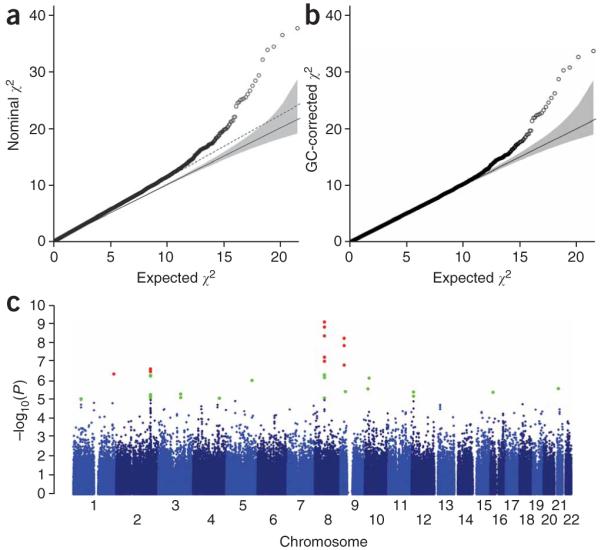
Genome-wide association of SNPs with intracranial aneurysm in the combined European cohort. (a) Quantile-quantile plot of the observed χ2 values derived from the Mantel-extension test statistics versus the expected χ2 distribution. The solid line represents concordance of observed and expected values. The slope of the dashed line represents the genomic inflation factor (λ = 1.11). (b) The plot of expected and observed χ2 values for association of SNPs with intracranial aneurysm after correction for the genomic inflation factor (λ = 1.0). Significant deviation from the expected values suggests association of these SNPs with intracranial aneurysm phenotype. (c) The -log10 of uncorrected P values for association of each SNP and intracranial aneurysm is plotted according to its physical position on successive chromosomes. Green dots indicate SNPs yielding P values <1 × 10⁻⁵, and red dots denote SNPs that surpass a significance level of 5 × 10⁻⁷.
Table 1.
Summary of results for five SNPs that characterize the association with intracranial aneurysm on chromosomes 2, 8 and 9
| Odds ratio (95% CI) |
|||||||||||||
|---|---|---|---|---|---|---|---|---|---|---|---|---|---|
| Chr. | SNP | Pos. (Mb) | Risk allele | Dataset | RAF (control/case) | P valuea | Per allele | Heterozygous | Homozygous | Heterogeneity Pb | Dom. Pc | PAF(%) | RRF(%) |
| 2 | rs1429412 | 197.9 | G | Finland | 0.42/0.48 | 4.4 × 10⁻⁴ | 1.27 (1.11-1.45) | 1.33 (1.07-1.65) | 1.60 (1.22-2.10) | - | 0.60 | - | - |
| Netherlands | 0.34/0.39 | 1.6 × 10⁻⁴ | 1.25 (1.11-1.40) | 1.35 (1.14-1.61) | 1.48 (1.15-1.90) | - | 0.21 | - | - | ||||
| Europe | - | 2.5 × 10⁻⁷ | 1.26 (1.15-1.37) | 1.34 (1.18-1.54) | 1.54 (1.28-1.85) | 0.85 | 0.21 | - | - | ||||
| Japan | 0.29/0.30 | 0.42 | 1.08 (0.90-1.30) | 1.05 (0.82-1.35) | 1.21 (0.78-1.86) | - | 0.76 | - | - | ||||
| All | - | 5.8 × 10⁻⁷ | 1.22 (1.13-1.32) | 1.27 (1.13-1.43) | 1.46 (1.24-1.73) | 0.32 | 0.40 | - | - | ||||
| rs700651 | 198.3 | G | Finland | 0.39/0.44 | 5.6 × 10⁻³ | 1.21 (1.06-1.39) | 1.19 (0.96-1.46) | 1.48 (1.12-1.96) | - | 0.81 | 14.1 | 0.7 | |
| Netherlands | 0.35/0.40 | 5.0 × 10⁻⁴ | 1.23 (1.09-1.38) | 1.22 (1.03-1.46) | 1.50 (1.18-1.91) | - | 0.99 | 14.1 | 0.7 | ||||
| Europe | - | 8.9 × 10⁻⁶ | 1.22 (1.12-1.33) | 1.21 (1.06-1.38) | 1.49 (1.25-1.79) | 0.89 | 0.87 | - | - | ||||
| Japan | 0.46/0.54 | 0.0011 | 1.30 (1.11-1.53) | 1.05 (0.79-1.41) | 1.70 (1.24-2.33) | - | 0.08 | 14.8 | 1.6 | ||||
| All | - | 4.4 × 10⁻⁸ | 1.24 (1.15-1.34) | 1.18 (1.04-1.33) | 1.56 (1.34-1.83) | 0.77 | 0.30 | - | - | ||||
| 8 | rs10958409 | 55.5 | A | Finland | 0.18/0.22 | 1.4 × 10⁻³ | 1.31 (1.11-1.55) | 1.40 (1.15-1.71) | 1.34 (0.81-2.21) | - | 0.20 | 11.7 | 0.9 |
| Netherlands | 0.15/0.20 | 1.4 × 10⁻⁷ | 1.46 (1.27-1.68) | 1.42 (1.20-1.69) | 2.28 (1.51-3.45) | - | 0.65 | 12.1 | 1.7 | ||||
| Europe | - | 1.6 × 10⁻⁹ | 1.39 (1.25-1.55) | 1.42 (1.25-1.61) | 1.83 (1.31-2.55) | 0.34 | 0.64 | - | - | ||||
| Japan | 0.25/0.30 | 0.016 | 1.26 (1.04-1.51) | 1.21 (0.94-1.55) | 1.66 (1.07-2.59) | - | 0.66 | 10.9 | 0.8 | ||||
| All | - | 1.4 × 10⁻¹⁰ | 1.36 (1.24-1.49) | 1.37 (1.22-1.54) | 1.79 (1.37-2.33) | 0.40 | 0.77 | - | - | ||||
| rs9298506 | 55.6 | A | Finland | 0.73/0.80 | 4.6 × 10⁻⁷ | 1.50 (1.28-1.75) | 1.26 (0.82-1.94) | 1.99 (1.31-3.01) | - | 0.41 | 38.5 | 2.0 | |
| Netherlands | 0.81/0.85 | 2.3 × 10⁻⁴ | 1.34 (1.15-1.56) | 1.50 (0.87-2.59) | 1.97 (1.15-3.35) | - | 0.66 | - | - | ||||
| Europe | - | 8.6 × 10⁻¹⁰ | 1.41 (1.27-1.58) | 1.37 (0.98-1.91) | 1.95 (1.41-2.70) | 0.32 | 0.84 | - | - | ||||
| Japan | 0.81/0.83 | 0.25 | 1.14 (0.92-1.41) | 0.59 (0.30-1.13) | 0.78 (0.41-1.47) | - | 0.04 | - | - | ||||
| All | - | 1.8 × 10⁻⁹ | 1.35 (1.22-1.49) | 1.16 (0.87-1.56) | 1.63 (1.23-2.16) | 0.13 | 0.29 | - | - | ||||
| 9 | rs1333040 | 22.1 | T | Finland | 0.47/0.52 | 2.8 × 10⁻³ | 1.22 (1.07-1.40) | 1.23 (0.98-1.54) | 1.50 (1.15-1.95) | - | 0.96 | 18.5 | 0.7 |
| Netherlands | 0.55/0.62 | 9.5 × 10⁻⁷ | 1.33 (1.19-1.50) | 1.38 (1.09-1.75) | 1.80 (1.41-2.31) | - | 0.73 | 30.2 | 1.4 | ||||
| Europe | - | 1.5 × 10⁻⁸ | 1.29 (1.18-1.40) | 1.30 (1.10-1.53) | 1.66 (1.39-1.98) | 0.34 | 0.89 | - | - | ||||
| Japan | 0.65/0.72 | 0.0024 | 1.32 (1.10-1.58) | 1.26 (0.83-1.91) | 1.69 (1.13-2.55) | - | 0.81 | 29.3 | 1.1 | ||||
| All | - | 1.4 × 10⁻¹⁰ | 1.29 (1.19-1.40) | 1.29 (1.11-1.50) | 1.67 (1.42-1.96) | 0.61 | 1.00 | - | - | ||||
SNPs that replicate with P < 0.05 in the Japanese cohort are italicized. Position shown is from NCBI build 36 coordinates. Risk allele is indexed to the forward strand of NCBI build 36.
The Cochran-Armitage trend test P value for cohorts from Finland, Netherlands and Japan, respectively, and the Mantel extension test (uncorrected for λ) P value for combined cohorts.
P value of the test of heterogeneity in effect size among populations.
P value of the test of deviation from an additive model. PAF, population attributable fraction. RRF, recurrence risk fraction attributable to each SNP, assuming the overall sibling recurrence risk of 4 (ref. 10).
To attempt to replicate these four loci, we genotyped 15 SNPs from these intervals in the Japanese cohort (Supplementary Tables 2 and 3 online). Eight of the 15 SNPs showed significant association with intracranial aneurysm; these included SNPs on 2q, 8q and 9p (Table 1). At each locus, SNPs in strong LD in the Japanese sample showed highly correlated P values (Fig. 2). For associated SNPs, risk alleles in Japan were identical to and showed similar odds ratios to those found in Europe (Table 1 and Supplementary Table 3). Using the Mantel extension test to combine data from all three cohorts, we found the following P values and odds ratios for the SNPs showing the strongest evidence for association at each locus: 2q, P = 4.4 × 10⁻⁸ (odds ratio (OR) = 1.24); 8q, P = 1.4 × 10⁻¹⁰ (OR = 1.36); 9p, P = 1.4 × 10⁻¹⁰ (OR = 1.29) (Table 1). No locus showed significant deviation from an additive model (log-odds scale) (Supplementary Table 3).
Figure 2.

Regional association plots and linkage disequilibrium structure. (a-c) The -log10 of the P value for association of each SNP and intracranial aneurysm in discovery phase across segments of 2q (a), 8q (b) and 9q (c) are shown as small diamonds (using NCBI build 36 for map locations). Fifteen SNPs that were genotyped in the Japanese replication cohort are shown as triangles that show the combined (discovery + replication) P values: blue triangles represent SNPs that demonstrate replication in the Japanese cohort with P < 0.05, and gray triangles denote SNPs with P > 0.05 in the replication study. SNPs with the most significant P values in each interval in the combined analysis are marked with their SNP IDs. Known transcripts (RefSeq database) are represented as horizontal bars at the bottom of each panel. Population-specific LD structures based on D’ are shown for the HapMap European (CEU) and Asian (CHB + JPT) cohorts21. The results demonstrate that on chromosome 2, SNPs spanning an ~800-kb interval are in strong LD in the CEU population and show evidence of association with intracranial aneurysm in the Finnish and Dutch cohorts. In Asia, this segment is broken into two smaller blocks of LD that are not strongly correlated with one another, and significant association with intracranial aneurysm in Japanese cohort is seen only for the telomeric segment. For chromosome 8, SNPs in two blocks that are not in significant LD with one another both show significant association with intracranial aneurysm in the European cohort; only SNPs located within the proximal block replicate in Japan. Cohort-specific r2 values among all SNPs genotyped in the replication studies are shown in Supplementary Table 4.
We examined the distributions of P values in each significant interval. At 2q, association in Europe lies within a large block of LD (197.8-198.6 Mb; Fig. 2 and Supplementary Table 4 online). In Asian subjects, this segment is divided into two smaller blocks of LD and the association seen in Japan is confined to SNPs in the more telomeric block (198.2-198.5 Mb). This interval contains four known genes; the two most strongly associated SNPs, rs700651 and rs700675, lie in introns of adjacent genes, BOLL and PLCL1. PLCL1 is of interest because it has significant homology to phospholipase C, which lies downstream of VEGFR2 signaling19. VEGFR2 is a marker of endothelial progenitor cells and has a role in central nervous system angiogenesis20.
The LD structure at 8q is also of interest (Fig. 2 and Supplementary Table 4). SNP rs10958409 shows the most significant association; SNPs in high LD with rs10958409 show correlated P values. In addition, however, rs9298506, which lies 110 kb distally and shows virtually no LD with rs10958409 (r2 = 0.004 in European HapMap subjects21, 0.004 in Finnish cases and 0.0005 in Dutch cases) none-theless also revealed significant association in Europeans; adjacent SNPs in LD showed correlated P values. This observation suggests the presence of two independent risk alleles. A conditional test of association demonstrated that after accounting for the association with rs9298506, rs10958409 still showed significant association with intracranial aneurysm (and vice versa), consistent with two risk loci (Supplementary Table 4). The Japanese cohort replicated association at rs10958409, but not rs9298506, despite having had 88% power to detect association of this latter SNP (Supplementary Table 3). Further work will be required to determine whether the European association with rs9298506 is a true positive result. This 8q interval contains a single gene, SOX17, which lies between these two association peaks, 43 kb from rs10958409 and 64 kb from rs9298506. The next closest genes lie 201 kb distal and 266 kb proximal to rs10958409. Sox17 has an important role in formation and maintenance of the endothelium (see below).
Finally, SNPs on 9p that showed association with intracranial aneurysm (22.07-22.10 Mb) (Fig. 2 and Supplementary Table 4) were in LD with SNPs that have previously shown association with multiple arterial diseases2-4. Adjacent SNPs that are associated with type 2 diabetes mellitus22-24 showed no significant association with intracranial aneurysm. The strongest association was with rs1333040, which lies 74 kb from the 5′ end of CDKN2B and 88 kb from CDKN2A. These genes encode the cyclin-dependent kinase inhibitors p15INK4b and p16INK4a, as well as ARF, a regulator of p53 activity. In addition, a non-protein-coding transcript (ANRIL) lies within this interval25. Among these, p16INK4a is of particular interest (see below).
To determine whether the effects of these loci are influenced by known risk factors, we examined the odds ratios of the most significant allele at each locus after partitioning cases by gender, family history of intracranial aneurysm, age (older half versus younger) and ruptured versus unruptured aneurysm. The results showed no significant difference in odds ratios after any of these partitions, suggesting independent contributions to risk (Supplementary Table 5 online).
Finally, to assess the combined effects of the three loci, we defined each subject’s risk score by summing the logarithm of the odds ratio for each risk allele they harbor as determined in each cohort. The observed intracranial aneurysm risk showed a significant linear relationship with risk score in each cohort, with a more than threefold increase from lowest to highest strata (Table 2 and Supplementary Table 6 online).
Table 2.
Increased intracranial aneurysm risk with increased risk score based on genotypes for rs700651, rs10958409 and rs133040
| Japan | Netherlands | Finland | |||||||
|---|---|---|---|---|---|---|---|---|---|
| No. of risk alleles | Frequency (control/case) | Average risk score (min-max) | OR (95% CI) | Frequency (control/case) | Average risk score (min-max) | OR (95% CI) | Frequency (control/case) | Average risk score (min-max) | OR (95% CI) |
| 0 or 1 | 0.14/0.08 | 0.23 (0.00-0.28) | 1 | 0.3/0.21 | 0.22 (0.00-0.38) | 1 | 0.32/0.21 | 0.17 (0.00-0.27) | 1 |
| 2 | 0.28/0.21 | 0.53 (0.46-0.55) | 1.29 (0.81-2.05) | 0.36/0.29 | 0.54 (0.41-0.75) | 1.13 (0.9-1.41) | 0.34/0.34 | 0.42 (0.38-0.54) | 1.47 (1.15-1.88) |
| 3 | 0.33/0.32 | 0.79 (0.72-0.82) | 1.63 (1.05-2.55) | 0.25/0.33 | 0.82 (0.70-1.04) | 1.88 (1.51-2.34) | 0.24/0.3 | 0.63 (0.59-0.74) | 1.82 (1.41-2.36) |
| 4 | 0.19/0.28 | 1.05 (0.99-1.08) | 2.41 (1.51-3.83) | 0.08/0.14 | 1.10 (0.98-1.33) | 2.40 (1.82-3.16) | 0.07/0.13 | 0.85 (0.79-0.94) | 2.83 (1.98-4.04) |
| 5 or 6 | 0.06/0.10 | 1.34 (1.26-1.54) | 2.91 (1.62-5.21) | 0.02/0.03 | 1.41 (1.36-1.74) | 2.63 (1.56-4.41) | 0.03/0.02 | 1.09 (1.06-1.33) | 1.16 (0.62-2.19) |
| P valuea | 3.3 × 10⁻⁷ | 8.4 × 10⁻¹⁶ | 7.8 × 10⁻⁸ | ||||||
| OR (95% CI)b | 2.91 (1.92-4.41) | 2.81 (2.19-3.61) | 2.88 (1.95-4.25) | ||||||
Individuals with non-missing genotypes for all six alleles were included in the analysis.
P value for linear relationship of risk score and logarithm of ORs (complete data set is listed in Supplementary Table 6).
Increase in odds ratio per one unit change in risk score.
This study provides the first results of a large GWAS of intracranial aneurysm or stroke. Three significant loci have been identified. These results cannot be explained by nonrandom genotyping error or population stratification and are robust to alternative analyses (Supplementary Fig. 1). We calculate that these loci collectively account for 38-46% of the population-attributable fraction of intracranial aneurysm and 2.3-3.8% of the sibling recurrence risk (Table 1). Additional common variants are likely to have a role in intracranial aneurysm, as the study was not well powered to find loci with GRR <1.25. In addition, population-specific effects were not considered in this study design. Given the risk allele frequencies and odds ratios of the identified loci, future replication cohorts will require ~900 to 1,600 cases and controls to have 80% power for replication (α = 0.05).
After genomic control correction and exclusion of SNPs at the four top loci, 37 SNPs remained with P values less than 10-4 (28 are expected by chance). Some of these may prove to be true risk alleles as additional cohorts are evaluated, as has occurred with type 2 diabetes26. In addition, rare variants with larger effects at these same loci may also contribute to the occurrence of intracranial aneurysm27,28.
Intracranial aneurysms predominate at arterial branch points and sites of shear stress, locations that incur endothelial damage. Vascular injury mobilizes bone marrow-derived cells that localize to these sites and contribute to repair29,30. SOX17, a member of the Sry-related HMG box transcription factor family, is of particular interest because it is required for both endothelial formation and maintenance6-8. Sox17 plays a key role in the generation and maintenance of fetal and neonatal stem cells of both hematopoietic and endothelial lineages8 and is expressed in adult endothelium6. Sox17-/- mice show multiple vascular abnormalities7; moreover, whereas Sox18-/- mice are normal, Sox18-/-;Sox17+/- mice show defective endothelial sprouting and vascular remodeling6. Similarly, p16INK4a has a role in regulation of stem (progenitor) cell populations, including bone marrow-derived cells of the vasculature9. These considerations suggest that intracranial aneurysm may result from defective stem (progenitor) cell-mediated vascular development and/or repair.
Finally, these findings have implications for identification of individuals with intracranial aneurysm before morbid events. The odds ratio of intracranial aneurysm increases greater than threefold in subjects with the highest versus the lowest risk (Table 2 and Supplementary Table 6). Although we caution that further work is required, these findings advance the potential for preclinical diagnosis by combined assessment of inherited susceptibility with previously established risk factors.
METHODS
Cohorts
The study protocol was approved by the Yale Human Investigation Committee (HIC protocol 7680). In all cases, the diagnosis of intracranial aneurysm was made with computerized tomography angiogram, magnetic resonance angiogram or cerebral digital subtraction angiogram and confirmed at surgery, when applicable. Rupture of aneurysm was defined by identification of acute subarachnoid hemorrhage (via computerized tomography or magnetic resonance imaging) from a proven aneurysm. Cases with a first-degree relative with intracranial aneurysm were considered familial, and other cases were considered sporadic.
Three cohorts from independent studies in Finland, The Netherlands and Japan were collected and all participants provided informed consent. There were 960 Finnish cases and 1,017 controls; 786 Dutch cases and 6,424 controls; and 495 Japanese cases and 676 controls. Japanese controls were screened for not harboring intracranial aneurysm.
Genotyping and SNP quality control
Genome-wide genotyping in European cohorts was done on the Illumina platform according to the manufacturer’s protocol (Illumina). We genotyped subjects on either the CNV370-Duo, HumanHap300 or HumanHap550 chips. SNPs shared across all platforms (n = 314,125) were extracted. We applied prespecified criteria to exclude samples and SNPs that performed poorly as well as samples that could not be genetically well matched (Supplementary Table 1 and Supplementary Methods). The overall median genotype call rate was 99.7% and the mean heterozygosity of all SNPs was 35%. Seventy-two duplicate pairs of samples were genotyped and showed 99.91% genotype identity. We carried out detailed analysis of the performance of SNPs across cohorts and platforms to ensure that significant associations observed were not due to differences in SNP performance (Supplementary Table 2).
Cryptic relatedness
We determined the identity by state (IBS) similarity and estimated the degree of relatedness for each pair of samples in the GWAS (Supplementary Methods) and excluded inferred first- and second-degree relatives (Supplementary Table 1).
Analysis of population structure
In order to identify population outliers and cases whose genetic ancestry cannot be properly matched to controls (and vice versa), we used the Genetic Matching (GEM) method described previously16 based on principal component analysis (PCA). After this matching process, three significant principal components remained in the Finnish cohort and none in the Dutch cohort, as previously observed (Supplementary Methods).
After quality control and analysis of population structure, there remained 874 cases and 944 controls in the Finnish cohort and 706 cases and 5,332 controls in the Dutch cohort. Among the Finnish cases, 57% were female; 73% had suffered ruptured aneurysm and 43% had positive family history; the median age at diagnosis was 50 years (those with rupture 49 years versus those without rupture 52 years). In the Dutch cohort, 69% were female, 92% had ruptured aneurysm, 15% had a positive family history and the median age was 49 years.
SNP association analysis
To test for association of each SNP with intracranial aneurysm, we assumed an additive (in log-odds scale) model. We used the Cochran-Armitage trend test for each cohort. For the combined sample of European descent or of European and Japanese cohorts, we used the Mantel extension test (Supplementary Methods).
We calculated the per-allele and genotype-specific ORs and their 95% confidence intervals by fitting 1-d.f. and 2-d.f. logistic models, respectively. We assessed heterogeneity of ORs among populations by considering the likelihood ratios of a logistic model with population by genotype interaction term(s) versus a linear model without the interaction term(s) and used a P value <0.05 as evidence of significant heterogeneity (Supplementary Table 3). To evaluate the degree of overdispersion of test statistics, we calculated the genomic inflation factor (λ) for each statistical test by the ratio of the mean of the lower 90% of observed test statistics to that of the expected χ2 values17. We applied the genomic control method to correct for λ (Fig. 1b) and then compared a pairwise plot of P values for each SNP in the trend and corrected tests to determine the potential effect of any residual population stratification (Supplementary Fig. 1a,b and Supplementary Methods).
We also examined the validity of the assumption of additivity (in log-odds scale) in the association tests by comparing likelihood ratios assuming alternative models of dominance and rejected additivity for P < 0.05 (ref. 2 and Supplementary Table 3).
For each chromosome segment showing significant association with intracranial aneurysm, we investigated whether more than one SNP had an independent marginal effect on intracranial aneurysm by the Mantel extension test conditioned on genotypes for SNPs within each interval (Supplementary Table 4).
To assess the robustness of our GWAS results, we also performed a weighted Z-score test and found that the results of this alternative analysis were highly correlated with the results of the Mantel extension test (Supplementary Fig. 1c).
Replication study in Japanese cohort
For the Japanese replication study, allelic discrimination assays were done with 15 SNPs on the Sequenom iPLEX genotyping platform according to the manufacturer’s protocol. For SNPs that showed significant P values, genotypes were repeated and P values confirmed on the TaqMan platform (Applied Biosystems). Association tests were done as described above, using P = 0.05 (in the Cochran-Armitage trend test with the same allele found associated in Europe) as the threshold for significance (Supplementary Table 3).
Subset analysis
For SNPs with the most significant P values we investigated whether the association results were affected by potential confounding variables such as rupture status, family history or gender. We compared genotype distributions of cases stratified by these variables using the trend test (Supplementary Table 5).
Population-attributable fraction and proportion of genetic variance attributable to SNPs
We investigated two risk measures based on replicated SNPs: the population attributable fraction (PAF) and the proportion of the sibling recurrence risk attributable to a SNP (‘recurrence risk fraction’) as previously described (Table 1 and Supplementary Methods). For these calculations we assumed intracranial aneurysm population prevalence of 2% and λsib of 4 (ref. 10). The combined contribution of SNPs was obtained by assuming the multiplicative model (Supplementary Methods).
Cumulative effects of risk alleles
We analyzed the cumulative effects of the risk alleles at the most significant SNP at 2q, 8q and 9p (rs700651, rs10958409 and rs1333040) by calculating the risk score for each individual by the weighted sum of the number of risk alleles as defined by
where ψ[i] is the logarithm of the calculated per-allel odds ratio at each locus and n[i] is the number of risk alleles at the same locus. We then assessed the risk score for each of the 27 possible three-locus genotypes in each cohort (Supplementary Table 6). We fitted a simple linear logistic model with an additive effect (on log-odds scale) for each cohort and performed a likelihood-ratio test. For display purposes, the 27 strata of Supplementary Table 6 are compressed into 5 strata shown in Table 2 according to the absolute number of risk alleles, which closely parallels the risk score.
Supplementary Material
ACKNOWLEDGMENTS
We are grateful to the participants who made this study possible. We thank A. Chamberlain, O. Törnwall, M. Alalahti, K. Helin, S. Malin and J. Budzinack for their technical help. This study was supported by the Yale Center for Human Genetics and Genomics and the Yale Program on Neurogenetics, the US National Institutes of Health grants R01NS057756 (M.G.) and U24 NS051869 (S.M.) and the Howard Hughes Medical Institute (R.P.L.). C.E.M. and M.W.S. are supported by a gift from the Lawrence Family and Y.M.R. by the Dr E. Dekker program of The Netherlands Heart Foundation (2005T014). K.Y. and I.I. were supported by the Core Research for Evolutional Science and Technology, Japan Science and Technology Corporation.
References
- 1.Bederson JB, et al. Recommendations for the management of patients with unruptured intracranial aneurysms: a Statement for healthcare professionals from the Stroke Council of the American Heart Association. Stroke. 2000;31:2742–2750. doi: 10.1161/01.str.31.11.2742. [DOI] [PubMed] [Google Scholar]
- 2.Wellcome Trust Case Control Consortium Genome-wide association study of 14,000 cases of seven common diseases and 3,000 shared controls. Nature. 2007;447:661–678. doi: 10.1038/nature05911. [DOI] [PMC free article] [PubMed] [Google Scholar]
- 3.McPherson R, et al. A common allele on chromosome 9 associated with coronary heart disease. Science. 2007;316:1488–1491. doi: 10.1126/science.1142447. [DOI] [PMC free article] [PubMed] [Google Scholar]
- 4.Helgadottir A, et al. A common variant on chromosome 9p21 affects the risk of myocardial infarction. Science. 2007;316:1491–1493. doi: 10.1126/science.1142842. [DOI] [PubMed] [Google Scholar]
- 5.Helgadottir A, et al. The same sequence variant on 9p21 associates with myocardial infarction, abdominal aortic aneurysm and intracranial aneurysm. Nat. Genet. 2008;40:217–224. doi: 10.1038/ng.72. [DOI] [PubMed] [Google Scholar]
- 6.Matsui T, et al. Redundant roles of Sox17 and Sox18 in postnatal angiogenesis in mice. J. Cell Sci. 2006;119:3513–3526. doi: 10.1242/jcs.03081. [DOI] [PubMed] [Google Scholar]
- 7.Sakamoto Y, et al. Redundant roles of Sox17 and Sox18 in early cardiovascular development of mouse embryos. Biochem. Biophys. Res. Commun. 2007;360:539–544. doi: 10.1016/j.bbrc.2007.06.093. [DOI] [PubMed] [Google Scholar]
- 8.Kim I, Saunders TL, Morrison SJ. Sox17 dependence distinguishes the transcriptional regulation of fetal from adult hematopoietic stem cells. Cell. 2007;130:470–483. doi: 10.1016/j.cell.2007.06.011. [DOI] [PMC free article] [PubMed] [Google Scholar]
- 9.Janzen V, et al. Stem-cell ageing modified by the cyclin-dependent kinase inhibitor p16INK4a. Nature. 2006;443:421–426. doi: 10.1038/nature05159. [DOI] [PubMed] [Google Scholar]
- 10.Schievink WI, Schaid DJ, Michels VV, Piepgras DG. Familial aneurysmal subarachnoid hemorrhage: a community-based study. J. Neurosurg. 1995;83:426–429. doi: 10.3171/jns.1995.83.3.0426. [DOI] [PubMed] [Google Scholar]
- 11.Foroud T, et al. Genome screen to detect linkage to intracranial aneurysm susceptibility genes: the Familial Intracranial Aneurysm (FIA) study. Stroke. 2008;39:1434–1440. doi: 10.1161/STROKEAHA.107.502930. [DOI] [PMC free article] [PubMed] [Google Scholar]
- 12.Nahed BV, et al. Mapping a mendelian form of intracranial aneurysm to 1p34.3-p36.13. Am. J. Hum. Genet. 2005;76:172–179. doi: 10.1086/426953. [DOI] [PMC free article] [PubMed] [Google Scholar]
- 13.Ozturk AK, et al. Molecular genetic analysis of two large kindreds with intracranial aneurysms demonstrates linkage to 11q24-25 and 14q23-31. Stroke. 2006;37:1021–1027. doi: 10.1161/01.STR.0000206153.92675.b9. [DOI] [PubMed] [Google Scholar]
- 14.Ruigrok YM, et al. Genomewide linkage in a large Dutch family with intracranial aneurysms: replication of 2 loci for intracranial aneurysms to chromosome 1p36.11-p36.13 and Xp22.2-p22.32. Stroke. 2008;39:1096–1102. doi: 10.1161/STROKEAHA.107.495168. [DOI] [PubMed] [Google Scholar]
- 15.Gudbjartsson DF, et al. Variants conferring risk of atrial fibrillation on chromosome 4q25. Nature. 2007;448:353–357. doi: 10.1038/nature06007. [DOI] [PubMed] [Google Scholar]
- 16.Luca D, et al. On the use of general control samples for genome-wide association studies: genetic matching highlights causal variants. Am. J. Hum. Genet. 2008;82:453–463. doi: 10.1016/j.ajhg.2007.11.003. [DOI] [PMC free article] [PubMed] [Google Scholar]
- 17.Clayton DG, et al. Population structure, differential bias and genomic control in a large-scale, case-control association study. Nat. Genet. 2005;37:1243–1246. doi: 10.1038/ng1653. [DOI] [PubMed] [Google Scholar]
- 18.Freedman ML, et al. Assessing the impact of population stratification on genetic association studies. Nat. Genet. 2004;36:388–393. doi: 10.1038/ng1333. [DOI] [PubMed] [Google Scholar]
- 19.Shibuya M. Differential roles of vascular endothelial growth factor receptor-1 and receptor-2 in angiogenesis. J. Biochem. Mol. Biol. 2006;39:469–478. doi: 10.5483/bmbrep.2006.39.5.469. [DOI] [PubMed] [Google Scholar]
- 20.Ziegler BL, et al. KDR receptor: a key marker defining hematopoietic stem cells. Science. 1999;285:1553–1558. doi: 10.1126/science.285.5433.1553. [DOI] [PubMed] [Google Scholar]
- 21.Frazer KA, et al. A second generation human haplotype map of over 3.1 million SNPs. Nature. 2007;449:851–861. doi: 10.1038/nature06258. [DOI] [PMC free article] [PubMed] [Google Scholar]
- 22.Zeggini E, et al. Replication of genome-wide association signals in UK samples reveals risk loci for type 2 diabetes. Science. 2007;316:1336–1341. doi: 10.1126/science.1142364. [DOI] [PMC free article] [PubMed] [Google Scholar]
- 23.Scott LJ, et al. A genome-wide association study of type 2 diabetes in Finns detects multiple susceptibility variants. Science. 2007;316:1341–1345. doi: 10.1126/science.1142382. [DOI] [PMC free article] [PubMed] [Google Scholar]
- 24.Saxena R, et al. Genome-wide association analysis identifies loci for type 2 diabetes and triglyceride levels. Science. 2007;316:1331–1336. doi: 10.1126/science.1142358. [DOI] [PubMed] [Google Scholar]
- 25.Pasmant E, et al. Characterization of a germ-line deletion, including the entire INK4/ARF locus, in a melanoma-neural system tumor family: identification of ANRIL, an antisense noncoding RNA whose expression coclusters with ARF. Cancer Res. 2007;67:3963–3969. doi: 10.1158/0008-5472.CAN-06-2004. [DOI] [PubMed] [Google Scholar]
- 26.Zeggini E, et al. Meta-analysis of genome-wide association data and large-scale replication identifies additional susceptibility loci for type 2 diabetes. Nat. Genet. 2008;40:638–645. doi: 10.1038/ng.120. [DOI] [PMC free article] [PubMed] [Google Scholar]
- 27.Romeo S, et al. Population-based resequencing of ANGPTL4 uncovers variations that reduce triglycerides and increase HDL. Nat. Genet. 2007;39:513–516. doi: 10.1038/ng1984. [DOI] [PMC free article] [PubMed] [Google Scholar]
- 28.Ji W, et al. Rare independent mutations in renal salt handling genes contribute to blood pressure variation. Nat. Genet. 2008;40:592–599. doi: 10.1038/ng.118. [DOI] [PMC free article] [PubMed] [Google Scholar]
- 29.Asahara T, et al. Isolation of putative progenitor endothelial cells for angiogenesis. Science. 1997;275:964–967. doi: 10.1126/science.275.5302.964. [DOI] [PubMed] [Google Scholar]
- 30.Purhonen S, et al. Bone marrow-derived circulating endothelial precursors do not contribute to vascular endothelium and are not needed for tumor growth. Proc. Natl. Acad. Sci. USA. 2008;105:6620–6625. doi: 10.1073/pnas.0710516105. [DOI] [PMC free article] [PubMed] [Google Scholar]
Associated Data
This section collects any data citations, data availability statements, or supplementary materials included in this article.