

Abstract
This study described the San Diego Odor Identification Test (SDOIT) reliability and compared the SDOIT and the Brief Smell Identification Test (B-SIT). Ninety participants aged 50–70 years completed this 2-visit olfaction study. During visit 1, the SDOIT and B-SIT were administered according to standard protocols. Three weeks later, participants returned to retake the SDOIT. The SDOIT score was the total number of odorants correctly identified out of 8 odorants presented, and olfactory impairment was defined as correctly identifying less than 6 odorants. The B-SIT score was the total number of odorants correctly identified out of 12 odorants presented, and participants correctly identifying less than 9 odorants were categorized as abnormal. The SDOIT reliability was high (concordance correlation coefficient = 0.85, 95% confidence interval [CI] = 0.79–0.91). The same score was obtained on retest for 73% of participants, whereas 18% improved, and 9% declined. Test–retest agreement was 96% for the SDOIT; 4% improved from impaired at visit 1 to unimpaired at visit 2. Overall, SDOIT impairment classification and B-SIT abnormal classification agreed in 96% of participants (κ = 0.81, 95% CI = 0.63–0.99). In conclusion, the SDOIT showed good test–retest reliability. Agreement for impaired/abnormal olfaction was demonstrated for the SDOIT and the B-SIT.
Keywords: epidemiology, impairment, methods, olfaction
Introduction
Increasingly, olfactory impairment is becoming recognized as an important problem in aging. Two cross-sectional population-based studies have reported increased prevalence of olfactory impairment with older age (Murphy et al. 2002; Bramerson et al. 2004). As epidemiological studies begin to include measures of olfactory impairment, standardized olfactory test characteristics become important to describe. Test reliability is particularly important as longitudinal studies of olfactory impairment are conducted in order to distinguish test variability from true change.
External factors may contribute to fluctuations in olfactory test results upon repeat testing. For example, testing conditions (ambient temperature, humidity) may vary, or a participant's health may change from one testing period to another. Studies have shown relationships between olfactory functioning and smoking (Frye et al. 1990; Murphy et al. 2002; Ishimaru and Fujii 2007; Katotomichelakis et al. 2007; Vennemann et al. 2008), upper respiratory symptoms (Doty and Mishra 2001; Murphy et al. 2002), and medication use (Deems et al. 1991; Schiffman and Zervakis 2002; Doty et al. 2003). Recently, researchers have investigated the influence of temperature and humidity on olfactory function (Philpott et al. 2007; Kuehn et al. 2008). The contribution of such factors to olfactory test–retest reliability may influence the design and analysis of longitudinal studies as these factors may be adjusted for in analyses.
Test–retest reliability has been described for 10 different olfactory tests including odor identification, detection thresholds, odor memory, discrimination, and rating of pleasantness (Doty et al. 1995). Odor identification has been the focus for large-scale epidemiological studies describing olfactory impairment. Two commonly used olfactory tests are the San Diego Odor Identification Test (SDOIT) (Murphy et al. 1994; Morgan et al. 1995; Murphy et al. 2002) and the Brief Smell Identification Test (B-SIT) (Doty 2001). The SDOIT consists of 8 common household odorants presented in opaque jars and includes a picture board to assist odor identification. This test was originally developed for use in children but has also been used in adults (Morgan et al. 1995; Murphy et al. 2002; Schubert et al. 2008). The B-SIT is a shortened version of the University of Pennsylvania Smell Identification Test (UPSIT) and includes a booklet of 12 odorants that are released when scratched with a pencil tip. Both tests can be administered in a relatively short amount of time and in this way are amenable to testing populations. However, the B-SIT is more expensive than the SDOIT and therefore may not be feasible for large studies where cost is a major concern.
Test–retest reliability has been reported for the B-SIT among adults aged 18–83 years (Doty et al. 1995), but SDOIT reliability has not yet been reported in an older age range. SDOIT test–retest reliability among middle-aged and older adults is particularly relevant to studies of olfactory impairment and aging. In addition to describing test reliability, assessing agreement between classifications using the SDOIT and B-SIT is essential for comparisons across studies. The objectives of this study were to describe the SDOIT reliability in an adult population; assess the influence of nasal symptoms, general health, medications, and testing conditions (ambient temperature and humidity) on any changes in SDOIT score; and compare results from the SDOIT and the B-SIT.
Materials and methods
Men and women aged 50–70 years were recruited between November 2006 and December 2007 from the Madison, WI, and Beaver Dam, WI, for participation in this 2-visit olfaction study. During the first visit, the SDOIT and the B-SIT were administered according to standardized protocols (Murphy et al. 1994; Morgan et al. 1995; Doty 2001; Murphy et al. 2002). The order of test administration was randomized. A brief health questionnaire providing information regarding upper respiratory symptoms in the past week, smoking status, and prescription medication use was also completed at the first visit. Specific questions used to assess upper respiratory symptoms included the following: 1) Have you had a cold within the past week (7 days)?, 2) Have you had any sinus problems in the past week (7 days)?, and 3) Do you have a stuffy nose now?. An average of 3 weeks later (range = 2–5 weeks), participants returned for their second visit, during which the SDOIT was administered and health information collected once more. In addition, participants were asked if there had been a major change in their health status in the past month. Room temperature (measured in Fahrenheit degrees) and humidity (measured by percentage) were recorded at both visits.
Thirty-three men and 57 women participated in this study. One participant did not return for the second visit but did provide SDOIT and B-SIT comparative data from the first visit. Participants ranged in age from 50 to 70 years, with median age 57 years. At the first visit, 35 (38%) participants reported a current stuffy nose or a cold or sinus problems in the past week. Such participants were not excluded from the analysis so that estimates of test–retest reliability would be generalizable to epidemiological studies where all participants are tested, regardless of nasal symptoms. Only 3 (3%) participants reported current smoking.
The SDOIT consists of 8 common household odorants presented at intervals of 45 s to minimize adaptation. Odorants were kept in opaque containers, and participants were asked to close their eyes when the odor was presented to diminish visual cues. To assist identification, illustrations of the test odorants and 12 distracters were displayed on a picture board. Participants could choose any 1 of the 20 pictures to identify each odorant. Participants were informed of the correct name for odorants that were misidentified after the first presentation. After all 8 odorants had been presented in a randomized order, any misidentified odorants were presented again to allow for learning of unfamiliar odors that were detected. The total olfaction score using the SDOIT was defined as the cumulative number of odorants (score range = 0–8) correctly identified after a maximum of 2 presentations, and olfactory impairment was defined as correctly identifying fewer than 6 odorants (Murphy et al. 2002). Further details on this test have been published previously (Murphy et al. 2002).
The B-SIT includes 12 odorants embedded on scent strips and released when scratched with a pencil tip. A 4-category multiple choice question, asking what the scent smells most like, corresponded to the scent strip for each odorant. The B-SIT is a forced-choice test, meaning participants were instructed to identify each odorant as 1 of the 4 choices, even if no particular smell was perceived. The odorants used in the B-SIT are different from those used in the SDOIT, except for chocolate and cinnamon that are presented in both tests. The total olfaction score using the B-SIT was defined as the number of odorants correctly identified out of the 12 tested, and abnormal olfactory functioning was defined as correctly identifying fewer than 9 odorants (Doty 2001). For participants missing an individual odorant result on the B-SIT, the total score was set to missing. However, such participants may still be classified as normal or abnormal, if possible from the nonmissing odorant data. This study was approved by the University of Wisconsin-Madison Institutional Review Board, and all participants provided written informed consent.
Statistical methods
SDOIT reliability was estimated for 3 different levels of data. Agreement for each odorant and for classification of impairment between the 2 visits was calculated as a simple percentage. Reliability for the total olfaction score was estimated using the concordance correlation coefficient (CCC) (Lin 1989) with 95% confidence intervals (CIs) to measure the extent of agreement between olfaction scores at the first and second visit. The CCC describes the extent to which a square plot of the scores from visit 1 by scores from visit 2 corresponds to a 45° line (perfect concordance). In this way, it more appropriately describes agreement than the Pearson correlation coefficient, which measures the extent of any linear relationship.
Correlations between changes in SDOIT scores and changes in temperature or humidity were estimated using the Spearman correlation coefficient. Visit 1 SDOIT and B-SIT agreement was assessed using the kappa statistic with 95% CIs. Differences between SDOIT and B-SIT correct identification of the odorants cinnamon and chocolate were tested with McNemar's test. SAS 9.1 (SAS Institute Inc, Cary, NC) and Stata 10.1 (StataCorp, College Station, TX) statistical software were used for analyses.
Results
SDOIT reliability
In terms of correctly identifying individual odorants, percent agreement ranged from 84% for bubble gum to 98% for mustard (Figure 1). Most of this agreement involved correct identification of an odorant at both visits, with few participants incorrectly identifying an odorant at both visits. Disagreement occurred in both directions (incorrect identification followed by correct identification or correct identification followed by incorrect identification) with similar frequencies for most odorants, although bubble gum and baby powder tended to show greater numbers with incorrect identification at visit 1 and correct identification at visit 2 (n = 10 and 8, respectively) than vice versa (n = 4 and 2, respectively).
Figure 1.

Percent agreement between visits 1 and 2 for correct identification of each odorant included in the SDOIT. Shading indicates types of agreement present (correct identification at both visits vs. incorrect identification at both visits).
Total olfaction scores also agreed well (CCC = 0.85, 95% CI = 0.79–0.91, Figure 2). The mean SDOIT score was 7.18 (standard deviation [SD] = 1.52) for visit 1 and 7.35 (SD = 1.49) for visit 2. Thus, the mean difference between scores at visit 2 and visit 1 was 0.17 (SD = 0.82). Most (73%) scored the same on the SDOIT at both visits, whereas 18% improved (8 by 1 unit, 7 by 2, and 1 by 3), and 9% declined (7 by 1 unit and 1 by 3 units). Thus, among the 24 participants whose SDOIT score changed from visit 1 to visit 2, the majority (63%) changed by only one unit. Few of the changes in SDOIT score resulted in a change in olfactory impairment classification. All 76 participants classified as unimpaired at visit 1 remained unimpaired at visit 2, whereas 4 of 13 impaired participants improved to unimpaired at visit 2. Thus, total agreement for classification of impairment was 96%.
Figure 2.

Paired results of the SDOIT score at visit 2 by the SDOIT score at visit 1. The size of the bubbles corresponds to the number of participants in each category, shown to the lower right of the bubble. Dashed horizontal and vertical reference lines separate categories of olfactory impairment (SDOIT score < 6) and unimpairment (SDOIT score ≥ 6).
Potential explanatory factors for changes in SDOIT score
Next, we examined whether changes in health status could explain any observed changes in SDOIT olfaction scores. Most participants did not report a change in upper respiratory symptoms from visit 1 to visit 2, with only 17% reporting differences in cold status, 20% differing in sinus problems, and 21% differing in stuffy nose symptoms. These changes in upper respiratory symptoms could not explain all fluctuations in olfactory score; most differences in score occurred among participants reporting no change in upper respiratory symptoms (Table 1).
Table 1.
SDOIT score change by health status
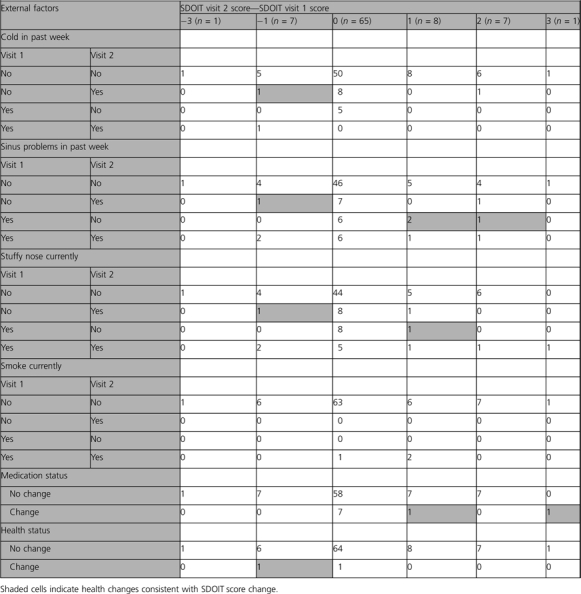 |
Smoking status did not change for any participant between the 2 visits. Only 2 (2%) reported a major change in health status, and 9 (10%) reported a change in medications. One of the 9 participants reporting a change in medications had one of the largest differences in olfactory scores. Of the 24 participants who had a change in SDOIT score of one or more units, one-third reported a corresponding change in the appropriate direction for at least one of the health conditions reported on the questionnaire (Table 1). Of the remaining 16 with a change in SDOIT score, 4 participants reported upper respiratory problems at both visits, making it difficult to determine whether changes in olfactory function as measured by the SDOIT correlated with health.
Room humidity and temperature varied between visits but not in any systematic way (mean difference = 0.76% and 0.35°, respectively). Fluctuations in these test conditions did not correlate with changes in the SDOIT olfaction score (r = −0.03, P = 0.80, for temperature; r = 0.10, P = 0.35, for humidity).
SDOIT versus B-SIT
The mean B-SIT score at visit 1 was 10.30 (SD = 1.79). SDOIT impairment classification and B-SIT abnormal classification at visit 1 agreed for 96% of participants (κ = 0.81, 95% CI = 0.63–0.99, Table 2). Of the 4 participants who disagreed on the 2 tests, 3 were classified as impaired by the SDOIT but normal by the B-SIT.
Table 2.
SDOIT versus B-SIT classifications
| SDOIT classification | B-SIT classification |
Total | |
| Normal | Abnormal | ||
| Unimpaired | 76 | 1 | 77 |
| Impaired | 3 | 10 | 13 |
| Total | 79 | 11 | 90 |
Identification of the odorant cinnamon varied by test. A greater proportion of participants correctly identified cinnamon in the SDOIT than in the B-SIT (93% vs. 79%, respectively, P = 0.003). Seventy-one (79%) participants classified cinnamon the same (correct or incorrect) for both tests, whereas 16 (18%) correctly identified cinnamon in the SDOIT but not in the B-SIT, and 3 (3%) correctly identified cinnamon in the B-SIT but not in the SDOIT.
Chocolate was identified similarly in the SDOIT and the B-SIT with only 7 (8%) participants showing disagreement between the 2 tests (P = 0.26). Unlike cinnamon, chocolate was identified correctly in the B-SIT by slightly more participants (96%) than in the SDOIT (92%).
Discussion
The SDOIT showed good test–retest reliability when administered to adults on 2 different occasions separated by an average of 3 weeks. The CCC for the SDOIT (0.85) was similar to test–retest reliability coefficients reported for the UPSIT and the B-SIT (also known as the Cross-Cultural Smell Identification Test), which is the shortened version of the UPSIT (Doty et al. 1995). The majority of participants scored the same on the SDOIT at both visits. We did not exclude participants with nasal symptoms from participating although olfactory function would likely fluctuate because we wanted to be able to extend these results to epidemiological studies in the general population. In such studies, subjects are not excluded from testing because of acute nasal symptoms, but adjustments are made during the analytic process to control for the potential confounding. It is likely that the test's reliability in highly selected subjects as might be included in experimental or small clinical studies is underestimated.
Among participants whose SDOIT score did change between visits, half either reported a change in health consistent with the direction of change in score or reported upper respiratory symptoms at both visits. For this latter group, it is difficult to determine whether the change in SDOIT score corresponds to health because people experiencing sinus problems may have fluctuations in olfactory congestion, and this study did not have a measure of severity of symptoms. Still, adjusting for changes in health, including nasal symptoms and medication use, may be advisable when conducting longitudinal studies of olfactory functioning. We found no significant impact of testing conditions (ambient temperature and humidity) on changes in SDOIT scores.
Because not all participants with a change in SDOIT score reported either a consistent change in health or nasal symptoms at both visits, some of the small variability observed in the SDOIT score is likely true test variability. Among participants with shifts in SDOIT score upon repeat testing, more increases in score were observed than decreases in score. Although it is possible that this tendency reflects some learning effects over the 3 weeks separating the visits, it is unlikely given the administration protocol. Within a single administration of the SDOIT, participants have a second opportunity to identify any odorants initially misidentified. The score is based on the total number correctly identified (e.g., 5 on the first presentation and 2 on the second would equal a score of 7/8). The SDOIT was designed to overcome some of the naming difficulties older adults may experience and to minimize the misclassification due to unfamiliar odorants. For example, a person may not have used Play-Doh and therefore not know the name of the odor but can correctly identify it once the name is known. This learning would occur within the first test. It is unlikely that a participant would be unable to learn the correct identification between these 2 presentations but be able to learn it within the next 3 weeks. In addition, the picture board used in the test contains 20 possible odorants, and participants do not know in advance that the same 8 odorants will be used each time, further minimizing potential learning effects for repeat measures. With longer follow-up periods, as in the years between examination phases in epidemiological studies, the potential impact of learning is diminished.
SDOIT classifications of impairment at the 2 separate visits also agreed very well, with only 4% of classifications disagreeing. Thus, the SDOIT is a good candidate for use in longitudinal studies examining change in olfactory impairment, for example, incidence of olfactory impairment. However, because the SDOIT exhibited some test variability, sensitivity analyses that exclude those who change impairment categories due to a one-unit shift in score may be warranted. Although 9 participants did change SDOIT scores by more than one unit, only 3 of the 9 also changed impairment status categories. The number of participants classified as olfactory impaired in this study was relatively small. However, the resulting prevalence of impairment observed in this sample is similar to what has been reported in populations, for the same age range (Murphy et al. 2002). Therefore, estimates of test–retest reliability from this study should be fairly representative of test characteristics when the SDOIT is used in a population of middle-aged and older adults.
In order to feasibly and efficiently measure health outcomes, large-scale epidemiological studies require standardized tools that are rapid, are relatively inexpensive, and present minimal burden to participants. In addition to having good reliability, the SDOIT meets these criteria. There is a standardized protocol for the SDOIT, the test only takes an average of 15 min to administer, and the cost is reasonably low. This test is also easy to maintain. Further, the SDOIT is generally well received by participants and considered an enjoyable experience. Thus, the SDOIT would be a suitable choice for measuring olfactory impairment in epidemiological studies. Because names for unfamiliar odors can be learned by the second presentation and the picture board can assist with naming difficulties as might be experienced with mild cognitive impairment, the SDOIT might be preferred in some studies. The B-SIT is quick, minimally burdensome to participants, and easily portable and has been shown to have good test–retest reliability (Doty et al. 1995). However, the cost of the B-SIT may be prohibitive for many large studies. We compared the SDOIT and B-SIT classifications of impaired/abnormal olfaction when administered to participants on the same occasion in order to understand how to interpret studies reporting the prevalence of olfactory impairment based on 1 of these 2 testing methods. SDOIT impairment classifications and B-SIT abnormal classifications were in agreement for all but a few participants. These results suggest that little if any variation in prevalence estimates in middle-aged and older adults would be due to differences in measurement methods.
Further comparisons between the SDOIT and B-SIT for the 2 odorants that were presented in both tests showed that cinnamon was correctly identified significantly more often in the SDOIT than in the B-SIT, whereas chocolate was identified similarly in the 2 tests. Differences in the strength of the odorant released may explain the discrepancies in cinnamon identification. Cinnamon can become stronger with time, and therefore, the essence of the cinnamon used in the B-SIT may not be as strong as the older SDOIT cinnamon kept in a jar.
Both the SDOIT and the B-SIT have limited ability to distinguish levels of olfactory functioning among persons with normal olfactory function. However, in epidemiological studies, the purpose of these tests is often to categorize participants as impaired or abnormal rather than to define gradations of olfactory functioning.
This study showed that the SDOIT has desirable test–retest reliability characteristics for the individual odorants, the summary score, and the classification of impairment. Changes in participant health status, including nasal symptoms and medication use, may explain some but not all of the total variability in SDOIT score. Two of the commonly used odor identification tests, the SDOIT and the B-SIT, gave very similar classifications of impairment or abnormal status. Simple measures of olfactory impairment may be useful tools in epidemiological studies.
Funding
Research to Prevent Blindness Foundation (Wasserman Merit Award); National Institutes of Health (AG021917).
Acknowledgments
We thank the study participants for making this research possible. Preliminary analysis for this research was presented as a poster at the 2008 International Symposium on Olfaction and Taste in San Francisco, CA.
References
- Bramerson A, Johansson L, Ek L, Nordin S, Bende M. Prevalence of olfactory dysfunction: the skovde population-based study. Laryngoscope. 2004;114:733–737. doi: 10.1097/00005537-200404000-00026. [DOI] [PubMed] [Google Scholar]
- Deems DA, Doty RL, Settle RG, Moore-Gillon V, Shaman P, Mester AF, Kimmelman CP, Brightman VJ, Snow JB. Smell and taste disorders, a study of 750 patients from the University of Pennsylvania Smell and Taste Center. Arch Otolaryngol Head Neck Surg. 1991;117:519–528. doi: 10.1001/archotol.1991.01870170065015. [DOI] [PubMed] [Google Scholar]
- Doty RL. The Brief Smell Identification Test™ administration manual. Haddon Height (NJ): Sensonics Inc; 2001. [Google Scholar]
- Doty RL, McKeown DA, Lee WW, Shaman P. A study of the test-retest reliability of ten olfactory tests. Chem Senses. 1995;20(6):645–656. doi: 10.1093/chemse/20.6.645. [DOI] [PubMed] [Google Scholar]
- Doty RL, Mishra A. Olfaction and its alteration by nasal obstruction, rhinitis, and rhinosinusitis. Laryngoscope. 2001;111:409–423. doi: 10.1097/00005537-200103000-00008. [DOI] [PMC free article] [PubMed] [Google Scholar]
- Doty RL, Philip S, Reddy K, Kerr KL. Influences of antihypertensive and antihyperlipidemic drugs on the senses of taste and smell: a review. J Hypertens. 2003;21:1805–1813. doi: 10.1097/00004872-200310000-00003. [DOI] [PubMed] [Google Scholar]
- Frye RE, Schwartz BS, Doty RL. Dose-related effects of cigarette smoking on olfactory function. J Am Med Assoc. 1990;263:1233–1236. [PubMed] [Google Scholar]
- Ishimaru T, Fujii M. Effects of smoking on odour identification in Japanese subjects. Rhinology. 2007;45(3):224–228. [PubMed] [Google Scholar]
- Katotomichelakis M, Balatsouras D, Tripsianis G, Davris S, Maroudias N, Danielides V, Simopoulos C. The effect of smoking on the olfactory function. Rhinology. 2007;45(4):273–280. [PubMed] [Google Scholar]
- Kuehn M, Welsch H, Zahnert T, Hummel T. Changes of pressure and humidity affect olfactory function. Eur Arch Otorhinolaryngol. 2008;265:299–302. doi: 10.1007/s00405-007-0446-2. [DOI] [PubMed] [Google Scholar]
- Lin LIK. A concordance correlation coefficient to evaluate reproducibility. Biometrics. 1989;45:255–268. [PubMed] [Google Scholar]
- Morgan CD, Nordin S, Murphy C. Odor identification as an early marker for Alzheimer's disease: impact of lexical functioning and detection sensitivity. J Clin Exp Neuropsychol. 1995;17:793–803. doi: 10.1080/01688639508405168. [DOI] [PubMed] [Google Scholar]
- Murphy C, Anderson JA, Markison S. Psychophysical assessment of chemosensory disorders in clinical populations. In: Kurihara K, Suzuki N, Ogawa H, editors. Olfaction and taste XI. Tokyo (Japan): Springer-Verlag; 1994. 609 pp.613 pp. [Google Scholar]
- Murphy C, Schubert CR, Cruickshanks KJ, Klein BE, Klein R, Nondahl DM. Prevalence of olfactory impairment in older adults. JAMA. 2002;288(18):2307–2312. doi: 10.1001/jama.288.18.2307. [DOI] [PubMed] [Google Scholar]
- Philpott CM, Wolstenholme CR, Goodenough PC, Clark A, Murty GE. Which variables matter in smell tests in the clinic? J Laryngol Otol. 2007;121(10):952–956. doi: 10.1017/S0022215107006408. [DOI] [PubMed] [Google Scholar]
- Schiffman SS, Zervakis J. Taste and smell perception in the elderly: effect of medications and disease. Adv Food Nutr Res. 2002;44:247–346. doi: 10.1016/s1043-4526(02)44006-5. [DOI] [PubMed] [Google Scholar]
- Schubert CR, Carmichael LL, Murphy C, Klein BEK, Klein R, Cruickshanks KJ. Olfaction and the 5-year incidence of cognitive impairment in an epidemiological study of older adults. J Am Geriatr Soc. 2008;56(8):1517–1521. doi: 10.1111/j.1532-5415.2008.01826.x. [DOI] [PMC free article] [PubMed] [Google Scholar]
- Vennemann M, Hummel T, Berger K. The association between smoking and smell and taste impairment in the general population. J Neurol. 2008;255(8):1121–1126. doi: 10.1007/s00415-008-0807-9. [DOI] [PubMed] [Google Scholar]