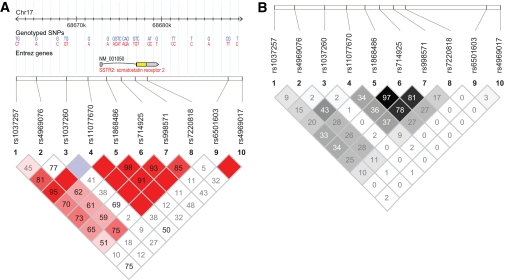
FIG. 1.
Haploview-generated LD map of the 10 SNPs at the SSTR2 locus in unrelated Hispanic Americans from the IRASFS. A: Regions of high LD (D′ = 1 and logarithm of odds [LOD] >2) are shown in the darkest shade. Markers with lower LD (0.45 < D′ < 1 and LOD >2) are shown in dark through light shades, with the color intensity decreasing with decreasing D′ value. Regions of low LD and low LOD scores (LOD <2) are shown in white. The number within each box indicates the D′ statistic value between the corresponding two SNPs. B: Regions of high correlation (r2 = 1) are shown in black. Markers with lower correlations (0 < r2 < 1) are shown in shades of gray with the color intensity decreasing with decreasing r2 value. Regions of low correlation (r2 = 0) are shown in white.

