Abstract
We present real-time detection of airborne Vaccinia viruses using quartz crystal microbalance (QCM) in an integrated manner. Vaccinia viruses were aerosolized and neutralized using an electrospray aerosol generator, transported into the QCM chamber, and captured by a QCM crystal. The capture of the viruses on the QCM crystal resulted in frequency shifts proportional to the number of viruses. The capture rate varied linearly with the concentration of initial virus suspensions (8.5×10⁸–8.5×10¹⁰ particles∕ml) at flow rates of 2.0 and 1.1 l∕min. This work demonstrates the general potential of mass sensitive detection of nanoscale biological entities in air.
Detection of nanoscale airborne organisms in a sensitive and rapid manner has been important for biological research, public health, and homeland security applications. Conventional bioaerosol detection techniques include culture-based analysis,1 microscope-based methods,2 and conventional polymerase chain reaction (PCR).3 However, these methods can require relatively long times for sample preparation, collection, and analysis.4 Recently, several techniques such as bioaerosol mass spectrometry (BAMS),5 real-time PCR,6, 7 and flow cytometry,8, 9, 10 have been developed. The BAMS is a rapid, real-time, and reagentless technique that can sample and analyze single cells, but it is most effective in the size range of 0.5–7 μm.5 Also, real-time PCR has demonstrated excellent capabilities of rapid sample identification and quantification. However, this technique requires the target analyte to be transferred to a fluid before analysis as well as the use of expensive reagents and significant expertise. Similarly, flow cytometry is very useful for rapid detection and quantification of microscale biological entities in fluids and, more recently, vibrating miniaturized channels have been reported to detect viruses and nanoparticles via their mass in fluids.10
The quartz crystal microbalance (QCM) has been commonly used to detect a variety of nanoscale target analytes in liquid environment due to the advantages including simplicity of operation, real-time output, and label-free analysis.11 The basic QCM operation is described by the Sauerbrey equation where a mass change (Δm) in the crystal results in a subsequent change (Δf) in its resonance frequency.
| (1) |
Here, CQCM is the mass sensitivity constant (17.7 ng cm−2 Hz−1 for the crystal used in this study) and n is the overtone number (n=3 in this study).12
In this paper, we present real-time measurements of airborne Vaccinia viruses using a QCM. Vaccinia viruses are typically brick-shaped with an approximate size of 200×200×250 nm3.13, 14 Among numerous airborne microorganisms, Vaccinia virus was chosen for this study due to its robustness and resistance to environmental stresses. In fact because of these properties, it is regarded as a possible bioterrorism or biowarfare agent.15 With this study, we demonstrate the potential of the QCM as a mass sensitive device to perform the detection of nanoscale entities in air. We use an electrospray aerosol generator as a means to generate the airborne virus particles.
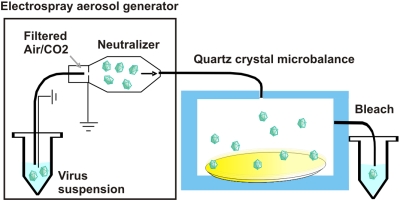
Figure 1 shows a schematic of the overall experimental setup consisting of an electrospray aerosol generator (model 3480, TSI, Inc., St. Paul, MN) and a QCM (D300, Q-Sense, MD). Highly charged airborne Vaccinia viruses were gene-ated under a gas mixture of Air and CO2 using an electrospray aerosol generator from a virus suspension. The generated airborne viruses were then neutralized by a Polonium-210 source (Po-2042, NRD, Inc., Grand Island, NY), resulting in charge-equilibrated bioaerosols. These viruses were transported into the QCM chamber and adsorbed onto a gold-coated 5 MHz AT-cut quartz crystal (QSX 301, Q-Sense, MD), resulting in frequency shifts. A cleaned, gold-coated QCM crystal was mounted into the QCM chamber where constant temperature was maintained by a temperature controller.
Figure 1.
Schematic of airborne virus detection system by combining electrospray aerosol generation and QCM.
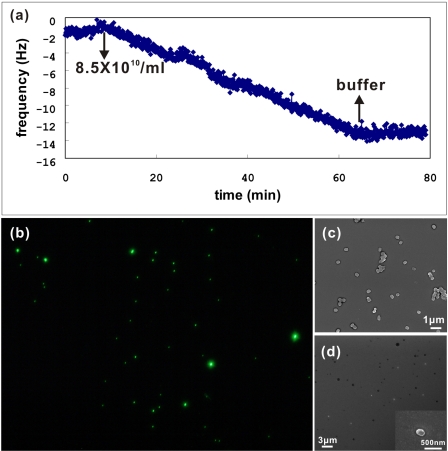
Figure 2a shows the QCM response to injection of a virus suspension with a concentration of 8.5×10¹⁰ particles∕ml. As expected, the frequency decreases due to the adsorption of the virus particles on the crystal. The resulting 12 Hz frequency change corresponds to 70.8 ng∕cm2 according to Eq 1. Given that the area of the QCM crystal is 0.7854 cm2 and the mass of the single virus is approximately 9 fg,13, 14 the number of viruses can be approximated to be 6.16×10⁶. As an independent verification, we used fluorescence microscopy to count the viruses on the QCM chip. Figure 2b shows the fluorescent image of the captured viruses in an area of 370.0×276.0 μm2. The viruses were stained by 3,3′ dihexyloxacarbocyanine iodide [DiOC63], imaged under an epifluorescent microscope, and counted using IMAGEJ. The imaging∕counting was performed on four different areas on the chip, yielding an average of 27478 viruses. Extrapolating this value to the entire area of the chip yields 21.1×10⁶ viruses. Considering the possibility that other areas on the chip might very well have accumulated fewer number of viruses and that Sauerbrey equation is only an approximation here (since virus particles do not exactly constitute a rigid film),12 the two independently estimated virus numbers are in reasonable agreement. Also shown in Fig. 2 are scanning electron microscope (SEM) images of Vaccinia viruses deposited onto a glass surface directly from a virus suspension (c) and viruses captured on the QCM crystal surface (d), indicating that viruses remain intact after the aerosolizing and capturing.
Figure 2.
(a). Real-time response of QCM due to Vaccinia viruses (8.5×10¹⁰∕ml) captured on a QCM crystal at a flow rate of 2.0 l∕min. (b) Fluorescence micrograph (370.0×276.0 μm2) of the sensor chip (crystal) confirming the capture of viruses. (c) A SEM image of Vaccinia viruses from a virus suspension before electrospray airborne particle generation. (d) A SEM image of Vaccinia viruses captured on a gold QCM crystal, where the white arrows indicate the viruses. The inset shows a single intact Vaccinia virus.
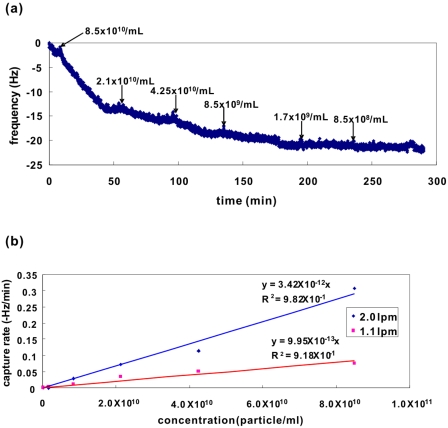
We also investigated the system’s response to variation in the concentration of the virus suspension. Figure 3a shows a time response of the QCM to injections of different concentrations of aerosolized Vaccinia virus suspensions. The viruses were diluted with aqueous 10 mM ammonium acetate buffer (667404, Sigma-Aldrich). After stabilization with the buffer solution, six different concentrations of virus suspensions (8.5×10⁸–8.5×10¹⁰ particles∕ml) were analyzed at a gas flow rate of 2.0 l∕min. The buffer solution was also injected as a control between the subsequent virus injections.
Figure 3.
(a) Real-time measurements with different concentrations (8.5×10⁸–8.5×10¹⁰particles∕ml) of virus suspension where Vaccinia viruses were captured on a QCM crystal at a flow rate of 2.0 l∕min. (b) Variation of capture rate of Vaccinia viruses with different virus concentrations (8.5×10⁸–8.5×10¹⁰ particles∕ml) at flow rates of 1.1 and 2.0 l∕min. The lines indicate linear fits.
Figure 3b demonstrates the dependence of virus capture rate on virus concentration, indicating an approximately linear relationship. Also, lowering the gas flow rate resulted in lower capture rates. It should be noted that the minimum detectable virus concentration can be approximated by considering the noise in the system, i.e., the capture rate signal caused by virus-free buffer injection. For 2.0 l∕min, the noise level is approximately 0.0066 Hz∕min, corresponding to 1.93×10⁹ particles∕ml, which compares well with the time response in Fig. 3a (the values were 0.0057 Hz∕min and 5.77×10⁹∕mL, respectively, for 1.1 l∕min). The concentration of airborne viruses generated at the capillary tip of the aerosol generation system can be approximated by dividing the product of the concentration of the starting virus suspension in fluid (viral particles∕ml) and the suspension feed rate (432 nl∕min) by the gas mixture flow rate (l∕min).16 Considering that only a small fraction of the particles (∼9.5%) out of those generated at the capillary tip can reach the QCM crystal,16 the minimum detectable airborne virus concentrations over the quartz crystal are calculated as around 40 and 210 particles∕ml at a flow rate of 2.0 and 1.1 l∕min, respectively, which are close to the detection limit (10 particles∕ml) by BAMS.17 The current detection limit can be further improved by higher flow rates in combination with secondary amplification techniques such as gold nanoparticle conjugation18 and∕or the use of electric fields to attract the viruses.16
In conclusion, we presented the capture of airborne Vaccinia viruses in real-time using a mass sensitive device. We showed that the capture rate of airborne viruses measured by a QCM was linear with virus concentrations and that it had the potential for quantitative detection of airborne viruses. Our future efforts will be focused on extending this system to specific and selective detection of the airborne viruses. The system demonstrated here can also be used to study the impact of various aerosolized nanoscale entities on the environment and their interactions with living entities.
Acknowledgments
The authors would like to thank Dr. Stanley Kaufman at TSI for his valuable advices on electrospray aerosol generators and Dr. Debby Sherman for help with SEM imaging. We are also thankful for the financial support of the US National Institute of Health (NIBIB Grant No. R21∕R33 EB00778-01). Joonhyung Lee and Jaesung Jang contributed equally to the work.
References
- Zeng Q. Y., Westermark S. O., Rasmuson-Lestander A., and Wang X. R., Appl. Environ. Microbiol. 70, 7295 (2004). [DOI] [PMC free article] [PubMed] [Google Scholar]
- Kildeso J. and Nielsen B. H., Ann. Occup. Hyg. 41, 201 (1997). [DOI] [PubMed] [Google Scholar]
- Williams R. H., Ward E., and McCartney H. A., Appl. Environ. Microbiol. 67, 2453 (2001). [DOI] [PMC free article] [PubMed] [Google Scholar]
- Birch L., Archard C. L., Parkes H. C., and McDowell D. G., Food Control. 12, 535 (2001). [Google Scholar]
- Tobias H. J., Pitesky M. E., Fergenson D. P., Steele P. T., Horn J., Frank M., and Gard E. E., J. Microbiol. Methods 67, 56 (2006). [DOI] [PubMed] [Google Scholar]
- An H. R., Mainelis G., and White L., Atmos. Environ. 40, 7924 (2006). [Google Scholar]
- Pyankov O. V., Agranovski I. E., Pyankova O., Mokhonova E., Mokhonov V., Safatov A. S., and Khromykh A. A., Environ. Microbiol. 9, 992 (2007). [DOI] [PubMed] [Google Scholar]
- Chen P. and Li C., Aerosol Sci. Technol. 39, 231 (2005). [Google Scholar]
- Chen P. and Li C., Analyst (Cambridge, U.K.) 132, 14 (2007). [DOI] [PubMed] [Google Scholar]
- Burg T. P., Godin M., Knudsen S. M., Shen W., Carlson G., Foster J. S., Babcock K., and Manalis S. R., Nature (London) 10.1038/nature05741 446, 1066 (2007). [DOI] [PubMed] [Google Scholar]
- Knudsen S. M., Lee J., Ellington A. D., and Savran C. A., J. Am. Chem. Soc. 127, 2022 (2005).15713061 [Google Scholar]
- Höök F., Ray A., Nordén B., and Kasemo B., Langmuir 10.1021/la0107704 17, 8305 (2001). [DOI] [Google Scholar]
- Johnson L., Gupta A. K., Ghafoor A., Akin D., and Bashir R., Sens. Actuators B 115, 189 (2006). [Google Scholar]
- Gupta A., Akin D., and Bashir R., Appl. Phys. Lett. 10.1063/1.1667011 84, 1976 (2004). [DOI] [Google Scholar]
- Agranovski I. E., Safatov A. S., Pyankov O. V., Sergeev A. A., Sergeev A. N., and Grinshpun S. A., Aerosol Sci. Technol. 39, 912 (2005). [Google Scholar]
- Jang J., Akin D., Lim K. S., Broyles S., Ladisch M. R., and Bashir R., Sens. Actuators B 121, 560 (2007). [Google Scholar]
- Fergenson D. P., Pitesky M. E., Tobias H. J., Steele P. T., Czerwieniec G. A., Russell S. C., Lebrilla C. B., Horn J. M., Coffee K. R., Srivastava A., Pillai S. P., Shih M.-T. P., Hall H. L., Ramponi A. J., Chang J. T., Langlois R. G., Estacio P. L., Hadley R. T., Frank M., and Gard E. E., Anal. Chem. 76, 373 (2004). [DOI] [PubMed] [Google Scholar]
- Henne W. A., Doorneweerd D. D., Lee J., Low P. S., and Savran C. A., Anal. Chem. 10.1021/ac060324r 78, 4880 (2006). [DOI] [PubMed] [Google Scholar]


