Abstract
A photoacoustic imaging system was built and tested to demonstrate the feasibility of high-resolution low-noise ultrasonic imaging based on parallel detection using polymer etalons. Its capability of detecting ultrasound at different elements simultaneously in the optical end was verified by imaging three 49 μm beads. An average noise-equivalent pressure of 3.6 kPa over 50 MHz for 50 μm diameter detection elements in a two-dimensional array with a diameter of 1.35 mm and a detection bandwidth of 75 MHz at –3 dB was measured. These results demonstrate the potential of polymer etalons for high-frame-rate high-resolution three-dimensional photoacoustic and ultrasound pulse-echo imaging.
High-frequency (above 20 MHz) ultrasonic imaging, including pulse-echo1, 2 and photoacoustic (also called optoacoustic) imaging,3, 4 has been applied to applications demanding high resolution. However, no two-dimensional (2D) piezoelectric array has been realized for real-time high-resolution three-dimensional (3D) ultrasonic imaging. In fact, high-frequency piezoelectric 2D arrays would naturally suffer from increased noise levels and wiring and fabrication complexities due to large element count and small element size and spacing. To avoid these issues, one way is to detect and generate ultrasound optically.5
Three properties make resonant optical ultrasound transducers (ROUTs)5, 6, 7, 8, 9, 10, 11, 12, 13, 14, 15, 16, 17 suitable for realizing dense large-element-count high-frequency 2D detection arrays. First, the signal-to-noise ratio (SNR) or sensitivity of a ROUT does not directly depend on its element size and can be improved by increasing the probing light. Second, no complex wiring and electromagnetic interference exist around a ROUT array. Third, the space for optoelectrical transduction and electronics is not limited by the array size or element spacing. In short, a ROUT array’s performance and complexity are irrelevant to its element size.
Polymer Fabry–Pérot etalons are a special type of ROUT.5, 10, 11, 12, 13, 14 Their basic structure is a thin polymer layer with semitransparent mirrors coated on both its sides. The optical reflectivity of an etalon is a function of wavelength. When the probing light experiences a round-trip phase shift of 2mπ, where m is an integer, in the etalon, resonance occurs and the reflectivity drops. In the presence of ultrasound, pressure modulates the etalon thickness and therefore the phase shift. At a wavelength near resonance, the phase modulation is transformed into reflectivity modulation with high gain, and ultrasound detection can be performed by measuring the reflected light power as a function of time.
An ultrasound detection element can be formed on an etalon by focusing the probing light onto an area of interest. Such optically defined elements can be as small as the order of 10 μm. To form an array, different areas can be probed in sequence.10 In this way, however, imaging frame rate is greatly limited. Therefore, to achieve high frame rate, distributing the probing light at a fixed wavelength over a large area to enable parallel detection is preferred.13, 14 Note that although charge-coupled device (CCD) arrays can be used for parallel detection at a time instant,9, 12 they are not suitable for high-frame-rate imaging where low noise and parallel detection at ∼1000 instants (i.e., 1000 consecutive time samples) are required. Element-by-element wavelength adjustment11 is also infeasible in this case.
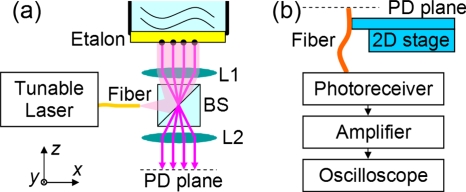
In this study, a photoacoustic imaging system was built and tested to demonstrate the feasibility of high-resolution low-noise ultrasonic imaging based on parallel detection using polymer etalons. As shown in Fig. 1a, the output light from a continuous-wave tunable laser (HP 8168F, Agilent Technologies, Santa Clara, CA) was approximately collimated by a lens (L1) to illuminate an etalon. A unity-magnification two-lens system comprised of L1 and L2 mapped the light reflected from the etalon onto a photodetector plane. The etalon was made on a glass substrate by coating in sequence a 30 nm gold mirror, a 6 μm SU-8 (MicroChem Corp., Newton, MA) polymer layer, another 30 nm gold mirror, and an additional 1.5 μm SU-8 protection layer.
Figure 1.
Setup for photoacoustic imaging. BS, PD, and L stand for beamsplitter, photodetector, and lens, respectively.
As shown in Fig. 1b, one tip of a fiber with a 50 μm (in diameter) core was put on the photodetector plane to deliver light from a 50 μm element on the etalon surface to a photoreceiver (1811-FC, New Focus, San Jose, CA). A 2D translation stage, driven by two motorized actuators (T-LA60, Zaber Technologies Inc., Richmond, BC, Canada), scanned this tip to emulate a photodetector array. Detecting light using this array is equivalent to sensing ultrasound on a corresponding array on the etalon surface. The photoreceiver output was amplified by 30 dB (AU-1310–1103-BNC, MITEQ, Hauppauge, NY) and then digitized using an oscilloscope (WaveSurfer 432, LeCroy, Chestnut Ridge, NY). Note that the system’s optical end is capable of parallel probing and image quality will remain the same if a physical photodetector array of the same quality as the photoreceiver in the system is used to replace mechanical scanning to enable high-frame-rate imaging.
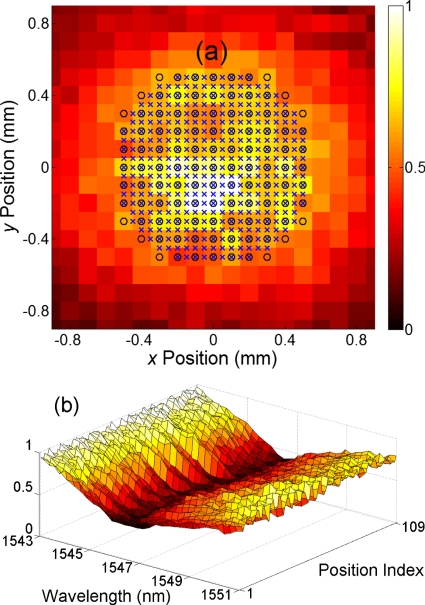
We estimated the light intensity distribution on the ultrasonic array plane (i.e., the etalon surface) by measuring that on the photodetector plane at an off-resonance optical wavelength, 1560 nm. The result is shown in Fig. 2a. The −3 dB spot size was 1.3 mm in diameter. The reflection spectra measured at the positions indicated by circles in this figure are shown in Fig. 2b. The resonance wavelengths at different positions were close to each other, meaning that this etalon has a uniform thickness. We then defined a circular array whose element positions are indicated by x-marks in Fig. 2a. This array has 373 elements, an element spacing of 50 μm, a diameter of ∼1.05 mm, and an optical quality factor of ∼340. To quantify the smoothness of the array, we fitted the light intensity distribution at the circle positions to a 2D Gaussian function and measured the root-mean-squared (RMS) fitting error to be 13% of the mean intensity. According to the spectra shown in Fig. 2b, 1545.2 nm was picked as the probing wavelength across the whole array.
Figure 2.
(a) Estimated light intensity distribution on the etalon surface at 1560 nm, an off-resonance optical wavelength. The −3 dB spot size was 1.3 mm in diameter. (b) Reflection spectra measured at the positions indicated by circles in (a) indexed row by row from the top-left corner.
A photoacoustic imaging experiment was conducted using the imaging system. Three black polystyrene beads (BK050, Microgenics Corp., Fremont, CA) with a diameter of 49 μm were fixed in a gel made from water and 1% agarose (GPG/LE, American Bioanalytical, Natick, MA). This phantom was then put in de-ionized water with the beads ∼1.1 mm from the etalon. A 532 nm pulsed laser (Surelite I-20, Continuum, Santa Clara, CA) illuminated the beads at 28 mJ∕cm2 to generate photoacoustic signals, which were recorded by the circular array with a total probing power of 5 mW. All element data were bandpass filtered over 20–36 MHz and then inputted to a delay-and-sum beamforming algorithm with envelope detection to reconstruct a 3D image.
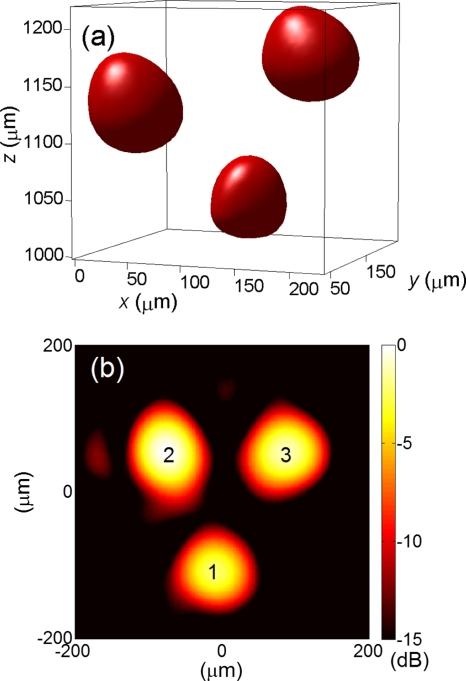
Figure 3a shows the –6 dB isosurface of the image. The (x,y,z) coordinate system is defined in Fig. 1a with the center of the array as its origin. The central positions of the beads were (114, 194, 1034), (56, 60, 1132), and (206,106,1174) μm, and the –6 dB (relative to individual peaks) widths of the bead images were (84, 84, 98), (82, 94, 90), and (100,90,94) μm. The –6 dB length of the bandpass filter was 53 ns, leading to a lower bound of 78 μm to the –6 dB axial (z) resolution. The –6 dB lateral resolution of a circular array can be estimated as 1.41×(F number)×(acoustic central wavelength),18 ignoring apodization due to light distribution. Therefore, the system’s –6 dB lateral (x,y) resolutions were lower bounded to 73, 80, and 83 μm at the beads’ positions. Considering the beads’ physical diameter and the system’s resolution, the image sizes are reasonable. A 2D image on the plane crossing the central positions of the beads is shown in Fig. 3b.
Figure 3.
(a) –6 dB isosurface of a 3D photoacoustic image of three 49 μm beads. (b) A 2D image on the plane crossing the central positions of the beads displayed over a 15 dB dynamic range. The probing wavelength was 1545.2 nm across the whole imaging array indicated by x-marks in Fig. 2a.
To improve SNR to a reasonable level, we incorporated an erbium-doped fiber amplifier (EDFA) (KPS-BT2-C-30-SLM-PM-PB-FA, Keopsys, Lannion, France) into the optical path. The EDFA was driven by the tunable laser and outputted 1 W light to probe the etalon with a −3 dB spot size of 1.3 mm in diameter. The electronic amplifier following the photoreceiver was removed. The noise-equivalent pressure (NEP), a measure of the minimum detectable pressure, of a 50 μm diameter element at the spot center was measured using a calibrated transducer.17 With 0.294 mW dc light to the photoreceiver, this detection element measured 28 mV ac at 30 kPa and an RMS noise level of 2.9 mV over 10–60 MHz. Therefore, its sensitivity and NEP over the 50 MHz band were (28 mV)∕(30 kPa)=0.93 mV∕kPa and (2.9 mV)∕(0.93 mV∕kPa)=3.1 kPa, respectively.
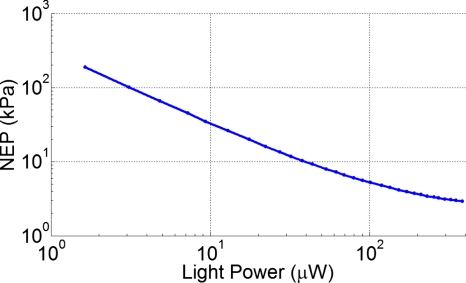
Using the above measurement as a reference, we estimated NEPs at other light powers. Given a light power Pdc, only the corresponding RMS noise level n(Pdc) was measured since the sensitivity is proportional to Pdc. Specifically, NEP(Pdc)=n(Pdc)∕[(0.93 mV∕kPa)×Pdc∕(0.294 mW)]. Figure 4 shows the monotonically decreasing function NEP (Pdc). At low light levels where thermal noise is the dominant noise, NEP is inversely proportional to Pdc. The decrease in NEP with Pdc gradually lessens due to increased shot noise and laser noise. Fitting the measured n2(Pdc) to a second degree polynomial led to n2(Pdc)≈(0.63 mV2)+(13.7 mV2∕mW)Pdc+(43.0 mV2∕mW2)(Pdc)2 with a coefficient of determination R2 of 0.9998.
Figure 4.
NEP vs power of detection light.
Based on NEP(Pdc), the average NEP of 50 μm elements across the central 1.35 mm diameter area of the light spot was estimated to be 3.6 kPa over 50 MHz, not only a two-order improvement over a CCD approach9 but also lower than the NEP of a 75 μm piezoelectric PVDF (polyvinylidene fluoride) transducer (HPM075∕1, Precision Acoustics, Dorchester, Dorset, U.K.),19 which is at least 4.2 kPa {=(60 μV)×[(50 MHz)/(100 MHz)]1∕2∕(10 nV∕Pa)} over the same bandwidth considering only the noise from its matched preamplifier (HP1, Precision Acoustics). If a smaller element diameter such as 25 μm is required, the same level of NEP can be obtained by adjusting the probing light intensity accordingly.
NEP can be reduced by reducing noise or improving sensitivity. By monitoring the EDFA output using an independent photodetector, the second degree term in the polynomial noise model can be greatly eliminated. To make more sensitive etalons, softer polymers can be used. For example, according to our experience, polydimethylsiloxane etalons are more than twice as sensitive as SU-8 etalons. Sensitivity can also be improved by increasing etalons’ quality factor.
Using a previously developed method,17 the detection bandwidth of the system was measured to be 75 MHz at –3 dB, which can provide three- to fourfold better resolution compared to previous CCD-based systems.9, 12 In the imaging experiment, the main band of signals was 0–40 MHz. Therefore, we did not choose a filter with a higher band to achieve better resolution. Nonetheless, according to the 75 MHz bandwidth, for small objects higher resolutions can be achieved using reasonable F numbers without sacrificing SNR. For example, a bandpass filter over 40–72 MHz together with a unity F number leads to –6 dB resolutions of less than 40 μm in all directions for photoacoustic imaging. The resolution of ultrasound pulse-echo imaging can be even better because of two-way focusing, especially in the axial direction where less than 20 μm is expected.
The system described above can perform high-resolution 3D photoacoustic imaging with a reasonable SNR. Incorporating a photodetector array will immediately provide high frame rates, theoretically equal to the repetition frequency of the pulsed laser. To enable ultrasound imaging, etalons may be integrated with ultrasound transmitters such as a gold nanostructure.5, 20
Acknowledgments
Support from NIH (Grant No. EB-003455) is gratefully acknowledged.
References
- Vogt M., Kaspar K., Altmeyer P., Hoffmann K., and El Gammal S., Frequenz 55, 12 (2001). [Google Scholar]
- Coleman D. J., Silverman R. H., Chabi A., Rondeau M. J., Shung K. K., Cannata J., and Lincoff H., Ophthalmology 10.1016/j.ophtha.2003.10.029 111, 1344 (2004). [DOI] [PubMed] [Google Scholar]
- Zemp R. J., Bitton R., Li M. -L., Shung K. K., Stoica G., and Wang L. V., J. Biomed. Opt. 10.1117/1.2709850 12, 010501 (2007). [DOI] [PubMed] [Google Scholar]
- Sethuraman S., Amirian J. H., Litovsky S. H., Smalling R. W., and Emelianov S. Y., Opt. Express 10.1364/OE.15.016657 15, 16657 (2007). [DOI] [PubMed] [Google Scholar]
- Hou Y., Kim J. -S., Ashkenazi S., Huang S. -W., Guo L. J., and O’Donnell M., Appl. Phys. Lett. 10.1063/1.2771058 91, 073507 (2007). [DOI] [Google Scholar]
- Monchalin J. -P., Appl. Phys. Lett. 10.1063/1.96411 47, 14 (1985). [DOI] [Google Scholar]
- Hamilton J. D., Buma T., Spisar M., and O’Donnell M., IEEE Trans. Ultrason. Ferroelectr. Freq. Control 10.1109/58.818758 47, 160 (2000). [DOI] [PubMed] [Google Scholar]
- Wilkens V., J. Acoust. Soc. Am. 10.1121/1.1553457 113, 1431 (2003). [DOI] [PubMed] [Google Scholar]
- Klann M. and Koch C., IEEE Trans. Ultrason. Ferroelectr. Freq. Control 10.1109/TUFFC.2005.1516027 52, 1546 (2005). [DOI] [PubMed] [Google Scholar]
- Ashkenazi S., Hou Y., Buma T., and O’Donnell M., Appl. Phys. Lett. 10.1063/1.1896085 86, 134102 (2005). [DOI] [Google Scholar]
- Beard P. C., IEEE Trans. Ultrason. Ferroelectr. Freq. Control 10.1109/TUFFC.2005.1504022 52, 1002 (2005). [DOI] [PubMed] [Google Scholar]
- Lamont M. and Beard P. C., Electron. Lett. 10.1049/el:20064135 42, 187 (2006). [DOI] [Google Scholar]
- Huang S. -W., Hou Y., Ashkenazi S., and O’Donnell M., Proc.-IEEE Ultrason. Symp. 2007, 719 (2007). [Google Scholar]
- Huang S. -W., Hou Y., Ashkenazi S., and O’Donnell M., Proc. SPIE 10.1117/12.762461 6856, 68561K (2008). [DOI] [Google Scholar]
- Chao C. -Y., Ashkenazi S., Huang S. -W., O’Donnell M., and Guo L. J., IEEE Trans. Ultrason. Ferroelectr. Freq. Control 10.1109/TUFFC.2007.341 54, 957 (2007). [DOI] [PubMed] [Google Scholar]
- Maxwell A., Huang S. -W., Ling T., Kim J. -S., Ashkenazi S., and Guo L. J., IEEE J. Sel. Top. Quantum Electron. 10.1109/JSTQE.2007.914047 14, 191 (2008). [DOI] [PMC free article] [PubMed] [Google Scholar]
- Huang S. -W., Chen S. -L., Ling T., Maxwell A., O’Donnell M., Guo L. J., and Ashkenazi S., Appl. Phys. Lett. 10.1063/1.2929379 92, 193509 (2008). [DOI] [PMC free article] [PubMed] [Google Scholar]
- Chen X., Schwarz K. Q., and Parker K. J., J. Acoust. Soc. Am. 10.1121/1.407329 94, 2979 (1993). [DOI] [PubMed] [Google Scholar]
- See http://www.acoustics.co.uk/products/hpm075-1 for specification including sensitivity.
- Hou Y., Kim J. S., Ashkenazi S., O’Donnell M., and Guo L. J., Appl. Phys. Lett. 10.1063/1.2344929 89, 093901 (2006). [DOI] [Google Scholar]


